Gas and Oil Transportation and Storage Automation Solutions Market Overview and Analysis:
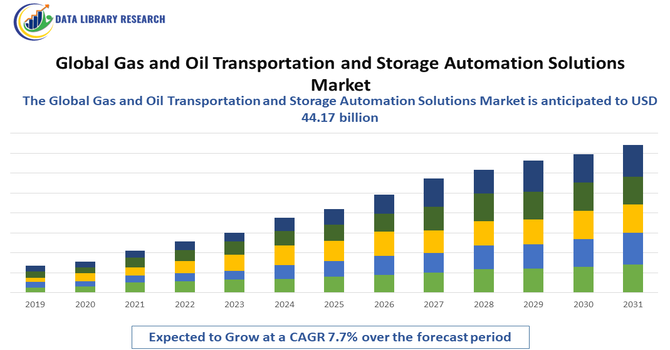
- The Global Gas and Oil Transportation and Storage Automation Solutions Market reached a value of USD 44.17 billion in 2025 and is set to climb to USD 62.17 billion by 2032 is forecast to grow at a steady rate, with the CAGR of 7.7% through 2025-2032.
Get Complete Analysis Of The Report - Download Updated Free Sample PDF
The Global Gas and Oil Transportation and Storage Automation Solutions Market is witnessing strong growth, primarily driven by the increasing demand for enhanced operational efficiency, safety, and real-time monitoring across midstream operations. The growing complexity of pipeline networks and storage facilities has accelerated the adoption of automation technologies such as SCADA systems, IoT sensors, AI-based analytics, and distributed control systems (DCS) to optimize energy flow, detect leaks, and minimize downtime. Rising investments in digital oilfield technologies and the modernization of aging infrastructure are further fueling automation adoption.
Gas and Oil Transportation and Storage Automation Solutions Market Latest Trends:
The Global Gas and Oil Transportation and Storage Automation Solutions Market is seeing several cutting-edge trends that are reshaping the landscape: One major trend is the integration of IoT, AI, and digital twin technologies, enabling real-time sensing, predictive maintenance, and simulation of storage and pipeline systems to reduce downtime and optimize throughput. Another is the rise of edge-cloud hybrid architectures and remote operations, which allow operators to manage infrastructure from afar while maintaining high reliability and security—this is especially relevant as terrains become more challenging and workforce access more restricted.
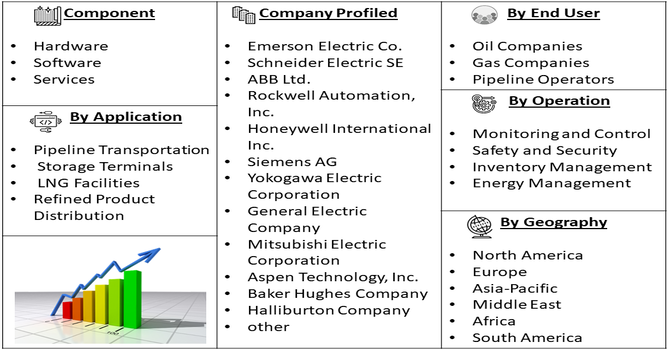
Segmentation: Global Gas and Oil Transportation and Storage Automation Solutions Market is segmented By Component (Hardware, Software, and Services), Application (Pipeline Transportation, Storage Terminals, LNG Facilities, and Refined Product Distribution), Operation (Monitoring and Control, Safety and Security, Inventory Management, and Energy Management), End User (Oil Companies, Gas Companies, and Pipeline Operators), and Geography (North America, Europe, Asia-Pacific, Middle East and Africa, and South America). The report provides the value (in USD million) for the above segments.
For Detailed Market Segmentation - Get a Free Sample PDF
Market Drivers:
- Rising Demand for Operational Efficiency and Real-Time Monitoring
A major driver for the Global Gas and Oil Transportation and Storage Automation Solutions Market is the increasing need for efficient, safe, and real-time monitoring of complex midstream infrastructure. As oil and gas companies manage extensive networks of pipelines, terminals, and storage facilities, automation technologies such as Supervisory Control and Data Acquisition (SCADA) systems, Distributed Control Systems (DCS), and IoT-enabled sensors are being deployed to optimize flow control, detect anomalies, and minimize downtime. For instance, in February 2025, ONGC partnered with bp, appointing it as Technical Services Provider for the Mumbai High offshore oil field while retaining operational control. bp received fixed fees for two years, followed by performance-linked payments, and collaborated to stabilize production and restore growth. This partnership highlighted the rising demand for operational efficiency and real-time monitoring, driving adoption of automation solutions and advanced technologies, thereby positively impacting the global gas and oil transportation and storage automation solutions market.
The growing importance of data-driven decision-making in minimizing energy losses and operational costs further accelerates adoption, especially as companies strive to improve throughput and maintain consistent supply amid fluctuating demand.
- Stringent Safety, Environmental, and Regulatory Compliance Requirements
Another key growth driver is the enforcement of strict safety and environmental regulations governing oil and gas transportation and storage activities. Governments and regulatory bodies worldwide are mandating advanced monitoring, leak detection, and emission control systems to prevent accidents, spills, and environmental damage. Automation solutions enable operators to maintain compliance with frameworks such as the Environmental Protection Agency (EPA) standards and Occupational Safety and Health Administration (OSHA) guidelines by providing continuous monitoring and instant alerts in case of safety breaches.
Market Restraints
- High Initial Investment and Maintenance Costs
The primary restraints in the Global Gas and Oil Transportation and Storage Automation Solutions Market is the high initial investment and maintenance costs associated with automation infrastructure. Implementing advanced technologies such as SCADA systems, IoT sensors, cloud-based monitoring platforms, and AI-driven analytics requires substantial capital expenditure, which can be a major barrier for small and medium-sized operators. Additionally, upgrading legacy systems to modern digital architectures involves integration challenges, system downtime, and retraining of personnel, further escalating operational costs and slowing adoption rates.
Socio-Economic Impact on Gas and Oil Transportation and Storage Automation Solutions Market
The global gas and oil transportation and storage automation solutions market significantly influenced socioeconomic conditions by improving the efficiency, safety, and reliability of energy supply chains. Automation reduced labor-intensive processes, minimized accidents, and lowered operational costs, helping companies stabilize prices and maintain consistent energy availability for industries and consumers. The market created high-skilled jobs in engineering, data analytics, and automation technologies while encouraging investment in digital infrastructure. It also supported environmental goals by reducing leaks and emissions through advanced monitoring systems. Overall, automation strengthened energy security, boosted economic productivity, and modernized critical infrastructure worldwide.
Segmental Analysis:
- Software segment is expected to witness the highest growth over the forecast period
The software segment is expected to dominate the market during the forecast period, driven by the increasing adoption of advanced analytics, digital twins, and AI-based control systems in oil and gas infrastructure. Automation software enables real-time monitoring, predictive maintenance, and process optimization across transportation and storage operations. With growing emphasis on minimizing downtime and ensuring safety, software platforms are being integrated with cloud-based solutions to support remote decision-making and enhance overall operational efficiency.
- Pipeline Transportation segment is expected to witness the highest growth over the forecast period
The pipeline transportation segment holds a significant market share owing to the critical need for efficient and secure transfer of oil and gas products over long distances. Automation technologies, such as SCADA systems, sensors, and leak detection software, are increasingly used to monitor pressure, flow, and integrity of pipelines. The rising number of pipeline projects in North America and the Asia-Pacific, coupled with stringent safety regulations, continues to propel the demand for automation in this segment.
- Monitoring and Control segment is expected to witness the highest growth over the forecast period
The monitoring and control segment represents a major application area, as operators seek to ensure real-time visibility and control over complex transportation and storage networks. Automation systems equipped with IoT sensors and AI analytics provide instant alerts for anomalies, optimizing energy flow and preventing failures. These systems also support predictive maintenance, reducing unplanned shutdowns and ensuring operational continuity.
- Oil Companies segment is expected to witness the highest growth over the forecast period
The oil companies segment dominates the market due to their extensive use of automation technologies to enhance production efficiency and ensure safe handling of crude oil. As global energy demands rise and environmental regulations tighten, oil companies are investing heavily in automation to monitor assets, optimize resource utilization, and improve sustainability. The deployment of digital platforms across upstream and midstream operations further strengthens automation adoption in this segment.
- Asia-Pacific segment is expected to witness the highest growth over the forecast period
The Asia-Pacific region is anticipated to be the fastest-growing segment in the gas and oil automation market over the forecast period. This accelerated growth is primarily driven by massive infrastructure expansion and increasing energy demand from rapidly industrializing nations like China and India. For insyance, in May 2025, Louis Dreyfus Company inaugurated a new glycerin refining plant and edible oil packaging line in Lampung, Indonesia, expanding its regional operations. With a 55,000-metric-ton annual capacity, the facility strengthened LDC’s position in supplying high-purity glycerin to pharmaceutical, personal care, and cosmetics industries. This expansion underscored the rising demand for operational efficiency and real-time monitoring, indirectly driving adoption of advanced automation solutions in the Asia-Pacific gas and oil transportation and storage market.
Extensive investments are being made in new pipeline construction, refinery modernization, and LNG terminal build-outs to enhance energy security and distribution efficiency. For instance, July 2025, During the 9th OPEC International Seminar in Vienna, India’s Minister of Petroleum and Natural Gas, Shri Hardeep Singh Puri, held bilateral meetings with Kuwait’s Minister of Oil to strengthen energy partnerships. Kuwait, a key supplier of crude oil and LPG to India, emphasized the strategic importance of energy trade. These developments highlighted the rising demand for operational efficiency and real-time monitoring, boosting adoption of advanced automation solutions in the Asia-Pacific gas and oil transportation and storage market. The push for digitalization and the adoption of smart monitoring systems for aging networks, alongside mandatory safety upgrades, are collectively fueling the high demand for advanced automation solutions across the continent.
| Report Matrics |
Details |
| Market Size Value |
USD 62.17 billion |
| Growth Rate |
CAGR of 7.7 % |
| Forecast |
2026-2033 |
| Historical data |
2021-2024 |
| Base Year |
2025 |
| Report Coverage |
Forecasted revenue, company rating, competitive environment, growth drivers, and trends |
| Segment Coverage |
Type, Application, End-User, Geography |
| Regional Scope |
North America, Europe, Asia Pacific, Middle East |
| Customized scope |
Free customization of reports (With 3 months Analysis Support ) |
| To Learn More About This Report |
Request a Free Sample Copy |
Gas and Oil Transportation and Storage Automation Solutions Market Competitive Landscape:
The competitive terrain in the global gas and oil transport and storage automation solutions market is robust and technology-intensive, with major players offering integrated hardware, software, and service ecosystems. The landscape is characterised by providers delivering SCADA/DCS platforms, sensors and valves for pipelines and terminals, AI-based analytics and cloud control systems, and managed services for remote monitoring and safety/compliance. Key differentiators include global reach, domain-specific automation capabilities (midstream pipelines, LNG terminals, storage terminals), strong aftermarket services, and partnerships with major oil/gas operators and EPC firms.
Key Player:
- Emerson Electric Co.
- Schneider Electric SE
- ABB Ltd.
- Rockwell Automation, Inc.
- Honeywell International Inc.
- Siemens AG
- Yokogawa Electric Corporation
- General Electric Company
- Mitsubishi Electric Corporation
- Aspen Technology, Inc.
- Baker Hughes Company
- Halliburton Company
- Schlumberger Limited
- TechnipFMC plc
- Weatherford International plc
- Endress+Hauser Group Services AG
- Kongsberg Gruppen ASA
- OSI (Open Systems International, Inc.)
- Actemium (VINCI Energies)
- L&T Electrical & Automation (Larsen & Toubro)
Recent Development
- In September 2025, The Panama Canal Authority launched the concessionaire selection process for its new energy pipeline project, hosting an initial market engagement event in Panama City with over 45 representatives from global energy companies. This initiative strengthened international interest in modernized energy transport infrastructure and encouraged adoption of advanced monitoring and automation technologies. As a result, it positively influenced the global gas and oil transportation and storage automation solutions market by driving investment in efficient, secure, and technologically enhanced pipeline operations.
- In August 2025, WhiteWater announced that its Matterhorn joint venture with MPLX, ONEOK, and Enbridge finalized the investment decision to construct the Eiger Express Pipeline after securing firm transportation agreements with primarily investment-grade shippers. This development advanced large-scale energy infrastructure and emphasized the need for automation and monitoring technologies in gas and oil transport. Consequently, it boosted the global gas and oil transportation and storage automation solutions market by driving demand for efficient, secure, and technologically integrated pipeline operations.
Frequently Asked Questions (FAQ) :
Q1. What are the main growth-driving factors for this market?
The primary drivers are the urgent need for enhanced safety and operational efficiency across pipelines and storage facilities. Stringent government regulations demand better leak detection and lower emissions, which automation solutions like SCADA and IoT sensors can deliver. Additionally, the integration of advanced technologies like Artificial Intelligence (AI) and Machine Learning (ML) fuels modernization efforts.
Q2. What are the main restraining factors for this market?
High initial investment costs for implementing complex automation systems and upgrading existing legacy infrastructure pose a significant challenge. Furthermore, the increasing risk of cybersecurity threats to interconnected operational technology (OT) networks is a major concern. These factors can slow down the adoption rate, especially for smaller market operators.
Q3. Which segment is expected to witness high growth?
The Transportation Automation segment is projected to experience strong growth, driven by the continuous expansion of oil and gas pipeline networks worldwide. Solutions like pipeline monitoring and control systems are essential for safety and capacity optimization. By technology, solutions leveraging AI and predictive maintenance software are highly favored for real-time asset management.
Q4. Who are the top major players for this market?
The market is dominated by global industrial technology leaders who offer comprehensive automation platforms. Top major players include ABB, Siemens AG, Rockwell Automation, and Honeywell International Inc. These companies provide key solutions like Distributed Control Systems (DCS), Supervisory Control and Data Acquisition (SCADA), and various sensor-based field instruments.
Q5. Which country is the largest player?
The Asia-Pacific region is expected to witness the highest growth in the gas and oil automation market. This is driven by massive infrastructure expansion and soaring energy demand in industrializing nations like China and India. Major investments in new pipelines, refinery modernization, and the need for digitalization are fueling the high adoption of advanced automation solutions.
List of Figures
Figure 1: Global Gas and Oil Transportation and Storage Automation Solutions Market Revenue Breakdown (USD Billion, %) by Region, 2022 & 2029
Figure 2: Global Gas and Oil Transportation and Storage Automation Solutions Market Value Share (%), By Segment 1, 2022 & 2029
Figure 3: Global Gas and Oil Transportation and Storage Automation Solutions Market Forecast (USD Billion), by Sub-Segment 1, 2018-2029
Figure 4: Global Gas and Oil Transportation and Storage Automation Solutions Market Forecast (USD Billion), by Sub-Segment 2, 2018-2029
Figure 5: Global Gas and Oil Transportation and Storage Automation Solutions Market Value Share (%), By Segment 2, 2022 & 2029
Figure 6: Global Gas and Oil Transportation and Storage Automation Solutions Market Forecast (USD Billion), by Sub-Segment 1, 2018-2029
Figure 7: Global Gas and Oil Transportation and Storage Automation Solutions Market Forecast (USD Billion), by Sub-Segment 2, 2018-2029
Figure 8: Global Gas and Oil Transportation and Storage Automation Solutions Market Forecast (USD Billion), by Sub-Segment 3, 2018-2029
Figure 9: Global Gas and Oil Transportation and Storage Automation Solutions Market Forecast (USD Billion), by Others, 2018-2029
Figure 10: Global Gas and Oil Transportation and Storage Automation Solutions Market Value Share (%), By Segment 3, 2022 & 2029
Figure 11: Global Gas and Oil Transportation and Storage Automation Solutions Market Forecast (USD Billion), by Sub-Segment 1, 2018-2029
Figure 12: Global Gas and Oil Transportation and Storage Automation Solutions Market Forecast (USD Billion), by Sub-Segment 2, 2018-2029
Figure 13: Global Gas and Oil Transportation and Storage Automation Solutions Market Forecast (USD Billion), by Sub-Segment 3, 2018-2029
Figure 14: Global Gas and Oil Transportation and Storage Automation Solutions Market Forecast (USD Billion), by Others, 2018-2029
Figure 15: Global Gas and Oil Transportation and Storage Automation Solutions Market Value (USD Billion), by Region, 2022 & 2029
Figure 16: North America Gas and Oil Transportation and Storage Automation Solutions Market Value Share (%), By Segment 1, 2022 & 2029
Figure 17: North America Gas and Oil Transportation and Storage Automation Solutions Market Forecast (USD Billion), by Sub-Segment 1, 2018-2029
Figure 18: North America Gas and Oil Transportation and Storage Automation Solutions Market Forecast (USD Billion), by Sub-Segment 2, 2018-2029
Figure 19: North America Gas and Oil Transportation and Storage Automation Solutions Market Value Share (%), By Segment 2, 2022 & 2029
Figure 20: North America Gas and Oil Transportation and Storage Automation Solutions Market Forecast (USD Billion), by Sub-Segment 1, 2018-2029
Figure 21: North America Gas and Oil Transportation and Storage Automation Solutions Market Forecast (USD Billion), by Sub-Segment 2, 2018-2029
Figure 22: North America Gas and Oil Transportation and Storage Automation Solutions Market Forecast (USD Billion), by Sub-Segment 3, 2018-2029
Figure 23: North America Gas and Oil Transportation and Storage Automation Solutions Market Forecast (USD Billion), by Others, 2018-2029
Figure 24: North America Gas and Oil Transportation and Storage Automation Solutions Market Value Share (%), By Segment 3, 2022 & 2029
Figure 25: North America Gas and Oil Transportation and Storage Automation Solutions Market Forecast (USD Billion), by Sub-Segment 1, 2018-2029
Figure 26: North America Gas and Oil Transportation and Storage Automation Solutions Market Forecast (USD Billion), by Sub-Segment 2, 2018-2029
Figure 27: North America Gas and Oil Transportation and Storage Automation Solutions Market Forecast (USD Billion), by Sub-Segment 3, 2018-2029
Figure 28: North America Gas and Oil Transportation and Storage Automation Solutions Market Forecast (USD Billion), by Others, 2018-2029
Figure 29: North America Gas and Oil Transportation and Storage Automation Solutions Market Forecast (USD Billion), by U.S., 2018-2029
Figure 30: North America Gas and Oil Transportation and Storage Automation Solutions Market Forecast (USD Billion), by Canada, 2018-2029
Figure 31: Latin America Gas and Oil Transportation and Storage Automation Solutions Market Value Share (%), By Segment 1, 2022 & 2029
Figure 32: Latin America Gas and Oil Transportation and Storage Automation Solutions Market Forecast (USD Billion), by Sub-Segment 1, 2018-2029
Figure 33: Latin America Gas and Oil Transportation and Storage Automation Solutions Market Forecast (USD Billion), by Sub-Segment 2, 2018-2029
Figure 34: Latin America Gas and Oil Transportation and Storage Automation Solutions Market Value Share (%), By Segment 2, 2022 & 2029
Figure 35: Latin America Gas and Oil Transportation and Storage Automation Solutions Market Forecast (USD Billion), by Sub-Segment 1, 2018-2029
Figure 36: Latin America Gas and Oil Transportation and Storage Automation Solutions Market Forecast (USD Billion), by Sub-Segment 2, 2018-2029
Figure 37: Latin America Gas and Oil Transportation and Storage Automation Solutions Market Forecast (USD Billion), by Sub-Segment 3, 2018-2029
Figure 38: Latin America Gas and Oil Transportation and Storage Automation Solutions Market Forecast (USD Billion), by Others, 2018-2029
Figure 39: Latin America Gas and Oil Transportation and Storage Automation Solutions Market Value Share (%), By Segment 3, 2022 & 2029
Figure 40: Latin America Gas and Oil Transportation and Storage Automation Solutions Market Forecast (USD Billion), by Sub-Segment 1, 2018-2029
Figure 41: Latin America Gas and Oil Transportation and Storage Automation Solutions Market Forecast (USD Billion), by Sub-Segment 2, 2018-2029
Figure 42: Latin America Gas and Oil Transportation and Storage Automation Solutions Market Forecast (USD Billion), by Sub-Segment 3, 2018-2029
Figure 43: Latin America Gas and Oil Transportation and Storage Automation Solutions Market Forecast (USD Billion), by Others, 2018-2029
Figure 44: Latin America Gas and Oil Transportation and Storage Automation Solutions Market Forecast (USD Billion), by Brazil, 2018-2029
Figure 45: Latin America Gas and Oil Transportation and Storage Automation Solutions Market Forecast (USD Billion), by Mexico, 2018-2029
Figure 46: Latin America Gas and Oil Transportation and Storage Automation Solutions Market Forecast (USD Billion), by Rest of Latin America, 2018-2029
Figure 47: Europe Gas and Oil Transportation and Storage Automation Solutions Market Value Share (%), By Segment 1, 2022 & 2029
Figure 48: Europe Gas and Oil Transportation and Storage Automation Solutions Market Forecast (USD Billion), by Sub-Segment 1, 2018-2029
Figure 49: Europe Gas and Oil Transportation and Storage Automation Solutions Market Forecast (USD Billion), by Sub-Segment 2, 2018-2029
Figure 50: Europe Gas and Oil Transportation and Storage Automation Solutions Market Value Share (%), By Segment 2, 2022 & 2029
Figure 51: Europe Gas and Oil Transportation and Storage Automation Solutions Market Forecast (USD Billion), by Sub-Segment 1, 2018-2029
Figure 52: Europe Gas and Oil Transportation and Storage Automation Solutions Market Forecast (USD Billion), by Sub-Segment 2, 2018-2029
Figure 53: Europe Gas and Oil Transportation and Storage Automation Solutions Market Forecast (USD Billion), by Sub-Segment 3, 2018-2029
Figure 54: Europe Gas and Oil Transportation and Storage Automation Solutions Market Forecast (USD Billion), by Others, 2018-2029
Figure 55: Europe Gas and Oil Transportation and Storage Automation Solutions Market Value Share (%), By Segment 3, 2022 & 2029
Figure 56: Europe Gas and Oil Transportation and Storage Automation Solutions Market Forecast (USD Billion), by Sub-Segment 1, 2018-2029
Figure 57: Europe Gas and Oil Transportation and Storage Automation Solutions Market Forecast (USD Billion), by Sub-Segment 2, 2018-2029
Figure 58: Europe Gas and Oil Transportation and Storage Automation Solutions Market Forecast (USD Billion), by Sub-Segment 3, 2018-2029
Figure 59: Europe Gas and Oil Transportation and Storage Automation Solutions Market Forecast (USD Billion), by Others, 2018-2029
Figure 60: Europe Gas and Oil Transportation and Storage Automation Solutions Market Forecast (USD Billion), by U.K., 2018-2029
Figure 61: Europe Gas and Oil Transportation and Storage Automation Solutions Market Forecast (USD Billion), by Germany, 2018-2029
Figure 62: Europe Gas and Oil Transportation and Storage Automation Solutions Market Forecast (USD Billion), by France, 2018-2029
Figure 63: Europe Gas and Oil Transportation and Storage Automation Solutions Market Forecast (USD Billion), by Italy, 2018-2029
Figure 64: Europe Gas and Oil Transportation and Storage Automation Solutions Market Forecast (USD Billion), by Spain, 2018-2029
Figure 65: Europe Gas and Oil Transportation and Storage Automation Solutions Market Forecast (USD Billion), by Russia, 2018-2029
Figure 66: Europe Gas and Oil Transportation and Storage Automation Solutions Market Forecast (USD Billion), by Rest of Europe, 2018-2029
Figure 67: Asia Pacific Gas and Oil Transportation and Storage Automation Solutions Market Value Share (%), By Segment 1, 2022 & 2029
Figure 68: Asia Pacific Gas and Oil Transportation and Storage Automation Solutions Market Forecast (USD Billion), by Sub-Segment 1, 2018-2029
Figure 69: Asia Pacific Gas and Oil Transportation and Storage Automation Solutions Market Forecast (USD Billion), by Sub-Segment 2, 2018-2029
Figure 70: Asia Pacific Gas and Oil Transportation and Storage Automation Solutions Market Value Share (%), By Segment 2, 2022 & 2029
Figure 71: Asia Pacific Gas and Oil Transportation and Storage Automation Solutions Market Forecast (USD Billion), by Sub-Segment 1, 2018-2029
Figure 72: Asia Pacific Gas and Oil Transportation and Storage Automation Solutions Market Forecast (USD Billion), by Sub-Segment 2, 2018-2029
Figure 73: Asia Pacific Gas and Oil Transportation and Storage Automation Solutions Market Forecast (USD Billion), by Sub-Segment 3, 2018-2029
Figure 74: Asia Pacific Gas and Oil Transportation and Storage Automation Solutions Market Forecast (USD Billion), by Others, 2018-2029
Figure 75: Asia Pacific Gas and Oil Transportation and Storage Automation Solutions Market Value Share (%), By Segment 3, 2022 & 2029
Figure 76: Asia Pacific Gas and Oil Transportation and Storage Automation Solutions Market Forecast (USD Billion), by Sub-Segment 1, 2018-2029
Figure 77: Asia Pacific Gas and Oil Transportation and Storage Automation Solutions Market Forecast (USD Billion), by Sub-Segment 2, 2018-2029
Figure 78: Asia Pacific Gas and Oil Transportation and Storage Automation Solutions Market Forecast (USD Billion), by Sub-Segment 3, 2018-2029
Figure 79: Asia Pacific Gas and Oil Transportation and Storage Automation Solutions Market Forecast (USD Billion), by Others, 2018-2029
Figure 80: Asia Pacific Gas and Oil Transportation and Storage Automation Solutions Market Forecast (USD Billion), by China, 2018-2029
Figure 81: Asia Pacific Gas and Oil Transportation and Storage Automation Solutions Market Forecast (USD Billion), by India, 2018-2029
Figure 82: Asia Pacific Gas and Oil Transportation and Storage Automation Solutions Market Forecast (USD Billion), by Japan, 2018-2029
Figure 83: Asia Pacific Gas and Oil Transportation and Storage Automation Solutions Market Forecast (USD Billion), by Australia, 2018-2029
Figure 84: Asia Pacific Gas and Oil Transportation and Storage Automation Solutions Market Forecast (USD Billion), by Southeast Asia, 2018-2029
Figure 85: Asia Pacific Gas and Oil Transportation and Storage Automation Solutions Market Forecast (USD Billion), by Rest of Asia Pacific, 2018-2029
Figure 86: Middle East & Africa Gas and Oil Transportation and Storage Automation Solutions Market Value Share (%), By Segment 1, 2022 & 2029
Figure 87: Middle East & Africa Gas and Oil Transportation and Storage Automation Solutions Market Forecast (USD Billion), by Sub-Segment 1, 2018-2029
Figure 88: Middle East & Africa Gas and Oil Transportation and Storage Automation Solutions Market Forecast (USD Billion), by Sub-Segment 2, 2018-2029
Figure 89: Middle East & Africa Gas and Oil Transportation and Storage Automation Solutions Market Value Share (%), By Segment 2, 2022 & 2029
Figure 90: Middle East & Africa Gas and Oil Transportation and Storage Automation Solutions Market Forecast (USD Billion), by Sub-Segment 1, 2018-2029
Figure 91: Middle East & Africa Gas and Oil Transportation and Storage Automation Solutions Market Forecast (USD Billion), by Sub-Segment 2, 2018-2029
Figure 92: Middle East & Africa Gas and Oil Transportation and Storage Automation Solutions Market Forecast (USD Billion), by Sub-Segment 3, 2018-2029
Figure 93: Middle East & Africa Gas and Oil Transportation and Storage Automation Solutions Market Forecast (USD Billion), by Others, 2018-2029
Figure 94: Middle East & Africa Gas and Oil Transportation and Storage Automation Solutions Market Value Share (%), By Segment 3, 2022 & 2029
Figure 95: Middle East & Africa Gas and Oil Transportation and Storage Automation Solutions Market Forecast (USD Billion), by Sub-Segment 1, 2018-2029
Figure 96: Middle East & Africa Gas and Oil Transportation and Storage Automation Solutions Market Forecast (USD Billion), by Sub-Segment 2, 2018-2029
Figure 97: Middle East & Africa Gas and Oil Transportation and Storage Automation Solutions Market Forecast (USD Billion), by Sub-Segment 3, 2018-2029
Figure 98: Middle East & Africa Gas and Oil Transportation and Storage Automation Solutions Market Forecast (USD Billion), by Others, 2018-2029
Figure 99: Middle East & Africa Gas and Oil Transportation and Storage Automation Solutions Market Forecast (USD Billion), by GCC, 2018-2029
Figure 100: Middle East & Africa Gas and Oil Transportation and Storage Automation Solutions Market Forecast (USD Billion), by South Africa, 2018-2029
Figure 101: Middle East & Africa Gas and Oil Transportation and Storage Automation Solutions Market Forecast (USD Billion), by Rest of Middle East & Africa, 2018-2029
List of Tables
Table 1: Global Gas and Oil Transportation and Storage Automation Solutions Market Revenue (USD Billion) Forecast, by Segment 1, 2018-2029
Table 2: Global Gas and Oil Transportation and Storage Automation Solutions Market Revenue (USD Billion) Forecast, by Segment 2, 2018-2029
Table 3: Global Gas and Oil Transportation and Storage Automation Solutions Market Revenue (USD Billion) Forecast, by Segment 3, 2018-2029
Table 4: Global Gas and Oil Transportation and Storage Automation Solutions Market Revenue (USD Billion) Forecast, by Region, 2018-2029
Table 5: North America Gas and Oil Transportation and Storage Automation Solutions Market Revenue (USD Billion) Forecast, by Segment 1, 2018-2029
Table 6: North America Gas and Oil Transportation and Storage Automation Solutions Market Revenue (USD Billion) Forecast, by Segment 2, 2018-2029
Table 7: North America Gas and Oil Transportation and Storage Automation Solutions Market Revenue (USD Billion) Forecast, by Segment 3, 2018-2029
Table 8: North America Gas and Oil Transportation and Storage Automation Solutions Market Revenue (USD Billion) Forecast, by Country, 2018-2029
Table 9: Europe Gas and Oil Transportation and Storage Automation Solutions Market Revenue (USD Billion) Forecast, by Segment 1, 2018-2029
Table 10: Europe Gas and Oil Transportation and Storage Automation Solutions Market Revenue (USD Billion) Forecast, by Segment 2, 2018-2029
Table 11: Europe Gas and Oil Transportation and Storage Automation Solutions Market Revenue (USD Billion) Forecast, by Segment 3, 2018-2029
Table 12: Europe Gas and Oil Transportation and Storage Automation Solutions Market Revenue (USD Billion) Forecast, by Country, 2018-2029
Table 13: Latin America Gas and Oil Transportation and Storage Automation Solutions Market Revenue (USD Billion) Forecast, by Segment 1, 2018-2029
Table 14: Latin America Gas and Oil Transportation and Storage Automation Solutions Market Revenue (USD Billion) Forecast, by Segment 2, 2018-2029
Table 15: Latin America Gas and Oil Transportation and Storage Automation Solutions Market Revenue (USD Billion) Forecast, by Segment 3, 2018-2029
Table 16: Latin America Gas and Oil Transportation and Storage Automation Solutions Market Revenue (USD Billion) Forecast, by Country, 2018-2029
Table 17: Asia Pacific Gas and Oil Transportation and Storage Automation Solutions Market Revenue (USD Billion) Forecast, by Segment 1, 2018-2029
Table 18: Asia Pacific Gas and Oil Transportation and Storage Automation Solutions Market Revenue (USD Billion) Forecast, by Segment 2, 2018-2029
Table 19: Asia Pacific Gas and Oil Transportation and Storage Automation Solutions Market Revenue (USD Billion) Forecast, by Segment 3, 2018-2029
Table 20: Asia Pacific Gas and Oil Transportation and Storage Automation Solutions Market Revenue (USD Billion) Forecast, by Country, 2018-2029
Table 21: Middle East & Africa Gas and Oil Transportation and Storage Automation Solutions Market Revenue (USD Billion) Forecast, by Segment 1, 2018-2029
Table 22: Middle East & Africa Gas and Oil Transportation and Storage Automation Solutions Market Revenue (USD Billion) Forecast, by Segment 2, 2018-2029
Table 23: Middle East & Africa Gas and Oil Transportation and Storage Automation Solutions Market Revenue (USD Billion) Forecast, by Segment 3, 2018-2029
Table 24: Middle East & Africa Gas and Oil Transportation and Storage Automation Solutions Market Revenue (USD Billion) Forecast, by Country, 2018-2029
Research Process
Data Library Research are conducted by industry experts who offer insight on
industry structure, market segmentations technology assessment and competitive landscape (CL), and penetration, as well as on emerging trends. Their analysis is based on primary interviews (~ 80%) and secondary research (~ 20%) as well as years of professional expertise in their respective industries. Adding to this, by analysing historical trends and current market positions, our analysts predict where the market will be headed for the next five years. Furthermore, the varying trends of segment & categories geographically presented are also studied and the estimated based on the primary & secondary research.
In this particular report from the supply side Data Library Research has conducted primary surveys (interviews) with the key level executives (VP, CEO’s, Marketing Director, Business Development Manager
and SOFT) of the companies that active & prominent as well as the midsized organization
FIGURE 1: DLR RESEARH PROCESS
![research-methodology1]()
Primary Research
Extensive primary research was conducted to gain a deeper insight of the market and industry performance. The analysis is based on both primary and secondary research as well as years of professional expertise in the respective industries.
In addition to analysing current and historical trends, our analysts predict where the market is headed over the next five years.
It varies by segment for these categories geographically presented in the list of market tables. Speaking about this particular report we have conducted primary surveys (interviews) with the key level executives (VP, CEO’s, Marketing Director, Business Development Manager and many more) of the major players active in the market.
Secondary Research
Secondary research was mainly used to collect and identify information useful for the extensive, technical, market-oriented, and Friend’s study of the Global Extra Neutral Alcohol. It was also used to obtain key information about major players, market classification and segmentation according to the industry trends, geographical markets, and developments related to the market and technology perspectives. For this study, analysts have gathered information from various credible sources, such as annual reports, sec filings, journals, white papers, SOFT presentations, and company web sites.
Market Size Estimation
Both, top-down and bottom-up approaches were used to estimate and validate the size of the Global market and to estimate the size of various other dependent submarkets in the overall Extra Neutral Alcohol. The key players in the market were identified through secondary research and their market contributions in the respective geographies were determined through primary and secondary research.
Forecast Model
![research-methodology2]()