Genetically Engineered Vaccines for Livestock Market Overview and Analysis:
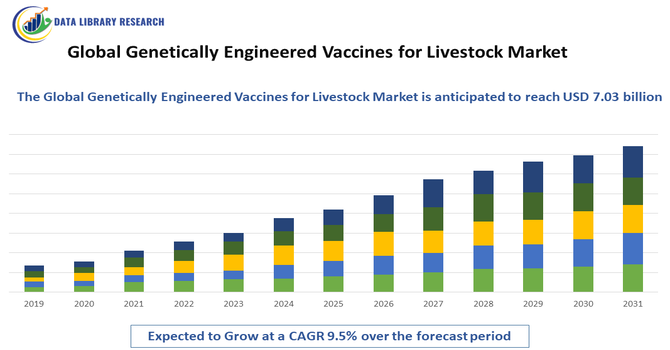
The Global Genetically Engineered Vaccines for Livestock Market size is projected to grow from USD 7.03 billion in 2025 to USD 10.80 billion by 2032, at a CAGR of 9.5% during the forecast period 2025-2032.
Get Complete Analysis Of The Report - Download Updated Free Sample PDF
The growth of the Global Genetically Engineered Vaccines for Livestock Market is primarily driven by the rising demand for effective disease prevention and improved animal health management in the livestock sector. Increasing outbreaks of infectious and zoonotic diseases, along with the need to enhance productivity, herd immunity, and food security, are accelerating the adoption of genetically engineered vaccines. These vaccines offer higher specificity, improved safety profiles, and long-lasting immunity compared to conventional vaccines.
Genetically Engineered Vaccines for Livestock Market Latest Trends:
The Global Genetically Engineered Vaccines for Livestock Market is witnessing several important trends reflecting technological advances and shifting industry priorities. There is increasing adoption of recombinant and DNA-based vaccines that offer targeted immune responses and improved safety over traditional vaccine formulations. Integration of bioinformatics and immunogenomics is enabling the design of vaccines that better match circulating pathogen strains, enhancing effectiveness against diseases like foot-and-mouth disease, avian influenza, and porcine reproductive and respiratory syndrome (PRRS). Additionally, nanoparticle and vectored vaccine delivery technologies are gaining traction to improve stability, efficacy, and ease of administration.
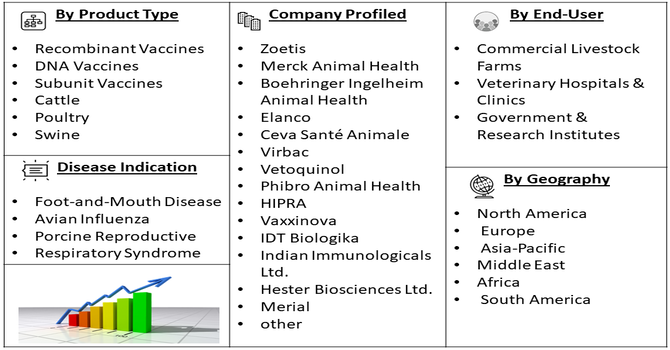
Segmentation: Global Genetically Engineered Vaccines for Livestock Market is segmented By Vaccine Type (Recombinant Vaccines, DNA Vaccines, Subunit Vaccines), Livestock Type (Cattle, Poultry, Swine), Disease Indication (Foot-and-Mouth Disease, Avian Influenza, Porcine Reproductive and Respiratory Syndrome), Route of Administration (Injectable, Oral, Intranasal), End-User (Commercial Livestock Farms, Veterinary Hospitals & Clinics, Government & Research Institutes), and Geography (North America, Europe, Asia-Pacific, Middle East and Africa, and South America). The report provides the value (in USD million) for the above segments.
For Detailed Market Segmentation - Get a Free Sample PDF
Market Drivers:
- Rising Prevalence of Livestock Diseases and Zoonotic Threats
The increasing incidence of infectious and transboundary livestock diseases such as foot-and-mouth disease, avian influenza, and porcine reproductive and respiratory syndrome is a major driver for genetically engineered vaccines. For instance, from 2003 to August 2025, the World Health Organization (WHO) has reported 990 human H5N1 cases across 25 countries, including 475 deaths - a 48% fatality rate.
These diseases lead to significant economic losses due to reduced productivity, mortality, and trade restrictions. Genetically engineered vaccines offer higher specificity, improved safety profiles, and faster immune responses compared to conventional vaccines, making them highly effective in disease prevention and control. Additionally, growing concerns over zoonotic disease transmission to humans are prompting governments and veterinary authorities to strengthen vaccination programs, thereby accelerating demand for advanced vaccine technologies in livestock health management.
- Growing Demand for Sustainable and High-Quality Animal Protein Production
Global growth in meat, milk, and egg consumption is pushing livestock producers to adopt preventive healthcare solutions that ensure herd health and productivity. Genetically engineered vaccines help reduce disease outbreaks, minimize the need for antibiotics, and support sustainable farming practices by improving feed efficiency and animal welfare. With increasing regulatory pressure to limit antibiotic usage in animal husbandry, these vaccines are gaining traction as a proactive alternative. Furthermore, advancements in biotechnology and genetic engineering are enabling the development of vaccines with longer-lasting immunity and multi-disease coverage, encouraging large-scale adoption across commercial livestock farms worldwide.
Market Restraints
- Limited Awareness and Acceptance Among Small-Scale Farmers
Despite their proven advantages, genetically engineered vaccines face resistance from small and traditional livestock farmers due to limited awareness, lack of technical knowledge, and concerns over genetically modified products. In many rural and emerging markets, farmers rely on conventional vaccines or traditional disease management practices because of lower costs and familiarity. Misconceptions about safety, long-term effects, and potential impacts on animal health also hinder adoption. Additionally, inadequate veterinary infrastructure, cold-chain limitations, and uneven access to advanced vaccination programs in remote areas further restrain the widespread use of genetically engineered vaccines in the global livestock sector.
Socioeconomic Impact on Genetically Engineered Vaccines for the Livestock Market
The socioeconomic impact of genetically engineered vaccines for livestock has been significant by improving animal health and productivity, which helps stabilize farmer incomes and reduces losses from disease outbreaks. These advanced vaccines reduce disease related costs, strengthen food security, and enhance rural livelihoods by making livestock rearing more profitable and sustainable. They also support global trade and help lower reliance on antibiotics, benefiting both producers and consumers economically and socially, especially in regions dependent on animal agriculture.
Segmental Analysis:
- Recombinant Vaccines segment is expected to witness the highest growth over the forecast period
Recombinant vaccines represent a key segment in the global genetically engineered vaccines for livestock market due to their high safety profile and targeted immune response. These vaccines are developed using specific antigens, reducing the risk of adverse reactions while improving efficacy. Their ability to differentiate infected from vaccinated animals (DIVA) further supports disease control programs, especially in large-scale livestock management.
- The cattle segment is expected to witness the highest growth over the forecast period
The cattle segment holds a significant share as cattle are highly susceptible to economically impactful diseases. Genetically engineered vaccines are increasingly used to protect dairy and beef cattle from infectious outbreaks, ensuring improved productivity, reduced mortality, and stable milk and meat yields, which are critical for global food security.
- Foot-and-Mouth Disease segment is expected to witness the highest growth over the forecast period
Foot-and-mouth disease is a major disease indication driving vaccine demand due to its highly contagious nature and severe economic consequences. Genetically engineered vaccines offer improved immunity and rapid disease containment, making them essential for outbreak prevention and national livestock health programs.
- Injectable segment is expected to witness highest growth over the forecast period
Injectable vaccines dominate this segment owing to their proven effectiveness, accurate dosage control, and long-lasting immune response. They are widely preferred in veterinary practices and commercial farms for mass immunization programs.
In October 2025, Argentina’s biosafety approach under the Cartagena Protocol defined GMOs as organisms with a novel combination of genetic material, influencing how livestock biotechnology is regulated; gene edited animals without foreign DNA were not treated as GMOs, reducing regulatory barriers and encouraging innovation. This supportive framework helped streamline development and potential market entry of genetically engineered livestock vaccines, boosting growth opportunities in the global genetically engineered vaccines for livestock market.
- Commercial Livestock Farms segment is expected to witness the highest growth over the forecast period
Commercial livestock farms are the primary end-users, driven by the need for routine vaccination to maintain herd health and productivity. Large-scale operations benefit from advanced vaccines that minimize disease risk and economic losses.
By minimizing disease-related losses and improving overall animal welfare, these vaccines support farm profitability and enhance food supply stability. As a result, commercial farms increasingly adopt genetically engineered vaccines to protect investments, improve operational efficiency, and meet regulatory and market demands for healthy, sustainable livestock production.
- North America region is expected to witness the highest growth over the forecast period
North America is expected to witness the highest growth over the forecast period, driven by advanced veterinary healthcare infrastructure, high adoption of genetically engineered vaccines, and strong regulatory support for livestock disease prevention. The region benefits from extensive R&D investments, early adoption of recombinant and DNA-based vaccines, and well-established commercial livestock farming practices. Rising awareness among farmers regarding animal health, productivity, and biosecurity further accelerates market expansion.
In August 2025, USDA’s expanded initiative to combat the New World Screwworm—through a nationwide strategy and new sterile fly production facility—highlighted the vulnerability of livestock to invasive pests, underscoring the need for improved animal health tools. This heightened focus on protecting U.S. herds supported demand for genetically engineered vaccines and advanced biologics in North America’s livestock market to prevent disease and reduce economic losses.
Additionally, increasing incidences of transboundary animal diseases and supportive government vaccination programs in the United States and Canada are contributing to sustained demand and robust growth across the region.
| Report Matrics |
Details |
| Market Size Value |
USD 10.80 billion |
| Growth Rate |
CAGR of 9.5 % |
| Forecast |
2026-2033 |
| Historical data |
2021-2024 |
| Base Year |
2025 |
| Report Coverage |
Forecasted revenue, company rating, competitive environment, growth drivers, and trends |
| Segment Coverage |
Type, Application, End-User, Geography |
| Regional Scope |
North America, Europe, Asia Pacific, Middle East |
| Customized scope |
Free customization of reports (With 3 months' analysis support) |
| To Learn More About This Report |
Request a Free Sample Copy |
Genetically Engineered Vaccines for Livestock Market Competitive Landscape:
The competitive landscape of the Global Genetically Engineered Vaccines for Livestock Market is shaped by a mix of large animal-health multinationals, specialized veterinary biotech firms, and contract developers/CMOs. Players compete on vaccine efficacy, DIVA capabilities, regulatory approvals, manufacturing scale, cold-chain logistics, and strategic partnerships with governments and large commercial farms. Innovation — particularly in recombinant, DNA- and vector-based platforms plus strong R&D pipelines and global distribution networks, are key differentiators. Companies that can demonstrate regulatory compliance, cost-effective production, and rapid scale-up for outbreak response are best positioned to capture market share as demand for advanced livestock vaccines grows.
Key Players:
- Zoetis
- Merck Animal Health
- Boehringer Ingelheim Animal Health
- Elanco
- Ceva Santé Animale
- Virbac
- Vetoquinol
- Phibro Animal Health
- HIPRA
- Vaxxinova
- IDT Biologika
- Indian Immunologicals Ltd.
- Hester Biosciences Ltd.
- Merial
- Norbrook Laboratories
- Biovac
- Kela Laboratories
- Zoocon
- Anivac
- QVax Bio
Recent Development
- In July 2025, Elanco Animal Health’s launch of NUPLURA PH+5, a low endotoxin, genetically engineered vaccine protecting calves from multiple respiratory diseases, expanded advanced livestock immunization options. This innovation highlighted growing industry focus on multi pathogen protection, strengthening demand for sophisticated vaccine solutions and supporting broader growth in the global genetically engineered vaccines for livestock market.
- In July 2025, Animab’s successful EUR 10 million Series B funding underscored strong investor confidence in innovative livestock health solutions. The capital will accelerate development of first in class oral antibody treatments for production animals, highlighting the expanding role of advanced biologics. This milestone supported broader adoption of genetically engineered vaccines and therapeutics, driving growth in the global livestock vaccine market.
Frequently Asked Questions (FAQ) :
Q1. What are the main growth-driving factors for this market?
The primary drivers are the rising global demand for meat and dairy, coupled with the frequent outbreak of zoonotic diseases like Swine Flu and Avian Influenza. Genetically engineered vaccines offer higher safety and efficacy than traditional ones. Additionally, the push to reduce antibiotic use in farming is driving producers toward advanced immunization strategies to maintain healthy herds.
Q2. What are the main restraining factors for this market?
Growth is hindered by high research and development costs and the complex regulatory approval process for "GMO-based" veterinary products. There is also significant public and farmer skepticism regarding the long-term effects of genetically modified vaccines on the food chain. Additionally, maintaining the cold chain for high-tech vaccines in developing regions remains a logistical challenge.
Q3. Which segment is expected to witness high growth?
The recombinant vaccines segment is expected to witness the highest growth over the forecast period because these vaccines offer enhanced safety, stability, and targeted immune responses. Their ability to protect against specific livestock diseases reduces economic losses, improves herd health, and meets rising demand from commercial farms for efficient, modern disease prevention, driving strong market expansion.
Q4. Who are the top major players for this market?
The market is dominated by global animal health leaders with massive R&D budgets. Key players include Zoetis, Boehringer Ingelheim, Merck Animal Health, and Elanco. These companies lead the industry by developing recombinant and DNA-based vaccines that protect poultry, swine, and cattle from increasingly complex viral and bacterial threats.
Q5. Which country is the largest player?
The United States is the largest player in this market. Its dominance stems from a highly industrialized livestock sector, advanced biotechnology research hubs, and a robust regulatory framework (USDA). The U.S. also has high adoption rates for advanced veterinary technologies to ensure the productivity and export quality of its multi-billion dollar meat industry.
List of Figures
Figure 1: Global Genetically Engineered Vaccines for Livestock Market Revenue Breakdown (USD Billion, %) by Region, 2022 & 2029
Figure 2: Global Genetically Engineered Vaccines for Livestock Market Value Share (%), By Segment 1, 2022 & 2029
Figure 3: Global Genetically Engineered Vaccines for Livestock Market Forecast (USD Billion), by Sub-Segment 1, 2018-2029
Figure 4: Global Genetically Engineered Vaccines for Livestock Market Forecast (USD Billion), by Sub-Segment 2, 2018-2029
Figure 5: Global Genetically Engineered Vaccines for Livestock Market Value Share (%), By Segment 2, 2022 & 2029
Figure 6: Global Genetically Engineered Vaccines for Livestock Market Forecast (USD Billion), by Sub-Segment 1, 2018-2029
Figure 7: Global Genetically Engineered Vaccines for Livestock Market Forecast (USD Billion), by Sub-Segment 2, 2018-2029
Figure 8: Global Genetically Engineered Vaccines for Livestock Market Forecast (USD Billion), by Sub-Segment 3, 2018-2029
Figure 9: Global Genetically Engineered Vaccines for Livestock Market Forecast (USD Billion), by Others, 2018-2029
Figure 10: Global Genetically Engineered Vaccines for Livestock Market Value Share (%), By Segment 3, 2022 & 2029
Figure 11: Global Genetically Engineered Vaccines for Livestock Market Forecast (USD Billion), by Sub-Segment 1, 2018-2029
Figure 12: Global Genetically Engineered Vaccines for Livestock Market Forecast (USD Billion), by Sub-Segment 2, 2018-2029
Figure 13: Global Genetically Engineered Vaccines for Livestock Market Forecast (USD Billion), by Sub-Segment 3, 2018-2029
Figure 14: Global Genetically Engineered Vaccines for Livestock Market Forecast (USD Billion), by Others, 2018-2029
Figure 15: Global Genetically Engineered Vaccines for Livestock Market Value (USD Billion), by Region, 2022 & 2029
Figure 16: North America Genetically Engineered Vaccines for Livestock Market Value Share (%), By Segment 1, 2022 & 2029
Figure 17: North America Genetically Engineered Vaccines for Livestock Market Forecast (USD Billion), by Sub-Segment 1, 2018-2029
Figure 18: North America Genetically Engineered Vaccines for Livestock Market Forecast (USD Billion), by Sub-Segment 2, 2018-2029
Figure 19: North America Genetically Engineered Vaccines for Livestock Market Value Share (%), By Segment 2, 2022 & 2029
Figure 20: North America Genetically Engineered Vaccines for Livestock Market Forecast (USD Billion), by Sub-Segment 1, 2018-2029
Figure 21: North America Genetically Engineered Vaccines for Livestock Market Forecast (USD Billion), by Sub-Segment 2, 2018-2029
Figure 22: North America Genetically Engineered Vaccines for Livestock Market Forecast (USD Billion), by Sub-Segment 3, 2018-2029
Figure 23: North America Genetically Engineered Vaccines for Livestock Market Forecast (USD Billion), by Others, 2018-2029
Figure 24: North America Genetically Engineered Vaccines for Livestock Market Value Share (%), By Segment 3, 2022 & 2029
Figure 25: North America Genetically Engineered Vaccines for Livestock Market Forecast (USD Billion), by Sub-Segment 1, 2018-2029
Figure 26: North America Genetically Engineered Vaccines for Livestock Market Forecast (USD Billion), by Sub-Segment 2, 2018-2029
Figure 27: North America Genetically Engineered Vaccines for Livestock Market Forecast (USD Billion), by Sub-Segment 3, 2018-2029
Figure 28: North America Genetically Engineered Vaccines for Livestock Market Forecast (USD Billion), by Others, 2018-2029
Figure 29: North America Genetically Engineered Vaccines for Livestock Market Forecast (USD Billion), by U.S., 2018-2029
Figure 30: North America Genetically Engineered Vaccines for Livestock Market Forecast (USD Billion), by Canada, 2018-2029
Figure 31: Latin America Genetically Engineered Vaccines for Livestock Market Value Share (%), By Segment 1, 2022 & 2029
Figure 32: Latin America Genetically Engineered Vaccines for Livestock Market Forecast (USD Billion), by Sub-Segment 1, 2018-2029
Figure 33: Latin America Genetically Engineered Vaccines for Livestock Market Forecast (USD Billion), by Sub-Segment 2, 2018-2029
Figure 34: Latin America Genetically Engineered Vaccines for Livestock Market Value Share (%), By Segment 2, 2022 & 2029
Figure 35: Latin America Genetically Engineered Vaccines for Livestock Market Forecast (USD Billion), by Sub-Segment 1, 2018-2029
Figure 36: Latin America Genetically Engineered Vaccines for Livestock Market Forecast (USD Billion), by Sub-Segment 2, 2018-2029
Figure 37: Latin America Genetically Engineered Vaccines for Livestock Market Forecast (USD Billion), by Sub-Segment 3, 2018-2029
Figure 38: Latin America Genetically Engineered Vaccines for Livestock Market Forecast (USD Billion), by Others, 2018-2029
Figure 39: Latin America Genetically Engineered Vaccines for Livestock Market Value Share (%), By Segment 3, 2022 & 2029
Figure 40: Latin America Genetically Engineered Vaccines for Livestock Market Forecast (USD Billion), by Sub-Segment 1, 2018-2029
Figure 41: Latin America Genetically Engineered Vaccines for Livestock Market Forecast (USD Billion), by Sub-Segment 2, 2018-2029
Figure 42: Latin America Genetically Engineered Vaccines for Livestock Market Forecast (USD Billion), by Sub-Segment 3, 2018-2029
Figure 43: Latin America Genetically Engineered Vaccines for Livestock Market Forecast (USD Billion), by Others, 2018-2029
Figure 44: Latin America Genetically Engineered Vaccines for Livestock Market Forecast (USD Billion), by Brazil, 2018-2029
Figure 45: Latin America Genetically Engineered Vaccines for Livestock Market Forecast (USD Billion), by Mexico, 2018-2029
Figure 46: Latin America Genetically Engineered Vaccines for Livestock Market Forecast (USD Billion), by Rest of Latin America, 2018-2029
Figure 47: Europe Genetically Engineered Vaccines for Livestock Market Value Share (%), By Segment 1, 2022 & 2029
Figure 48: Europe Genetically Engineered Vaccines for Livestock Market Forecast (USD Billion), by Sub-Segment 1, 2018-2029
Figure 49: Europe Genetically Engineered Vaccines for Livestock Market Forecast (USD Billion), by Sub-Segment 2, 2018-2029
Figure 50: Europe Genetically Engineered Vaccines for Livestock Market Value Share (%), By Segment 2, 2022 & 2029
Figure 51: Europe Genetically Engineered Vaccines for Livestock Market Forecast (USD Billion), by Sub-Segment 1, 2018-2029
Figure 52: Europe Genetically Engineered Vaccines for Livestock Market Forecast (USD Billion), by Sub-Segment 2, 2018-2029
Figure 53: Europe Genetically Engineered Vaccines for Livestock Market Forecast (USD Billion), by Sub-Segment 3, 2018-2029
Figure 54: Europe Genetically Engineered Vaccines for Livestock Market Forecast (USD Billion), by Others, 2018-2029
Figure 55: Europe Genetically Engineered Vaccines for Livestock Market Value Share (%), By Segment 3, 2022 & 2029
Figure 56: Europe Genetically Engineered Vaccines for Livestock Market Forecast (USD Billion), by Sub-Segment 1, 2018-2029
Figure 57: Europe Genetically Engineered Vaccines for Livestock Market Forecast (USD Billion), by Sub-Segment 2, 2018-2029
Figure 58: Europe Genetically Engineered Vaccines for Livestock Market Forecast (USD Billion), by Sub-Segment 3, 2018-2029
Figure 59: Europe Genetically Engineered Vaccines for Livestock Market Forecast (USD Billion), by Others, 2018-2029
Figure 60: Europe Genetically Engineered Vaccines for Livestock Market Forecast (USD Billion), by U.K., 2018-2029
Figure 61: Europe Genetically Engineered Vaccines for Livestock Market Forecast (USD Billion), by Germany, 2018-2029
Figure 62: Europe Genetically Engineered Vaccines for Livestock Market Forecast (USD Billion), by France, 2018-2029
Figure 63: Europe Genetically Engineered Vaccines for Livestock Market Forecast (USD Billion), by Italy, 2018-2029
Figure 64: Europe Genetically Engineered Vaccines for Livestock Market Forecast (USD Billion), by Spain, 2018-2029
Figure 65: Europe Genetically Engineered Vaccines for Livestock Market Forecast (USD Billion), by Russia, 2018-2029
Figure 66: Europe Genetically Engineered Vaccines for Livestock Market Forecast (USD Billion), by Rest of Europe, 2018-2029
Figure 67: Asia Pacific Genetically Engineered Vaccines for Livestock Market Value Share (%), By Segment 1, 2022 & 2029
Figure 68: Asia Pacific Genetically Engineered Vaccines for Livestock Market Forecast (USD Billion), by Sub-Segment 1, 2018-2029
Figure 69: Asia Pacific Genetically Engineered Vaccines for Livestock Market Forecast (USD Billion), by Sub-Segment 2, 2018-2029
Figure 70: Asia Pacific Genetically Engineered Vaccines for Livestock Market Value Share (%), By Segment 2, 2022 & 2029
Figure 71: Asia Pacific Genetically Engineered Vaccines for Livestock Market Forecast (USD Billion), by Sub-Segment 1, 2018-2029
Figure 72: Asia Pacific Genetically Engineered Vaccines for Livestock Market Forecast (USD Billion), by Sub-Segment 2, 2018-2029
Figure 73: Asia Pacific Genetically Engineered Vaccines for Livestock Market Forecast (USD Billion), by Sub-Segment 3, 2018-2029
Figure 74: Asia Pacific Genetically Engineered Vaccines for Livestock Market Forecast (USD Billion), by Others, 2018-2029
Figure 75: Asia Pacific Genetically Engineered Vaccines for Livestock Market Value Share (%), By Segment 3, 2022 & 2029
Figure 76: Asia Pacific Genetically Engineered Vaccines for Livestock Market Forecast (USD Billion), by Sub-Segment 1, 2018-2029
Figure 77: Asia Pacific Genetically Engineered Vaccines for Livestock Market Forecast (USD Billion), by Sub-Segment 2, 2018-2029
Figure 78: Asia Pacific Genetically Engineered Vaccines for Livestock Market Forecast (USD Billion), by Sub-Segment 3, 2018-2029
Figure 79: Asia Pacific Genetically Engineered Vaccines for Livestock Market Forecast (USD Billion), by Others, 2018-2029
Figure 80: Asia Pacific Genetically Engineered Vaccines for Livestock Market Forecast (USD Billion), by China, 2018-2029
Figure 81: Asia Pacific Genetically Engineered Vaccines for Livestock Market Forecast (USD Billion), by India, 2018-2029
Figure 82: Asia Pacific Genetically Engineered Vaccines for Livestock Market Forecast (USD Billion), by Japan, 2018-2029
Figure 83: Asia Pacific Genetically Engineered Vaccines for Livestock Market Forecast (USD Billion), by Australia, 2018-2029
Figure 84: Asia Pacific Genetically Engineered Vaccines for Livestock Market Forecast (USD Billion), by Southeast Asia, 2018-2029
Figure 85: Asia Pacific Genetically Engineered Vaccines for Livestock Market Forecast (USD Billion), by Rest of Asia Pacific, 2018-2029
Figure 86: Middle East & Africa Genetically Engineered Vaccines for Livestock Market Value Share (%), By Segment 1, 2022 & 2029
Figure 87: Middle East & Africa Genetically Engineered Vaccines for Livestock Market Forecast (USD Billion), by Sub-Segment 1, 2018-2029
Figure 88: Middle East & Africa Genetically Engineered Vaccines for Livestock Market Forecast (USD Billion), by Sub-Segment 2, 2018-2029
Figure 89: Middle East & Africa Genetically Engineered Vaccines for Livestock Market Value Share (%), By Segment 2, 2022 & 2029
Figure 90: Middle East & Africa Genetically Engineered Vaccines for Livestock Market Forecast (USD Billion), by Sub-Segment 1, 2018-2029
Figure 91: Middle East & Africa Genetically Engineered Vaccines for Livestock Market Forecast (USD Billion), by Sub-Segment 2, 2018-2029
Figure 92: Middle East & Africa Genetically Engineered Vaccines for Livestock Market Forecast (USD Billion), by Sub-Segment 3, 2018-2029
Figure 93: Middle East & Africa Genetically Engineered Vaccines for Livestock Market Forecast (USD Billion), by Others, 2018-2029
Figure 94: Middle East & Africa Genetically Engineered Vaccines for Livestock Market Value Share (%), By Segment 3, 2022 & 2029
Figure 95: Middle East & Africa Genetically Engineered Vaccines for Livestock Market Forecast (USD Billion), by Sub-Segment 1, 2018-2029
Figure 96: Middle East & Africa Genetically Engineered Vaccines for Livestock Market Forecast (USD Billion), by Sub-Segment 2, 2018-2029
Figure 97: Middle East & Africa Genetically Engineered Vaccines for Livestock Market Forecast (USD Billion), by Sub-Segment 3, 2018-2029
Figure 98: Middle East & Africa Genetically Engineered Vaccines for Livestock Market Forecast (USD Billion), by Others, 2018-2029
Figure 99: Middle East & Africa Genetically Engineered Vaccines for Livestock Market Forecast (USD Billion), by GCC, 2018-2029
Figure 100: Middle East & Africa Genetically Engineered Vaccines for Livestock Market Forecast (USD Billion), by South Africa, 2018-2029
Figure 101: Middle East & Africa Genetically Engineered Vaccines for Livestock Market Forecast (USD Billion), by Rest of Middle East & Africa, 2018-2029
List of Tables
Table 1: Global Genetically Engineered Vaccines for Livestock Market Revenue (USD Billion) Forecast, by Segment 1, 2018-2029
Table 2: Global Genetically Engineered Vaccines for Livestock Market Revenue (USD Billion) Forecast, by Segment 2, 2018-2029
Table 3: Global Genetically Engineered Vaccines for Livestock Market Revenue (USD Billion) Forecast, by Segment 3, 2018-2029
Table 4: Global Genetically Engineered Vaccines for Livestock Market Revenue (USD Billion) Forecast, by Region, 2018-2029
Table 5: North America Genetically Engineered Vaccines for Livestock Market Revenue (USD Billion) Forecast, by Segment 1, 2018-2029
Table 6: North America Genetically Engineered Vaccines for Livestock Market Revenue (USD Billion) Forecast, by Segment 2, 2018-2029
Table 7: North America Genetically Engineered Vaccines for Livestock Market Revenue (USD Billion) Forecast, by Segment 3, 2018-2029
Table 8: North America Genetically Engineered Vaccines for Livestock Market Revenue (USD Billion) Forecast, by Country, 2018-2029
Table 9: Europe Genetically Engineered Vaccines for Livestock Market Revenue (USD Billion) Forecast, by Segment 1, 2018-2029
Table 10: Europe Genetically Engineered Vaccines for Livestock Market Revenue (USD Billion) Forecast, by Segment 2, 2018-2029
Table 11: Europe Genetically Engineered Vaccines for Livestock Market Revenue (USD Billion) Forecast, by Segment 3, 2018-2029
Table 12: Europe Genetically Engineered Vaccines for Livestock Market Revenue (USD Billion) Forecast, by Country, 2018-2029
Table 13: Latin America Genetically Engineered Vaccines for Livestock Market Revenue (USD Billion) Forecast, by Segment 1, 2018-2029
Table 14: Latin America Genetically Engineered Vaccines for Livestock Market Revenue (USD Billion) Forecast, by Segment 2, 2018-2029
Table 15: Latin America Genetically Engineered Vaccines for Livestock Market Revenue (USD Billion) Forecast, by Segment 3, 2018-2029
Table 16: Latin America Genetically Engineered Vaccines for Livestock Market Revenue (USD Billion) Forecast, by Country, 2018-2029
Table 17: Asia Pacific Genetically Engineered Vaccines for Livestock Market Revenue (USD Billion) Forecast, by Segment 1, 2018-2029
Table 18: Asia Pacific Genetically Engineered Vaccines for Livestock Market Revenue (USD Billion) Forecast, by Segment 2, 2018-2029
Table 19: Asia Pacific Genetically Engineered Vaccines for Livestock Market Revenue (USD Billion) Forecast, by Segment 3, 2018-2029
Table 20: Asia Pacific Genetically Engineered Vaccines for Livestock Market Revenue (USD Billion) Forecast, by Country, 2018-2029
Table 21: Middle East & Africa Genetically Engineered Vaccines for Livestock Market Revenue (USD Billion) Forecast, by Segment 1, 2018-2029
Table 22: Middle East & Africa Genetically Engineered Vaccines for Livestock Market Revenue (USD Billion) Forecast, by Segment 2, 2018-2029
Table 23: Middle East & Africa Genetically Engineered Vaccines for Livestock Market Revenue (USD Billion) Forecast, by Segment 3, 2018-2029
Table 24: Middle East & Africa Genetically Engineered Vaccines for Livestock Market Revenue (USD Billion) Forecast, by Country, 2018-2029
Research Process
Data Library Research are conducted by industry experts who offer insight on
industry structure, market segmentations technology assessment and competitive landscape (CL), and penetration, as well as on emerging trends. Their analysis is based on primary interviews (~ 80%) and secondary research (~ 20%) as well as years of professional expertise in their respective industries. Adding to this, by analysing historical trends and current market positions, our analysts predict where the market will be headed for the next five years. Furthermore, the varying trends of segment & categories geographically presented are also studied and the estimated based on the primary & secondary research.
In this particular report from the supply side Data Library Research has conducted primary surveys (interviews) with the key level executives (VP, CEO’s, Marketing Director, Business Development Manager
and SOFT) of the companies that active & prominent as well as the midsized organization
FIGURE 1: DLR RESEARH PROCESS
![research-methodology1]()
Primary Research
Extensive primary research was conducted to gain a deeper insight of the market and industry performance. The analysis is based on both primary and secondary research as well as years of professional expertise in the respective industries.
In addition to analysing current and historical trends, our analysts predict where the market is headed over the next five years.
It varies by segment for these categories geographically presented in the list of market tables. Speaking about this particular report we have conducted primary surveys (interviews) with the key level executives (VP, CEO’s, Marketing Director, Business Development Manager and many more) of the major players active in the market.
Secondary Research
Secondary research was mainly used to collect and identify information useful for the extensive, technical, market-oriented, and Friend’s study of the Global Extra Neutral Alcohol. It was also used to obtain key information about major players, market classification and segmentation according to the industry trends, geographical markets, and developments related to the market and technology perspectives. For this study, analysts have gathered information from various credible sources, such as annual reports, sec filings, journals, white papers, SOFT presentations, and company web sites.
Market Size Estimation
Both, top-down and bottom-up approaches were used to estimate and validate the size of the Global market and to estimate the size of various other dependent submarkets in the overall Extra Neutral Alcohol. The key players in the market were identified through secondary research and their market contributions in the respective geographies were determined through primary and secondary research.
Forecast Model
![research-methodology2]()