Fat-Soluble Vitamins For Injection Market Overview and Analysis
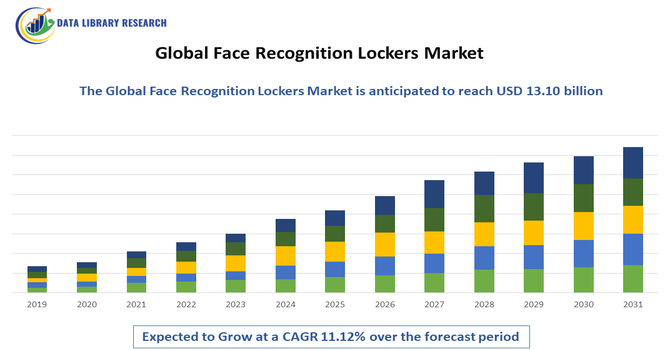
- The Global Fat-Soluble Vitamins for Injection Market is projected to grow from USD 4.2 billion in 2025 to USD 12.5 billion by 2032, with an 9.1% CAGR from 2025-2032.
Get Complete Analysis Of The Report - Download Updated Free Sample PDF
The Global Fat-Soluble Vitamins for Injection Market encompasses the production and distribution of injectable vitamins A, D, E, and K used for treating deficiencies and various medical conditions. These vitamins are critical in managing bone health, immune function, and blood coagulation. Market growth is driven by rising awareness of vitamin deficiencies, increasing demand in hospitals and clinics, and advancements in formulation and delivery technologies. The market serves pharmaceutical companies, healthcare providers, and patients worldwide, influenced by regulatory standards and expanding healthcare infrastructure.
Fat-Soluble Vitamins For Injection Market Latest Trends
The global fat-soluble vitamins for injection market is growing due to increased awareness of vitamin deficiencies and their health implications. Rising demand in hospitals and clinics for rapid and effective vitamin supplementation drives injectable formulations. Innovations in vitamin delivery, including improved stability and bioavailability, are advancing the market. Additionally, an aging population and increasing chronic diseases heighten the need for targeted nutritional therapies. Emerging markets show strong growth potential due to improving healthcare infrastructure and rising healthcare expenditure. Regulatory emphasis on safety and quality further shapes product development and market adoption globally.
Segmentation: The Global Fat-Soluble Vitamins for Injection Market is segmented by Vitamin Type (Vitamin A, Vitamin D, Vitamin E & Vitamin K), Application (Nutritional Deficiency Treatment, Bone Health Disorders, Blood Coagulation Disorders, Immune System Support and Other Therapeutic Applications), End User (Hospitals & Clinics, Diagnostic Centers, Home Healthcare Settings and Pharmacies & Drug Stores), and Geography (North America, Europe, Asia-Pacific, Middle East and Africa, and South America). The report provides the value (in USD million) for the above segments.
For Detailed Market Segmentation - Get a Free Sample PDF
Market Drivers:
- Rising Prevalence of Vitamin Deficiencies
The growing incidence of vitamin A, D, E, and K deficiencies globally has significantly fueled demand for injectable formulations. Malnutrition, chronic diseases, and limited absorption in certain patient populations, such as the elderly or those with gastrointestinal disorders, have heightened the need for rapid and effective supplementation. Injectable vitamins provide targeted, immediate bioavailability, ensuring faster therapeutic outcomes compared to oral administration. For instance, in March 2025, DSM-Firmenich’s partnership with MedAccess ensured stable pricing and sustainable supply of vitamin A and D3 for fortification in LMICs, addressing rising vitamin deficiencies. This initiative highlighted the critical role of fat-soluble vitamins, reinforced global awareness of deficiency prevention, and indirectly strengthened demand for injectable formulations to support rapid supplementation in high-need populations.
- Advancements in Formulation and Delivery Technologies
Technological innovations in injectable vitamin formulations have propelled market growth by improving stability, efficacy, and patient compliance. Enhanced delivery systems, such as emulsions, liposomal carriers, and pre-filled syringes, offer precise dosing, prolonged shelf life, and reduced adverse reactions. Pharmaceutical companies are investing in R&D to develop combination vitamin injections and formulations with improved solubility, expanding therapeutic applications. Such advancements have enabled broader adoption in hospitals, clinics, and home healthcare settings. The availability of user-friendly and safe delivery methods, combined with increasing healthcare expenditure and awareness, has reinforced the market’s upward trajectory globally.
Market Restraints:
- High Cost and Limited Accessibility
High manufacturing and regulatory compliance costs for injectable fat-soluble vitamins pose a major market restraint. The production of sterile, stable, and bioavailable formulations requires advanced facilities, skilled personnel, and rigorous quality control, driving up prices. In low- and middle-income regions, limited healthcare infrastructure and affordability issues restrict access to injectable therapies, reducing market penetration. Additionally, stringent regulatory approvals and documentation requirements increase time-to-market, delaying product availability. These factors collectively hinder the widespread adoption of injectable vitamins, especially in rural or resource-limited areas, restraining market expansion despite growing clinical need and awareness.
Socioeconomic Impact on Fat-Soluble Vitamins For Injection Market
Fat-soluble vitamin injections contribute to improved public health by addressing deficiencies that can cause serious conditions such as rickets, bleeding disorders, and immune dysfunction. They enable rapid, targeted supplementation, especially in malnourished populations or those with absorption issues. This market supports healthcare infrastructure by providing critical therapeutic options, reducing disease burden, and associated healthcare costs. The industry generates employment in pharmaceutical manufacturing, research, and distribution sectors. However, high costs and accessibility challenges in low-income regions highlight the need for equitable healthcare solutions. Thus, the market positively influences health outcomes and economic productivity globally.
Segmental Analysis:
- The vitamin D segment is expected to witness the highest growth over the forecast period
The Vitamin D segment is expected to witness the highest growth over the forecast period due to increasing prevalence of deficiency-related conditions such as rickets, osteoporosis, and immune dysfunction. Rising awareness among healthcare providers and patients about the importance of vitamin D supplementation has accelerated demand. Injectable formulations are preferred for rapid correction of severe deficiencies and in populations with absorption challenges. Growing adoption in hospitals, clinics, and home healthcare settings, along with supportive government health initiatives and fortification programs, has further fueled market expansion, making vitamin D injections a critical growth driver globally.
- Bone Health Disorders segment is expected to witness the highest growth over the forecast period
The Bone Health Disorders segment is projected to experience the highest growth as conditions like osteoporosis, osteomalacia, and fractures become more prevalent, especially among aging populations. Injectable fat-soluble vitamins, particularly vitamin D and K, play a vital role in bone metabolism and calcium absorption, providing effective therapeutic support. Increasing geriatric populations, sedentary lifestyles, and rising incidence of chronic conditions have driven hospital and clinical demand for these targeted therapies. Growing awareness of preventive care, coupled with government initiatives promoting bone health, has further supported adoption, making bone health disorders a major contributor to market growth globally.
- Hospitals & Clinics segment is expected to witness the highest growth over the forecast period
The Hospitals & Clinics segment is expected to witness the highest growth due to their pivotal role in administering injectable vitamins for acute and chronic deficiency management. Hospitals and clinics provide controlled, professional settings for safe and accurate dosing, ensuring higher patient adherence and therapeutic outcomes. Rising patient influx, increasing prevalence of vitamin deficiencies, and growing awareness of injectable therapies’ benefits have boosted demand in these settings. Additionally, healthcare infrastructure expansion and investment in specialized departments for nutrition and chronic disease management have further strengthened the segment, making hospitals and clinics a primary channel driving global market growth.
- Asia-Pacific’s Region is expected to witness the highest growth over the forecast period
The Asia-Pacific region is expected to witness the highest growth in the fat-soluble vitamins for injection market over the forecast period due to a combination of demographic, economic, and healthcare factors. High prevalence of vitamin deficiencies, particularly in children and pregnant women, has increased demand for rapid and effective supplementation through injectable formulations.
In 2024, the Asia-Pacific fat-soluble vitamins for injection market was strengthened by the Kanpur, district’s vitamin A supplementation program, which reached 468,000 children aged nine months to five years. The campaign underscored the high prevalence of deficiencies, highlighted risks like impaired vision and childhood illnesses, and reinforced demand for injectable vitamin A to provide rapid, effective nutritional support across the region.
Expanding healthcare infrastructure, rising government initiatives for public health nutrition, and growing awareness of deficiency-related health risks have further driven adoption. Additionally, increasing investments by pharmaceutical companies in R&D, production, and distribution across emerging markets such as India, China, and Southeast Asia have strengthened market penetration. The region’s large population and improving accessibility to healthcare services support sustained market growth globally.
Fat-Soluble Vitamins For Injection Market Competitive Landscape
The market is moderately competitive with key players including Pfizer, BASF, DSM, Mylan (Viatris), and Abbott Laboratories dominating. Companies focus on product innovation, quality enhancement, and strategic partnerships to strengthen their portfolios. The market sees active R&D investments to improve formulation stability and efficacy. Regional players are gaining traction in emerging markets through localized production and distribution networks. Mergers and acquisitions play a key role in expanding global reach. Regulatory compliance and manufacturing capabilities are critical competitive factors. Companies also invest in marketing and education to raise awareness of injectable vitamin benefits among healthcare providers.
| Report Matrics |
Details |
| Market Size Value |
USD 12.5 billion |
| Growth Rate |
CAGR of 9.1 % |
| Forecast |
2026-2033 |
| Historical data |
2021-2024 |
| Base Year |
2025 |
| Report Coverage |
Forecasted revenue, company rating, competitive environment, growth drivers, and trends |
| Segment Coverage |
Type, Application, End-User, Geography |
| Regional Scope |
North America, Europe, Asia Pacific, Middle East |
| Customized scope |
Free customization of reports (With 3 months' analysis support) |
| To Learn More About This Report |
Request a Free Sample Copy |
The major players for the above market are:
- Pfizer Inc.
- BASF SE
- DSM Nutritional Products
- Abbott Laboratories
- Mylan N.V. (Viatris)
- Sanofi S.A.
- Novartis AG
- GlaxoSmithKline plc (GSK)
- Merck & Co., Inc.
- Takeda Pharmaceutical Company Limited
- Fresenius Kabi AG
- Cipla Limited
- Sun Pharmaceutical Industries Ltd.
- Sandoz (a Novartis division)
- Teva Pharmaceutical Industries Ltd.
- Dr. Reddy’s Laboratories Ltd.
- Wockhardt Ltd.
- Ajanta Pharma Ltd.
- Mankind Pharma
- Intas Pharmaceuticals Ltd.
Recent Development
- In May 2024, The Vitamin A supplementation program at Viengxay District Hospital in Lao PDR demonstrated the critical impact of injectable fat-soluble vitamins. Distribution to children under five rapidly improved vision and reduced deficiency-related health risks, highlighting the effectiveness and necessity of vitamin A injections. This reinforced global demand for high-quality, accessible injectable fat-soluble vitamins.
- In December 2022, The Chennai Corporation’s extensive Vitamin A campaign, reaching 500,000 children across all 15 city zones, highlighted the critical need for injectable fat-soluble vitamins. The initiative demonstrated large-scale public health impact, improved awareness of deficiency prevention, and reinforced global demand for vitamin A injections, emphasizing their role in supporting child health and nutritional supplementation worldwide.
Frequently Asked Questions (FAQ) :
Q1. What are the main growth-driving factors for this market?
The market is growing because more patients require "parenteral nutrition," which is feeding through a vein, due to severe digestive disorders or surgery. Rising cases of chronic illnesses that prevent the body from absorbing vitamins A, D, E, and K naturally are driving demand. Additionally, increasing health awareness and more hospitals offering advanced nutritional support are fueling market expansion.
Q2. What are the main restraining factors for this market?
Growth is limited by the risk of "vitamin toxicity," as fat-soluble vitamins stay in the body longer than water-soluble ones and can be harmful if over-injected. High production costs for sterile injectable formulas and strict government safety regulations also act as barriers. Furthermore, many patients prefer oral supplements if their digestive systems are still functioning.
Q3. Which segment is expected to witness high growth?
The Vitamin D segment is expected to witness the highest growth due to increasing prevalence of deficiencies causing rickets, osteoporosis, and immune-related disorders. Injectable formulations provide rapid, effective supplementation, especially for patients with absorption challenges. Rising awareness, hospital adoption, and supportive healthcare initiatives further fueled global demand for vitamin D injections.
Q4. Who are the top major players for this market?
The market is led by global leaders in clinical nutrition and sterile medical supplies. Key players include Baxter International, Fresenius Kabi, B. Braun Melsungen, Pfizer, and Takeda Pharmaceutical. These companies dominate by providing high-quality, pre-mixed bags and vials that are used daily in intensive care units and long-term care facilities worldwide.
Q5. Which country is the largest player?
India is expected to witness the highest growth in the fat-soluble vitamins for injection market due to widespread vitamin deficiencies, increasing public health initiatives, and expanding healthcare infrastructure. Rising awareness, government supplementation programs, and growing hospital and clinic adoption of injectable vitamins are driving demand, making India a key growth region globally
List of Figures
Figure 1: Global Fat-Soluble Vitamins For Injection Market Revenue Breakdown (USD Billion, %) by Region, 2022 & 2029
Figure 2: Global Fat-Soluble Vitamins For Injection Market Value Share (%), By Segment 1, 2022 & 2029
Figure 3: Global Fat-Soluble Vitamins For Injection Market Forecast (USD Billion), by Sub-Segment 1, 2018-2029
Figure 4: Global Fat-Soluble Vitamins For Injection Market Forecast (USD Billion), by Sub-Segment 2, 2018-2029
Figure 5: Global Fat-Soluble Vitamins For Injection Market Value Share (%), By Segment 2, 2022 & 2029
Figure 6: Global Fat-Soluble Vitamins For Injection Market Forecast (USD Billion), by Sub-Segment 1, 2018-2029
Figure 7: Global Fat-Soluble Vitamins For Injection Market Forecast (USD Billion), by Sub-Segment 2, 2018-2029
Figure 8: Global Fat-Soluble Vitamins For Injection Market Forecast (USD Billion), by Sub-Segment 3, 2018-2029
Figure 9: Global Fat-Soluble Vitamins For Injection Market Forecast (USD Billion), by Others, 2018-2029
Figure 10: Global Fat-Soluble Vitamins For Injection Market Value Share (%), By Segment 3, 2022 & 2029
Figure 11: Global Fat-Soluble Vitamins For Injection Market Forecast (USD Billion), by Sub-Segment 1, 2018-2029
Figure 12: Global Fat-Soluble Vitamins For Injection Market Forecast (USD Billion), by Sub-Segment 2, 2018-2029
Figure 13: Global Fat-Soluble Vitamins For Injection Market Forecast (USD Billion), by Sub-Segment 3, 2018-2029
Figure 14: Global Fat-Soluble Vitamins For Injection Market Forecast (USD Billion), by Others, 2018-2029
Figure 15: Global Fat-Soluble Vitamins For Injection Market Value (USD Billion), by Region, 2022 & 2029
Figure 16: North America Fat-Soluble Vitamins For Injection Market Value Share (%), By Segment 1, 2022 & 2029
Figure 17: North America Fat-Soluble Vitamins For Injection Market Forecast (USD Billion), by Sub-Segment 1, 2018-2029
Figure 18: North America Fat-Soluble Vitamins For Injection Market Forecast (USD Billion), by Sub-Segment 2, 2018-2029
Figure 19: North America Fat-Soluble Vitamins For Injection Market Value Share (%), By Segment 2, 2022 & 2029
Figure 20: North America Fat-Soluble Vitamins For Injection Market Forecast (USD Billion), by Sub-Segment 1, 2018-2029
Figure 21: North America Fat-Soluble Vitamins For Injection Market Forecast (USD Billion), by Sub-Segment 2, 2018-2029
Figure 22: North America Fat-Soluble Vitamins For Injection Market Forecast (USD Billion), by Sub-Segment 3, 2018-2029
Figure 23: North America Fat-Soluble Vitamins For Injection Market Forecast (USD Billion), by Others, 2018-2029
Figure 24: North America Fat-Soluble Vitamins For Injection Market Value Share (%), By Segment 3, 2022 & 2029
Figure 25: North America Fat-Soluble Vitamins For Injection Market Forecast (USD Billion), by Sub-Segment 1, 2018-2029
Figure 26: North America Fat-Soluble Vitamins For Injection Market Forecast (USD Billion), by Sub-Segment 2, 2018-2029
Figure 27: North America Fat-Soluble Vitamins For Injection Market Forecast (USD Billion), by Sub-Segment 3, 2018-2029
Figure 28: North America Fat-Soluble Vitamins For Injection Market Forecast (USD Billion), by Others, 2018-2029
Figure 29: North America Fat-Soluble Vitamins For Injection Market Forecast (USD Billion), by U.S., 2018-2029
Figure 30: North America Fat-Soluble Vitamins For Injection Market Forecast (USD Billion), by Canada, 2018-2029
Figure 31: Latin America Fat-Soluble Vitamins For Injection Market Value Share (%), By Segment 1, 2022 & 2029
Figure 32: Latin America Fat-Soluble Vitamins For Injection Market Forecast (USD Billion), by Sub-Segment 1, 2018-2029
Figure 33: Latin America Fat-Soluble Vitamins For Injection Market Forecast (USD Billion), by Sub-Segment 2, 2018-2029
Figure 34: Latin America Fat-Soluble Vitamins For Injection Market Value Share (%), By Segment 2, 2022 & 2029
Figure 35: Latin America Fat-Soluble Vitamins For Injection Market Forecast (USD Billion), by Sub-Segment 1, 2018-2029
Figure 36: Latin America Fat-Soluble Vitamins For Injection Market Forecast (USD Billion), by Sub-Segment 2, 2018-2029
Figure 37: Latin America Fat-Soluble Vitamins For Injection Market Forecast (USD Billion), by Sub-Segment 3, 2018-2029
Figure 38: Latin America Fat-Soluble Vitamins For Injection Market Forecast (USD Billion), by Others, 2018-2029
Figure 39: Latin America Fat-Soluble Vitamins For Injection Market Value Share (%), By Segment 3, 2022 & 2029
Figure 40: Latin America Fat-Soluble Vitamins For Injection Market Forecast (USD Billion), by Sub-Segment 1, 2018-2029
Figure 41: Latin America Fat-Soluble Vitamins For Injection Market Forecast (USD Billion), by Sub-Segment 2, 2018-2029
Figure 42: Latin America Fat-Soluble Vitamins For Injection Market Forecast (USD Billion), by Sub-Segment 3, 2018-2029
Figure 43: Latin America Fat-Soluble Vitamins For Injection Market Forecast (USD Billion), by Others, 2018-2029
Figure 44: Latin America Fat-Soluble Vitamins For Injection Market Forecast (USD Billion), by Brazil, 2018-2029
Figure 45: Latin America Fat-Soluble Vitamins For Injection Market Forecast (USD Billion), by Mexico, 2018-2029
Figure 46: Latin America Fat-Soluble Vitamins For Injection Market Forecast (USD Billion), by Rest of Latin America, 2018-2029
Figure 47: Europe Fat-Soluble Vitamins For Injection Market Value Share (%), By Segment 1, 2022 & 2029
Figure 48: Europe Fat-Soluble Vitamins For Injection Market Forecast (USD Billion), by Sub-Segment 1, 2018-2029
Figure 49: Europe Fat-Soluble Vitamins For Injection Market Forecast (USD Billion), by Sub-Segment 2, 2018-2029
Figure 50: Europe Fat-Soluble Vitamins For Injection Market Value Share (%), By Segment 2, 2022 & 2029
Figure 51: Europe Fat-Soluble Vitamins For Injection Market Forecast (USD Billion), by Sub-Segment 1, 2018-2029
Figure 52: Europe Fat-Soluble Vitamins For Injection Market Forecast (USD Billion), by Sub-Segment 2, 2018-2029
Figure 53: Europe Fat-Soluble Vitamins For Injection Market Forecast (USD Billion), by Sub-Segment 3, 2018-2029
Figure 54: Europe Fat-Soluble Vitamins For Injection Market Forecast (USD Billion), by Others, 2018-2029
Figure 55: Europe Fat-Soluble Vitamins For Injection Market Value Share (%), By Segment 3, 2022 & 2029
Figure 56: Europe Fat-Soluble Vitamins For Injection Market Forecast (USD Billion), by Sub-Segment 1, 2018-2029
Figure 57: Europe Fat-Soluble Vitamins For Injection Market Forecast (USD Billion), by Sub-Segment 2, 2018-2029
Figure 58: Europe Fat-Soluble Vitamins For Injection Market Forecast (USD Billion), by Sub-Segment 3, 2018-2029
Figure 59: Europe Fat-Soluble Vitamins For Injection Market Forecast (USD Billion), by Others, 2018-2029
Figure 60: Europe Fat-Soluble Vitamins For Injection Market Forecast (USD Billion), by U.K., 2018-2029
Figure 61: Europe Fat-Soluble Vitamins For Injection Market Forecast (USD Billion), by Germany, 2018-2029
Figure 62: Europe Fat-Soluble Vitamins For Injection Market Forecast (USD Billion), by France, 2018-2029
Figure 63: Europe Fat-Soluble Vitamins For Injection Market Forecast (USD Billion), by Italy, 2018-2029
Figure 64: Europe Fat-Soluble Vitamins For Injection Market Forecast (USD Billion), by Spain, 2018-2029
Figure 65: Europe Fat-Soluble Vitamins For Injection Market Forecast (USD Billion), by Russia, 2018-2029
Figure 66: Europe Fat-Soluble Vitamins For Injection Market Forecast (USD Billion), by Rest of Europe, 2018-2029
Figure 67: Asia Pacific Fat-Soluble Vitamins For Injection Market Value Share (%), By Segment 1, 2022 & 2029
Figure 68: Asia Pacific Fat-Soluble Vitamins For Injection Market Forecast (USD Billion), by Sub-Segment 1, 2018-2029
Figure 69: Asia Pacific Fat-Soluble Vitamins For Injection Market Forecast (USD Billion), by Sub-Segment 2, 2018-2029
Figure 70: Asia Pacific Fat-Soluble Vitamins For Injection Market Value Share (%), By Segment 2, 2022 & 2029
Figure 71: Asia Pacific Fat-Soluble Vitamins For Injection Market Forecast (USD Billion), by Sub-Segment 1, 2018-2029
Figure 72: Asia Pacific Fat-Soluble Vitamins For Injection Market Forecast (USD Billion), by Sub-Segment 2, 2018-2029
Figure 73: Asia Pacific Fat-Soluble Vitamins For Injection Market Forecast (USD Billion), by Sub-Segment 3, 2018-2029
Figure 74: Asia Pacific Fat-Soluble Vitamins For Injection Market Forecast (USD Billion), by Others, 2018-2029
Figure 75: Asia Pacific Fat-Soluble Vitamins For Injection Market Value Share (%), By Segment 3, 2022 & 2029
Figure 76: Asia Pacific Fat-Soluble Vitamins For Injection Market Forecast (USD Billion), by Sub-Segment 1, 2018-2029
Figure 77: Asia Pacific Fat-Soluble Vitamins For Injection Market Forecast (USD Billion), by Sub-Segment 2, 2018-2029
Figure 78: Asia Pacific Fat-Soluble Vitamins For Injection Market Forecast (USD Billion), by Sub-Segment 3, 2018-2029
Figure 79: Asia Pacific Fat-Soluble Vitamins For Injection Market Forecast (USD Billion), by Others, 2018-2029
Figure 80: Asia Pacific Fat-Soluble Vitamins For Injection Market Forecast (USD Billion), by China, 2018-2029
Figure 81: Asia Pacific Fat-Soluble Vitamins For Injection Market Forecast (USD Billion), by India, 2018-2029
Figure 82: Asia Pacific Fat-Soluble Vitamins For Injection Market Forecast (USD Billion), by Japan, 2018-2029
Figure 83: Asia Pacific Fat-Soluble Vitamins For Injection Market Forecast (USD Billion), by Australia, 2018-2029
Figure 84: Asia Pacific Fat-Soluble Vitamins For Injection Market Forecast (USD Billion), by Southeast Asia, 2018-2029
Figure 85: Asia Pacific Fat-Soluble Vitamins For Injection Market Forecast (USD Billion), by Rest of Asia Pacific, 2018-2029
Figure 86: Middle East & Africa Fat-Soluble Vitamins For Injection Market Value Share (%), By Segment 1, 2022 & 2029
Figure 87: Middle East & Africa Fat-Soluble Vitamins For Injection Market Forecast (USD Billion), by Sub-Segment 1, 2018-2029
Figure 88: Middle East & Africa Fat-Soluble Vitamins For Injection Market Forecast (USD Billion), by Sub-Segment 2, 2018-2029
Figure 89: Middle East & Africa Fat-Soluble Vitamins For Injection Market Value Share (%), By Segment 2, 2022 & 2029
Figure 90: Middle East & Africa Fat-Soluble Vitamins For Injection Market Forecast (USD Billion), by Sub-Segment 1, 2018-2029
Figure 91: Middle East & Africa Fat-Soluble Vitamins For Injection Market Forecast (USD Billion), by Sub-Segment 2, 2018-2029
Figure 92: Middle East & Africa Fat-Soluble Vitamins For Injection Market Forecast (USD Billion), by Sub-Segment 3, 2018-2029
Figure 93: Middle East & Africa Fat-Soluble Vitamins For Injection Market Forecast (USD Billion), by Others, 2018-2029
Figure 94: Middle East & Africa Fat-Soluble Vitamins For Injection Market Value Share (%), By Segment 3, 2022 & 2029
Figure 95: Middle East & Africa Fat-Soluble Vitamins For Injection Market Forecast (USD Billion), by Sub-Segment 1, 2018-2029
Figure 96: Middle East & Africa Fat-Soluble Vitamins For Injection Market Forecast (USD Billion), by Sub-Segment 2, 2018-2029
Figure 97: Middle East & Africa Fat-Soluble Vitamins For Injection Market Forecast (USD Billion), by Sub-Segment 3, 2018-2029
Figure 98: Middle East & Africa Fat-Soluble Vitamins For Injection Market Forecast (USD Billion), by Others, 2018-2029
Figure 99: Middle East & Africa Fat-Soluble Vitamins For Injection Market Forecast (USD Billion), by GCC, 2018-2029
Figure 100: Middle East & Africa Fat-Soluble Vitamins For Injection Market Forecast (USD Billion), by South Africa, 2018-2029
Figure 101: Middle East & Africa Fat-Soluble Vitamins For Injection Market Forecast (USD Billion), by Rest of Middle East & Africa, 2018-2029
List of Tables
Table 1: Global Fat-Soluble Vitamins For Injection Market Revenue (USD Billion) Forecast, by Segment 1, 2018-2029
Table 2: Global Fat-Soluble Vitamins For Injection Market Revenue (USD Billion) Forecast, by Segment 2, 2018-2029
Table 3: Global Fat-Soluble Vitamins For Injection Market Revenue (USD Billion) Forecast, by Segment 3, 2018-2029
Table 4: Global Fat-Soluble Vitamins For Injection Market Revenue (USD Billion) Forecast, by Region, 2018-2029
Table 5: North America Fat-Soluble Vitamins For Injection Market Revenue (USD Billion) Forecast, by Segment 1, 2018-2029
Table 6: North America Fat-Soluble Vitamins For Injection Market Revenue (USD Billion) Forecast, by Segment 2, 2018-2029
Table 7: North America Fat-Soluble Vitamins For Injection Market Revenue (USD Billion) Forecast, by Segment 3, 2018-2029
Table 8: North America Fat-Soluble Vitamins For Injection Market Revenue (USD Billion) Forecast, by Country, 2018-2029
Table 9: Europe Fat-Soluble Vitamins For Injection Market Revenue (USD Billion) Forecast, by Segment 1, 2018-2029
Table 10: Europe Fat-Soluble Vitamins For Injection Market Revenue (USD Billion) Forecast, by Segment 2, 2018-2029
Table 11: Europe Fat-Soluble Vitamins For Injection Market Revenue (USD Billion) Forecast, by Segment 3, 2018-2029
Table 12: Europe Fat-Soluble Vitamins For Injection Market Revenue (USD Billion) Forecast, by Country, 2018-2029
Table 13: Latin America Fat-Soluble Vitamins For Injection Market Revenue (USD Billion) Forecast, by Segment 1, 2018-2029
Table 14: Latin America Fat-Soluble Vitamins For Injection Market Revenue (USD Billion) Forecast, by Segment 2, 2018-2029
Table 15: Latin America Fat-Soluble Vitamins For Injection Market Revenue (USD Billion) Forecast, by Segment 3, 2018-2029
Table 16: Latin America Fat-Soluble Vitamins For Injection Market Revenue (USD Billion) Forecast, by Country, 2018-2029
Table 17: Asia Pacific Fat-Soluble Vitamins For Injection Market Revenue (USD Billion) Forecast, by Segment 1, 2018-2029
Table 18: Asia Pacific Fat-Soluble Vitamins For Injection Market Revenue (USD Billion) Forecast, by Segment 2, 2018-2029
Table 19: Asia Pacific Fat-Soluble Vitamins For Injection Market Revenue (USD Billion) Forecast, by Segment 3, 2018-2029
Table 20: Asia Pacific Fat-Soluble Vitamins For Injection Market Revenue (USD Billion) Forecast, by Country, 2018-2029
Table 21: Middle East & Africa Fat-Soluble Vitamins For Injection Market Revenue (USD Billion) Forecast, by Segment 1, 2018-2029
Table 22: Middle East & Africa Fat-Soluble Vitamins For Injection Market Revenue (USD Billion) Forecast, by Segment 2, 2018-2029
Table 23: Middle East & Africa Fat-Soluble Vitamins For Injection Market Revenue (USD Billion) Forecast, by Segment 3, 2018-2029
Table 24: Middle East & Africa Fat-Soluble Vitamins For Injection Market Revenue (USD Billion) Forecast, by Country, 2018-2029
Research Process
Data Library Research are conducted by industry experts who offer insight on
industry structure, market segmentations technology assessment and competitive landscape (CL), and penetration, as well as on emerging trends. Their analysis is based on primary interviews (~ 80%) and secondary research (~ 20%) as well as years of professional expertise in their respective industries. Adding to this, by analysing historical trends and current market positions, our analysts predict where the market will be headed for the next five years. Furthermore, the varying trends of segment & categories geographically presented are also studied and the estimated based on the primary & secondary research.
In this particular report from the supply side Data Library Research has conducted primary surveys (interviews) with the key level executives (VP, CEO’s, Marketing Director, Business Development Manager
and SOFT) of the companies that active & prominent as well as the midsized organization
FIGURE 1: DLR RESEARH PROCESS
![research-methodology1]()
Primary Research
Extensive primary research was conducted to gain a deeper insight of the market and industry performance. The analysis is based on both primary and secondary research as well as years of professional expertise in the respective industries.
In addition to analysing current and historical trends, our analysts predict where the market is headed over the next five years.
It varies by segment for these categories geographically presented in the list of market tables. Speaking about this particular report we have conducted primary surveys (interviews) with the key level executives (VP, CEO’s, Marketing Director, Business Development Manager and many more) of the major players active in the market.
Secondary Research
Secondary research was mainly used to collect and identify information useful for the extensive, technical, market-oriented, and Friend’s study of the Global Extra Neutral Alcohol. It was also used to obtain key information about major players, market classification and segmentation according to the industry trends, geographical markets, and developments related to the market and technology perspectives. For this study, analysts have gathered information from various credible sources, such as annual reports, sec filings, journals, white papers, SOFT presentations, and company web sites.
Market Size Estimation
Both, top-down and bottom-up approaches were used to estimate and validate the size of the Global market and to estimate the size of various other dependent submarkets in the overall Extra Neutral Alcohol. The key players in the market were identified through secondary research and their market contributions in the respective geographies were determined through primary and secondary research.
Forecast Model
![research-methodology2]()