Glycemic Treatment Drugs Market Overview and Analysis:

The Global Glycemic Treatment Drugs Market size was valued at USD 88.32 billion in 2024. The market is projected to grow from USD 101.48 billion in 2025 to USD 233.84.

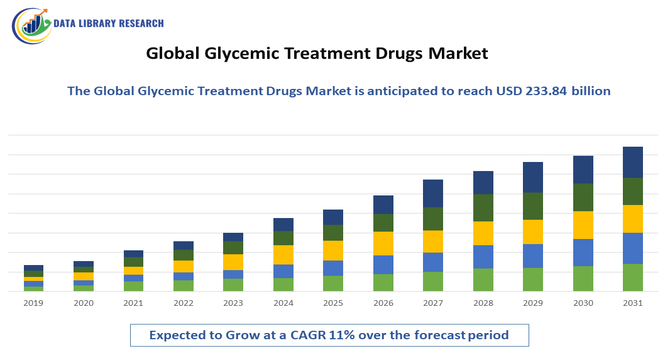
The Global Glycemic Treatment Drugs Market comprises pharmaceutical products aimed at managing blood glucose levels in patients with diabetes mellitus. Growth is driven by the rising prevalence of diabetes, increasing geriatric population, unhealthy lifestyles, urbanization, and growing awareness of effective glycemic control. Technological advancements in drug delivery and rising healthcare expenditures also contribute.

Glycemic Treatment Drugs Market Latest Trends

The glycemic treatment drugs market is witnessing trends such as the growing adoption of combination therapies and fixed-dose formulations that improve patient adherence and simplify treatment regimens. There is increasing emphasis on biologics and insulin analogs with extended action, minimizing hypoglycemic risks. Integration with digital health technologies, such as continuous glucose monitors and smart insulin pens, allows personalized dosing and real-time monitoring.

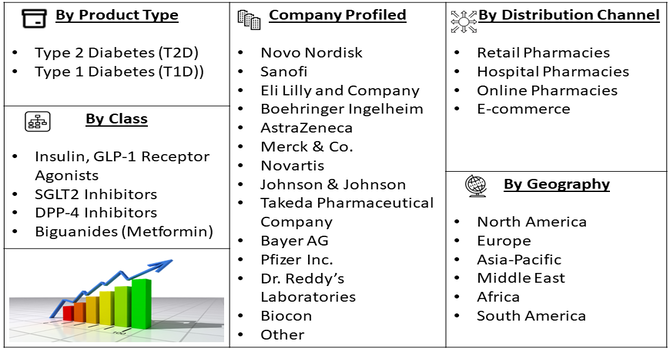
Segmentation: The Global Glycemic Treatment Drugs Market is segmented by Drug Class (Insulin, GLP-1 Receptor Agonists, SGLT2 Inhibitors, DPP-4 Inhibitors, and Biguanides (Metformin)), Diabetes Type (Type 2 Diabetes (T2D) and Type 1 Diabetes (T1D)), Route of Administration (Oral Drugs and Injectable Drugs), Distribution Channel (Retail Pharmacies, Hospital Pharmacies and Online Pharmacies & E-commerce) and Geography (North America, Europe, Asia-Pacific, Middle East and Africa, and South America). The report provides the value (in USD million) for the above segments.

Market Drivers:

  • Increasing Diabetes Prevalence

The global rise in diabetes prevalence is a primary driver for the glycemic treatment drugs market. Rapid urbanization, sedentary lifestyles, poor dietary habits, and genetic predisposition have led to a surge in both type 1 and type 2 diabetes worldwide. According to the International Diabetes Federation, over 500 million adults are living with diabetes, a number projected to increase significantly by 2030. This growing patient population drives demand for effective pharmacological interventions to maintain blood glucose levels and prevent complications such as cardiovascular disease, neuropathy, and kidney failure. Consequently, pharmaceutical companies are expanding production, investing in R&D, and introducing new formulations, strengthening the global glycemic treatment drugs market.

  • Technological Advancements in Drug Formulations

Technological innovations in glycemic treatment drugs have significantly boosted market growth. Modern advancements include extended-release formulations, combination therapies, injectable insulin analogs, and oral anti-diabetic drugs with improved bioavailability and reduced side effects. Additionally, integration of digital health tools, such as smart insulin pens and continuous glucose monitoring systems, allows for better disease management and patient adherence. These innovations enhance efficacy, safety, and convenience, encouraging healthcare providers to adopt newer treatments.

Pharmaceutical companies are also investing in precision medicine approaches tailored to patient-specific needs, expanding therapeutic options. For instance, in 2024, AstraZeneca’s Farxiga (dapagliflozin) received FDA approval to improve glycemic control in pediatric type-2 diabetes patients aged 10 and above, based on Phase III T2NOW trial results. This milestone expanded treatment options for children, underscoring pharmaceutical investment in precision medicine and reinforcing innovation in targeted glycemic therapies. Collectively, these technological advancements support the development and adoption of effective glycemic management therapies, driving market growth globally.

Market Restraints

  • High Treatment Costs and Limited Accessibility

A significant restraint for the glycemic treatment drugs market is the high cost of treatment, particularly in developing and low-income countries. Advanced insulin formulations, combination therapies, and innovative delivery systems are often expensive, limiting accessibility for many patients. Additionally, the chronic nature of diabetes requires lifelong medication, further increasing financial burdens on individuals and healthcare systems. Insurance coverage and reimbursement limitations exacerbate the challenge, particularly for uninsured or underinsured populations. Inadequate healthcare infrastructure in rural and underserved areas also restricts access to essential drugs. These factors collectively impede market penetration, especially in emerging economies, and pose a challenge to widespread adoption despite rising diabetes prevalence and demand for effective glycemic management.

Socioeconomic Impact on Glycemic Treatment Drugs Market

The global glycemic treatment drugs market has substantial socioeconomic implications. Effective management of diabetes reduces the risk of complications such as cardiovascular disease, kidney failure, and neuropathy, improving patient quality of life and reducing healthcare expenditures. Increased access to glycemic therapies supports workforce productivity and minimizes economic burden on families and healthcare systems. Rising healthcare awareness and education programs promote early diagnosis and adherence to prescribed therapies, preventing long-term societal costs.

Segmental Analysis

  • GLP-1 Receptor Agonists segment is expected to witness highest growth over the forecast period

The GLP-1 receptor agonists segment is expected to witness the highest growth due to increasing adoption for managing type 2 diabetes and obesity-related complications. These drugs not only improve glycemic control but also aid in weight reduction, cardiovascular risk management, and appetite regulation. Growing clinical evidence supporting their efficacy and safety, along with endorsements from healthcare professionals, has boosted demand. Patient preference for therapies offering multiple benefits, coupled with ongoing R&D for long-acting and more convenient formulations, further fuels market expansion. This segment’s integration into personalized diabetes management strategies is driving robust growth globally.

  • Type 2 segment is expected to witness highest growth over the forecast period

The type 2 diabetes segment is projected to experience the highest growth owing to its high prevalence worldwide. Lifestyle changes, obesity, and aging populations contribute to the rising number of patients, driving the demand for effective glycemic management drugs. Increased screening, diagnosis, and awareness have expanded the patient base seeking treatment. Pharmaceutical companies are focusing on developing novel oral and injectable drugs targeting type 2 diabetes, enhancing efficacy, and reducing side effects. Government initiatives, healthcare infrastructure improvements, and insurance coverage for antidiabetic therapies further accelerate adoption, positioning type 2 diabetes as the dominant growth driver within the glycemic treatment drugs market.

  • Oral segment is expected to witness highest growth over the forecast period

The oral segment is expected to witness the highest growth due to patient preference for convenient, non-invasive drug administration. Oral antidiabetic drugs, including metformin, SGLT2 inhibitors, DPP-4 inhibitors, and combination therapies, offer ease of use, improved adherence, and fewer lifestyle disruptions compared to injectables. Pharmaceutical innovation in extended-release, combination, and targeted oral therapies enhances efficacy and reduces side effects, boosting market adoption. Additionally, increased awareness of self-management and home-based treatment options supports oral drug usage. This convenience-driven demand, coupled with rising type 2 diabetes prevalence, makes the oral segment a leading contributor to the global glycemic treatment drugs market.

  • Online Pharmacies & E-commerce segment is expected to witness highest growth over the forecast period

The online pharmacies and e-commerce segment is projected to grow rapidly due to increasing digitalization in healthcare and patient preference for home delivery of medications. The convenience, privacy, and cost-effectiveness of online purchases have encouraged patients to obtain glycemic treatment drugs through e-commerce platforms. Telemedicine integration, subscription services, and digital health tools allow physicians to prescribe medications remotely, expanding reach to underserved or remote regions. Furthermore, growing internet penetration, smartphone adoption, and secure payment systems have boosted consumer confidence. These factors collectively accelerate the adoption of online pharmacies as a primary distribution channel for glycemic treatment drugs worldwide.

  • North America Region segment is expected to witness highest growth over the forecast period

North America is expected to witness the highest growth due to high diabetes prevalence, advanced healthcare infrastructure, and strong adoption of innovative glycemic treatment drugs. The region benefits from well-established healthcare systems, widespread insurance coverage, and a growing geriatric population, driving demand for effective diabetes management therapies. Additionally,

North America leads in pharmaceutical R&D, clinical trials, and early adoption of GLP-1 receptor agonists, SGLT2 inhibitors, and combination therapies. For instance, in February 2025, The U.S. FDA approved Merilog (insulin-aspart-szjj) as the first rapid-acting insulin biosimilar to Novolog, enhancing glycemic control in adults and pediatric diabetes patients. Available in prefilled pens and multi-dose vials, Merilog helps manage mealtime blood sugar spikes. Its approval expanded affordable, effective insulin options, strengthening the U.S. glycemic treatment drugs market.

Digital health integration, telemedicine, and online pharmacy growth further support market expansion. Rising patient awareness and government initiatives aimed at diabetes prevention and treatment also contribute to North America’s leading role in the glycemic treatment drugs market.

Glycemic Treatment Drugs Market Competitive Landscape

The glycemic treatment drugs market is highly competitive, dominated by multinational pharmaceutical companies alongside regional and generic manufacturers. Key players include Novo Nordisk, Sanofi, Eli Lilly, Merck, Boehringer Ingelheim, AstraZeneca, and GlaxoSmithKline. Competition is driven by innovation in drug formulations, patent portfolios, clinical trials, and pricing strategies. Companies focus on R&D for novel insulin analogs, oral anti-diabetic drugs, and combination therapies. Strategic collaborations, mergers, and acquisitions are common to expand global presence and product portfolios. Differentiation relies on efficacy, safety, patient adherence, and integration with digital health solutions, making innovation and regulatory compliance critical for maintaining market leadership.

The major players for this market are:

  • Novo Nordisk
  • Sanofi
  • Eli Lilly and Company
  • Boehringer Ingelheim
  • AstraZeneca
  • Merck & Co.
  • Novartis
  • Johnson & Johnson
  • Takeda Pharmaceutical Company
  • Bayer AG
  • Pfizer Inc.
  • Dr. Reddy’s Laboratories
  • Teva Pharmaceutical Industries
  • Biocon
  • GSK (GlaxoSmithKline)
  • Bristol-Myers Squibb
  • Wockhardt
  • Mylan
  • Sandoz (Novartis division)
  • Oramed Pharmaceuticals Inc.

Recent Development

  • In October 2025, Eli Lilly announced positive Phase 3 results for orforglipron in ACHIEVE-2 and ACHIEVE-5 trials. The drug demonstrated significant A1C reduction, weight loss, and improved cardiovascular risk factors in adults with type 2 diabetes, whether compared to dapagliflozin or placebo, confirming efficacy and safety across multiple treatment regimens over 40 weeks.


  • In July 2025, Vertex Pharmaceuticals presented updated Phase 1/2 data from the FORWARD-101 trial of zimislecel (VX-880), a stem cell-derived islet cell therapy for type 1 diabetes patients with impaired hypoglycemic awareness and severe events. The findings were shared at the ADA conference and published in the New England Journal of Medicine.


Frequently Asked Questions (FAQ) :

Q1. What are the main growth-driving factors for this market?

The primary driver is the dramatic increase in the global prevalence of diabetes, especially Type 2, fueled by rising obesity rates, sedentary lifestyles, and poor dietary habits worldwide. Furthermore, continuous technological advancements, such as new drug classes (like GLP-1 receptor agonists) and improved drug delivery systems, bolster market growth.

Q2. What are the main restraining factors for this market?

Major restraints include the high cost of novel antidiabetic therapies, which creates affordability issues for patients, particularly in low- and middle-income regions. Additionally, market growth is hampered by the increasing availability of generic drugs and biosimilars, which reduces the revenue of innovator companies.

Q3. Which segment is expected to witness high growth?

The GLP-1 receptor agonists drug class is expected to show the highest growth. These newer drugs are highly favored because they not only improve blood sugar control but also promote weight loss and offer cardiovascular benefits, making them a preferred treatment option for managing Type 2 diabetes.

Q4. Who are the top major players for this market?

The market is dominated by a few large pharmaceutical companies known for their diabetes portfolios. The top major players include Novo Nordisk, Eli Lilly and Company, Sanofi, AstraZeneca, and Boehringer Ingelheim. These companies drive innovation in insulin, GLP-1, and oral drug development.

Q5. Which country is the largest player?

North America, primarily the United States, is the largest market player globally in terms of revenue. This dominance is due to the high incidence of diabetes, advanced healthcare infrastructure, and significant healthcare spending, which results in the rapid and widespread adoption of premium, innovative treatments.

Glycemic Treatment Drugs MARKET STUDY GLOBAL MARKET ANALYSIS, INSIGHTS AND FORECAST, 2022-2029

    1. Introduction

    • 1.1. Research Scope
    • 1.2. Market Segmentation
    • 1.3. Research Methodology
    • 1.4. Definitions and Assumptions

    2. Executive Summary

      3. Market Dynamics

      • 3.1. Market Drivers
      • 3.2. Market Restraints
      • 3.3. Market Opportunities

      4. Key Insights

      • 4.1. Key Emerging Trends – For Major Countries
      • 4.2. Latest Technological Advancement
      • 4.3. Regulatory Landscape
      • 4.4. Industry SWOT Analysis
      • 4.5. Porters Five Forces Analysis

      5. Global Glycemic Treatment Drugs Market Analysis (USD Billion), Insights and Forecast, 2018-2029

      • 5.1. Key Findings / Summary
      • 5.2. Market Analysis, Insights and Forecast – By Segment 1
        • 5.2.1. Sub-Segment 1
        • 5.2.2. Sub-Segment 2
      • 5.3. Market Analysis, Insights and Forecast – By Segment 2
        • 5.3.1. Sub-Segment 1
        • 5.3.2. Sub-Segment 2
        • 5.3.3. Sub-Segment 3
        • 5.3.4. Others
      • 5.4. Market Analysis, Insights and Forecast – By Segment 3
        • 5.4.1. Sub-Segment 1
        • 5.4.2. Sub-Segment 2
        • 5.4.3. Sub-Segment 3
        • 5.4.4. Others
      • 5.5. Market Analysis, Insights and Forecast – By Region
        • 5.5.1. North America
        • 5.5.2. Latin America
        • 5.5.3. Europe
        • 5.5.4. Asia Pacific
        • 5.5.5. Middle East and Africa

      6. North America Glycemic Treatment Drugs Market Analysis (USD Billion), Insights and Forecast, 2018-2029

      • 6.1. Key Findings / Summary
      • 6.2. Market Analysis, Insights and Forecast – By Segment 1
        • 6.2.1. Sub-Segment 1
        • 6.2.2. Sub-Segment 2
      • 6.3. Market Analysis, Insights and Forecast – By Segment 2
        • 6.3.1. Sub-Segment 1
        • 6.3.2. Sub-Segment 2
        • 6.3.3. Sub-Segment 3
        • 6.3.4. Others
      • 6.4. Market Analysis, Insights and Forecast – By Segment 3
        • 6.4.1. Sub-Segment 1
        • 6.4.2. Sub-Segment 2
        • 6.4.3. Sub-Segment 3
        • 6.4.4. Others
      • 6.5. Market Analysis, Insights and Forecast – By Country
        • 6.5.1. U.S.
        • 6.5.2. Canada

      7. Latin America Glycemic Treatment Drugs Market Analysis (USD Billion), Insights and Forecast, 2018-2029

      • 7.1. Key Findings / Summary
      • 7.2. Market Analysis, Insights and Forecast – By Segment 1
        • 7.2.1. Sub-Segment 1
        • 7.2.2. Sub-Segment 2
      • 7.3. Market Analysis, Insights and Forecast – By Segment 2
        • 7.3.1. Sub-Segment 1
        • 7.3.2. Sub-Segment 2
        • 7.3.3. Sub-Segment 3
        • 7.3.4. Others
      • 7.4. Market Analysis, Insights and Forecast – By Segment 3
        • 7.4.1. Sub-Segment 1
        • 7.4.2. Sub-Segment 2
        • 7.4.3. Sub-Segment 3
        • 7.4.4. Others
      • 7.5. Insights and Forecast – By Country
        • 7.5.1. Brazil
        • 7.5.2. Mexico
        • 7.5.3. Rest of Latin America

      8. Europe Glycemic Treatment Drugs Market Analysis (USD Billion), Insights and Forecast, 2018-2029

      • 8.1. Key Findings / Summary
      • 8.2. Market Analysis, Insights and Forecast – By Segment 1
        • 8.2.1. Sub-Segment 1
        • 8.2.2. Sub-Segment 2
      • 8.3. Market Analysis, Insights and Forecast – By Segment 2
        • 8.3.1. Sub-Segment 1
        • 8.3.2. Sub-Segment 2
        • 8.3.3. Sub-Segment 3
        • 8.3.4. Others
      • 8.4. Market Analysis, Insights and Forecast – By Segment 3
        • 8.4.1. Sub-Segment 1
        • 8.4.2. Sub-Segment 2
        • 8.4.3. Sub-Segment 3
        • 8.4.4. Others
      • 8.5. Market Analysis, Insights and Forecast – By Country
        • 8.5.1. UK
        • 8.5.2. Germany
        • 8.5.3. France
        • 8.5.4. Italy
        • 8.5.5. Spain
        • 8.5.6. Russia
        • 8.5.7. Rest of Europe

      9. Asia Pacific Glycemic Treatment Drugs Market Analysis (USD Billion), Insights and Forecast, 2018-2029

      • 9.1. Key Findings / Summary
      • 9.2. Market Analysis, Insights and Forecast – By Segment 1
        • 9.2.1. Sub-Segment 1
        • 9.2.2. Sub-Segment 2
      • 9.3. Market Analysis, Insights and Forecast – By Segment 2
        • 9.3.1. Sub-Segment 1
        • 9.3.2. Sub-Segment 2
        • 9.3.3. Sub-Segment 3
        • 9.3.4. Others
      • 9.4. Market Analysis, Insights and Forecast – By Segment 3
        • 9.4.1. Sub-Segment 1
        • 9.4.2. Sub-Segment 2
        • 9.4.3. Sub-Segment 3
        • 9.4.4. Others
      • 9.5. Market Analysis, Insights and Forecast – By Country
        • 9.5.1. China
        • 9.5.2. India
        • 9.5.3. Japan
        • 9.5.4. Australia
        • 9.5.5. South East Asia
        • 9.5.6. Rest of Asia Pacific

      10. Middle East & Africa Glycemic Treatment Drugs Market Analysis (USD Billion), Insights and Forecast, 2018-2029

      • 10.1. Key Findings / Summary
      • 10.2. Market Analysis, Insights and Forecast – By Segment 1
        • 10.2.1. Sub-Segment 1
        • 10.2.2. Sub-Segment 2
      • 10.3. Market Analysis, Insights and Forecast – By Segment 2
        • 10.3.1. Sub-Segment 1
        • 10.3.2. Sub-Segment 2
        • 10.3.3. Sub-Segment 3
        • 10.3.4. Others
      • 10.4. Market Analysis, Insights and Forecast – By Segment 3
        • 10.4.1. Sub-Segment 1
        • 10.4.2. Sub-Segment 2
        • 10.4.3. Sub-Segment 3
        • 10.4.4. Others
      • 10.5. Market Analysis, Insights and Forecast – By Country
        • 10.5.1. GCC
        • 10.5.2. South Africa
        • 10.5.3. Rest of Middle East & Africa

      11. Competitive Analysis

      • 11.1. Company Market Share Analysis, 2018
      • 11.2. Key Industry Developments
      • 11.3. Company Profile
        • 11.3.1. Company 1
          • 11.3.1.1. Business Overview
          • 11.3.1.2. Segment 1 & Service Offering
          • 11.3.1.3. Overall Revenue
          • 11.3.1.4. Geographic Presence
          • 11.3.1.5. Recent Development
        *Similar details will be provided for the following companies
        • 11.3.2. Company 2
        • 11.3.3. Company 3
        • 11.3.4. Company 4
        • 11.3.5. Company 5
        • 11.3.6. Company 6
        • 11.3.7. Company 7
        • 11.3.8. Company 8
        • 11.3.9. Company 9
        • 11.3.10. Company 10
        • 11.3.11. Company 11
        • 11.3.12. Company 12
      List of Figures

      Figure 1: Global Glycemic Treatment Drugs Market Revenue Breakdown (USD Billion, %) by Region, 2022 & 2029
      Figure 2: Global Glycemic Treatment Drugs Market Value Share (%), By Segment 1, 2022 & 2029
      Figure 3: Global Glycemic Treatment Drugs Market Forecast (USD Billion), by Sub-Segment 1, 2018-2029
      Figure 4: Global Glycemic Treatment Drugs Market Forecast (USD Billion), by Sub-Segment 2, 2018-2029
      Figure 5: Global Glycemic Treatment Drugs Market Value Share (%), By Segment 2, 2022 & 2029
      Figure 6: Global Glycemic Treatment Drugs Market Forecast (USD Billion), by Sub-Segment 1, 2018-2029
      Figure 7: Global Glycemic Treatment Drugs Market Forecast (USD Billion), by Sub-Segment 2, 2018-2029
      Figure 8: Global Glycemic Treatment Drugs Market Forecast (USD Billion), by Sub-Segment 3, 2018-2029
      Figure 9: Global Glycemic Treatment Drugs Market Forecast (USD Billion), by Others, 2018-2029
      Figure 10: Global Glycemic Treatment Drugs Market Value Share (%), By Segment 3, 2022 & 2029
      Figure 11: Global Glycemic Treatment Drugs Market Forecast (USD Billion), by Sub-Segment 1, 2018-2029
      Figure 12: Global Glycemic Treatment Drugs Market Forecast (USD Billion), by Sub-Segment 2, 2018-2029
      Figure 13: Global Glycemic Treatment Drugs Market Forecast (USD Billion), by Sub-Segment 3, 2018-2029
      Figure 14: Global Glycemic Treatment Drugs Market Forecast (USD Billion), by Others, 2018-2029
      Figure 15: Global Glycemic Treatment Drugs Market Value (USD Billion), by Region, 2022 & 2029
      Figure 16: North America Glycemic Treatment Drugs Market Value Share (%), By Segment 1, 2022 & 2029
      Figure 17: North America Glycemic Treatment Drugs Market Forecast (USD Billion), by Sub-Segment 1, 2018-2029
      Figure 18: North America Glycemic Treatment Drugs Market Forecast (USD Billion), by Sub-Segment 2, 2018-2029
      Figure 19: North America Glycemic Treatment Drugs Market Value Share (%), By Segment 2, 2022 & 2029
      Figure 20: North America Glycemic Treatment Drugs Market Forecast (USD Billion), by Sub-Segment 1, 2018-2029
      Figure 21: North America Glycemic Treatment Drugs Market Forecast (USD Billion), by Sub-Segment 2, 2018-2029
      Figure 22: North America Glycemic Treatment Drugs Market Forecast (USD Billion), by Sub-Segment 3, 2018-2029
      Figure 23: North America Glycemic Treatment Drugs Market Forecast (USD Billion), by Others, 2018-2029
      Figure 24: North America Glycemic Treatment Drugs Market Value Share (%), By Segment 3, 2022 & 2029
      Figure 25: North America Glycemic Treatment Drugs Market Forecast (USD Billion), by Sub-Segment 1, 2018-2029
      Figure 26: North America Glycemic Treatment Drugs Market Forecast (USD Billion), by Sub-Segment 2, 2018-2029
      Figure 27: North America Glycemic Treatment Drugs Market Forecast (USD Billion), by Sub-Segment 3, 2018-2029
      Figure 28: North America Glycemic Treatment Drugs Market Forecast (USD Billion), by Others, 2018-2029
      Figure 29: North America Glycemic Treatment Drugs Market Forecast (USD Billion), by U.S., 2018-2029
      Figure 30: North America Glycemic Treatment Drugs Market Forecast (USD Billion), by Canada, 2018-2029
      Figure 31: Latin America Glycemic Treatment Drugs Market Value Share (%), By Segment 1, 2022 & 2029
      Figure 32: Latin America Glycemic Treatment Drugs Market Forecast (USD Billion), by Sub-Segment 1, 2018-2029
      Figure 33: Latin America Glycemic Treatment Drugs Market Forecast (USD Billion), by Sub-Segment 2, 2018-2029
      Figure 34: Latin America Glycemic Treatment Drugs Market Value Share (%), By Segment 2, 2022 & 2029
      Figure 35: Latin America Glycemic Treatment Drugs Market Forecast (USD Billion), by Sub-Segment 1, 2018-2029
      Figure 36: Latin America Glycemic Treatment Drugs Market Forecast (USD Billion), by Sub-Segment 2, 2018-2029
      Figure 37: Latin America Glycemic Treatment Drugs Market Forecast (USD Billion), by Sub-Segment 3, 2018-2029
      Figure 38: Latin America Glycemic Treatment Drugs Market Forecast (USD Billion), by Others, 2018-2029
      Figure 39: Latin America Glycemic Treatment Drugs Market Value Share (%), By Segment 3, 2022 & 2029
      Figure 40: Latin America Glycemic Treatment Drugs Market Forecast (USD Billion), by Sub-Segment 1, 2018-2029
      Figure 41: Latin America Glycemic Treatment Drugs Market Forecast (USD Billion), by Sub-Segment 2, 2018-2029
      Figure 42: Latin America Glycemic Treatment Drugs Market Forecast (USD Billion), by Sub-Segment 3, 2018-2029
      Figure 43: Latin America Glycemic Treatment Drugs Market Forecast (USD Billion), by Others, 2018-2029
      Figure 44: Latin America Glycemic Treatment Drugs Market Forecast (USD Billion), by Brazil, 2018-2029
      Figure 45: Latin America Glycemic Treatment Drugs Market Forecast (USD Billion), by Mexico, 2018-2029
      Figure 46: Latin America Glycemic Treatment Drugs Market Forecast (USD Billion), by Rest of Latin America, 2018-2029
      Figure 47: Europe Glycemic Treatment Drugs Market Value Share (%), By Segment 1, 2022 & 2029
      Figure 48: Europe Glycemic Treatment Drugs Market Forecast (USD Billion), by Sub-Segment 1, 2018-2029
      Figure 49: Europe Glycemic Treatment Drugs Market Forecast (USD Billion), by Sub-Segment 2, 2018-2029
      Figure 50: Europe Glycemic Treatment Drugs Market Value Share (%), By Segment 2, 2022 & 2029
      Figure 51: Europe Glycemic Treatment Drugs Market Forecast (USD Billion), by Sub-Segment 1, 2018-2029
      Figure 52: Europe Glycemic Treatment Drugs Market Forecast (USD Billion), by Sub-Segment 2, 2018-2029
      Figure 53: Europe Glycemic Treatment Drugs Market Forecast (USD Billion), by Sub-Segment 3, 2018-2029
      Figure 54: Europe Glycemic Treatment Drugs Market Forecast (USD Billion), by Others, 2018-2029
      Figure 55: Europe Glycemic Treatment Drugs Market Value Share (%), By Segment 3, 2022 & 2029
      Figure 56: Europe Glycemic Treatment Drugs Market Forecast (USD Billion), by Sub-Segment 1, 2018-2029
      Figure 57: Europe Glycemic Treatment Drugs Market Forecast (USD Billion), by Sub-Segment 2, 2018-2029
      Figure 58: Europe Glycemic Treatment Drugs Market Forecast (USD Billion), by Sub-Segment 3, 2018-2029
      Figure 59: Europe Glycemic Treatment Drugs Market Forecast (USD Billion), by Others, 2018-2029
      Figure 60: Europe Glycemic Treatment Drugs Market Forecast (USD Billion), by U.K., 2018-2029
      Figure 61: Europe Glycemic Treatment Drugs Market Forecast (USD Billion), by Germany, 2018-2029
      Figure 62: Europe Glycemic Treatment Drugs Market Forecast (USD Billion), by France, 2018-2029
      Figure 63: Europe Glycemic Treatment Drugs Market Forecast (USD Billion), by Italy, 2018-2029
      Figure 64: Europe Glycemic Treatment Drugs Market Forecast (USD Billion), by Spain, 2018-2029
      Figure 65: Europe Glycemic Treatment Drugs Market Forecast (USD Billion), by Russia, 2018-2029
      Figure 66: Europe Glycemic Treatment Drugs Market Forecast (USD Billion), by Rest of Europe, 2018-2029
      Figure 67: Asia Pacific Glycemic Treatment Drugs Market Value Share (%), By Segment 1, 2022 & 2029
      Figure 68: Asia Pacific Glycemic Treatment Drugs Market Forecast (USD Billion), by Sub-Segment 1, 2018-2029
      Figure 69: Asia Pacific Glycemic Treatment Drugs Market Forecast (USD Billion), by Sub-Segment 2, 2018-2029
      Figure 70: Asia Pacific Glycemic Treatment Drugs Market Value Share (%), By Segment 2, 2022 & 2029
      Figure 71: Asia Pacific Glycemic Treatment Drugs Market Forecast (USD Billion), by Sub-Segment 1, 2018-2029
      Figure 72: Asia Pacific Glycemic Treatment Drugs Market Forecast (USD Billion), by Sub-Segment 2, 2018-2029
      Figure 73: Asia Pacific Glycemic Treatment Drugs Market Forecast (USD Billion), by Sub-Segment 3, 2018-2029
      Figure 74: Asia Pacific Glycemic Treatment Drugs Market Forecast (USD Billion), by Others, 2018-2029
      Figure 75: Asia Pacific Glycemic Treatment Drugs Market Value Share (%), By Segment 3, 2022 & 2029
      Figure 76: Asia Pacific Glycemic Treatment Drugs Market Forecast (USD Billion), by Sub-Segment 1, 2018-2029
      Figure 77: Asia Pacific Glycemic Treatment Drugs Market Forecast (USD Billion), by Sub-Segment 2, 2018-2029
      Figure 78: Asia Pacific Glycemic Treatment Drugs Market Forecast (USD Billion), by Sub-Segment 3, 2018-2029
      Figure 79: Asia Pacific Glycemic Treatment Drugs Market Forecast (USD Billion), by Others, 2018-2029
      Figure 80: Asia Pacific Glycemic Treatment Drugs Market Forecast (USD Billion), by China, 2018-2029
      Figure 81: Asia Pacific Glycemic Treatment Drugs Market Forecast (USD Billion), by India, 2018-2029
      Figure 82: Asia Pacific Glycemic Treatment Drugs Market Forecast (USD Billion), by Japan, 2018-2029
      Figure 83: Asia Pacific Glycemic Treatment Drugs Market Forecast (USD Billion), by Australia, 2018-2029
      Figure 84: Asia Pacific Glycemic Treatment Drugs Market Forecast (USD Billion), by Southeast Asia, 2018-2029
      Figure 85: Asia Pacific Glycemic Treatment Drugs Market Forecast (USD Billion), by Rest of Asia Pacific, 2018-2029
      Figure 86: Middle East & Africa Glycemic Treatment Drugs Market Value Share (%), By Segment 1, 2022 & 2029
      Figure 87: Middle East & Africa Glycemic Treatment Drugs Market Forecast (USD Billion), by Sub-Segment 1, 2018-2029
      Figure 88: Middle East & Africa Glycemic Treatment Drugs Market Forecast (USD Billion), by Sub-Segment 2, 2018-2029
      Figure 89: Middle East & Africa Glycemic Treatment Drugs Market Value Share (%), By Segment 2, 2022 & 2029
      Figure 90: Middle East & Africa Glycemic Treatment Drugs Market Forecast (USD Billion), by Sub-Segment 1, 2018-2029
      Figure 91: Middle East & Africa Glycemic Treatment Drugs Market Forecast (USD Billion), by Sub-Segment 2, 2018-2029
      Figure 92: Middle East & Africa Glycemic Treatment Drugs Market Forecast (USD Billion), by Sub-Segment 3, 2018-2029
      Figure 93: Middle East & Africa Glycemic Treatment Drugs Market Forecast (USD Billion), by Others, 2018-2029
      Figure 94: Middle East & Africa Glycemic Treatment Drugs Market Value Share (%), By Segment 3, 2022 & 2029
      Figure 95: Middle East & Africa Glycemic Treatment Drugs Market Forecast (USD Billion), by Sub-Segment 1, 2018-2029
      Figure 96: Middle East & Africa Glycemic Treatment Drugs Market Forecast (USD Billion), by Sub-Segment 2, 2018-2029
      Figure 97: Middle East & Africa Glycemic Treatment Drugs Market Forecast (USD Billion), by Sub-Segment 3, 2018-2029
      Figure 98: Middle East & Africa Glycemic Treatment Drugs Market Forecast (USD Billion), by Others, 2018-2029
      Figure 99: Middle East & Africa Glycemic Treatment Drugs Market Forecast (USD Billion), by GCC, 2018-2029
      Figure 100: Middle East & Africa Glycemic Treatment Drugs Market Forecast (USD Billion), by South Africa, 2018-2029
      Figure 101: Middle East & Africa Glycemic Treatment Drugs Market Forecast (USD Billion), by Rest of Middle East & Africa, 2018-2029 
      List of Tables
      Table 1: Global Glycemic Treatment Drugs Market Revenue (USD Billion) Forecast, by Segment 1, 2018-2029
      Table 2: Global Glycemic Treatment Drugs Market Revenue (USD Billion) Forecast, by Segment 2, 2018-2029
      Table 3: Global Glycemic Treatment Drugs Market Revenue (USD Billion) Forecast, by Segment 3, 2018-2029
      Table 4: Global Glycemic Treatment Drugs Market Revenue (USD Billion) Forecast, by Region, 2018-2029
      Table 5: North America Glycemic Treatment Drugs Market Revenue (USD Billion) Forecast, by Segment 1, 2018-2029
      Table 6: North America Glycemic Treatment Drugs Market Revenue (USD Billion) Forecast, by Segment 2, 2018-2029
      Table 7: North America Glycemic Treatment Drugs Market Revenue (USD Billion) Forecast, by Segment 3, 2018-2029
      Table 8: North America Glycemic Treatment Drugs Market Revenue (USD Billion) Forecast, by Country, 2018-2029
      Table 9: Europe Glycemic Treatment Drugs Market Revenue (USD Billion) Forecast, by Segment 1, 2018-2029
      Table 10: Europe Glycemic Treatment Drugs Market Revenue (USD Billion) Forecast, by Segment 2, 2018-2029
      Table 11: Europe Glycemic Treatment Drugs Market Revenue (USD Billion) Forecast, by Segment 3, 2018-2029
      Table 12: Europe Glycemic Treatment Drugs Market Revenue (USD Billion) Forecast, by Country, 2018-2029
      Table 13: Latin America Glycemic Treatment Drugs Market Revenue (USD Billion) Forecast, by Segment 1, 2018-2029
      Table 14: Latin America Glycemic Treatment Drugs Market Revenue (USD Billion) Forecast, by Segment 2, 2018-2029
      Table 15: Latin America Glycemic Treatment Drugs Market Revenue (USD Billion) Forecast, by Segment 3, 2018-2029
      Table 16: Latin America Glycemic Treatment Drugs Market Revenue (USD Billion) Forecast, by Country, 2018-2029
      Table 17: Asia Pacific Glycemic Treatment Drugs Market Revenue (USD Billion) Forecast, by Segment 1, 2018-2029
      Table 18: Asia Pacific Glycemic Treatment Drugs Market Revenue (USD Billion) Forecast, by Segment 2, 2018-2029
      Table 19: Asia Pacific Glycemic Treatment Drugs Market Revenue (USD Billion) Forecast, by Segment 3, 2018-2029
      Table 20: Asia Pacific Glycemic Treatment Drugs Market Revenue (USD Billion) Forecast, by Country, 2018-2029
      Table 21: Middle East & Africa Glycemic Treatment Drugs Market Revenue (USD Billion) Forecast, by Segment 1, 2018-2029
      Table 22: Middle East & Africa Glycemic Treatment Drugs Market Revenue (USD Billion) Forecast, by Segment 2, 2018-2029
      Table 23: Middle East & Africa Glycemic Treatment Drugs Market Revenue (USD Billion) Forecast, by Segment 3, 2018-2029
      Table 24: Middle East & Africa Glycemic Treatment Drugs Market Revenue (USD Billion) Forecast, by Country, 2018-2029
      Research Process

      Data Library Research are conducted by industry experts who offer insight on industry structure, market segmentations technology assessment and competitive landscape (CL), and penetration, as well as on emerging trends. Their analysis is based on primary interviews (~ 80%) and secondary research (~ 20%) as well as years of professional expertise in their respective industries. Adding to this, by analysing historical trends and current market positions, our analysts predict where the market will be headed for the next five years. Furthermore, the varying trends of segment & categories geographically presented are also studied and the estimated based on the primary & secondary research.

      In this particular report from the supply side Data Library Research has conducted primary surveys (interviews) with the key level executives (VP, CEO’s, Marketing Director, Business Development Manager and SOFT) of the companies that active & prominent as well as the midsized organization

      FIGURE 1: DLR RESEARH PROCESS

      research-methodology1

      Primary Research

      Extensive primary research was conducted to gain a deeper insight of the market and industry performance. The analysis is based on both primary and secondary research as well as years of professional expertise in the respective industries.

      In addition to analysing current and historical trends, our analysts predict where the market is headed over the next five years.

      It varies by segment for these categories geographically presented in the list of market tables. Speaking about this particular report we have conducted primary surveys (interviews) with the key level executives (VP, CEO’s, Marketing Director, Business Development Manager and many more) of the major players active in the market.

      Secondary Research

      Secondary research was mainly used to collect and identify information useful for the extensive, technical, market-oriented, and Friend’s study of the Global Extra Neutral Alcohol. It was also used to obtain key information about major players, market classification and segmentation according to the industry trends, geographical markets, and developments related to the market and technology perspectives. For this study, analysts have gathered information from various credible sources, such as annual reports, sec filings, journals, white papers, SOFT presentations, and company web sites.

      Market Size Estimation

      Both, top-down and bottom-up approaches were used to estimate and validate the size of the Global market and to estimate the size of various other dependent submarkets in the overall Extra Neutral Alcohol. The key players in the market were identified through secondary research and their market contributions in the respective geographies were determined through primary and secondary research.

      Forecast Model

      research-methodology2

      Happy to Assist You

      If you have a question?

      info@datalibraryresearch.com

      IND : +91 955 279 0357

      Browse Related Reports