GS CMOS Image Sensor for Machine Vision Market Overview and Analysis
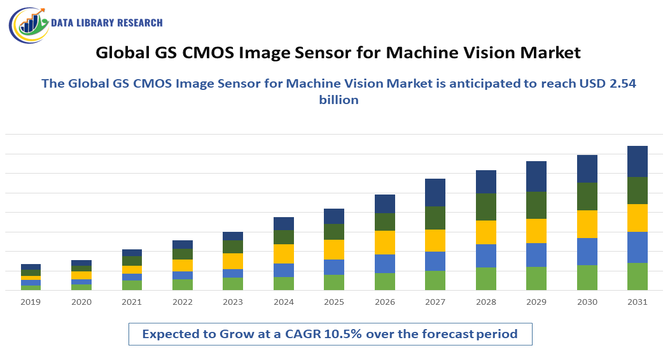
- The Global GS CMOS Image Sensor for Machine Vision Market is projected to be valued at approximately USD 1.04 billion in 2025 and is expected to grow to around USD 2.54 billion by 2032, registering a compound annual growth rate (CAGR) of about 10.5% during the forecast period from 2025 to 2032.
Get Complete Analysis Of The Report - Download Updated Free Sample PDF
The Global GS (Global Shutter) CMOS Image Sensor for Machine Vision Market refers to the industry focused on developing and supplying advanced image sensors that capture high-speed, distortion-free images, essential for machine vision applications. Unlike rolling shutter sensors, GS CMOS sensors capture the entire frame simultaneously, making them ideal for fast-moving industrial environments such as robotics, automated inspection, quality control, and intelligent transportation systems. As industries increasingly adopt automation and smart technologies, the demand for high-resolution, low-latency, and high-frame-rate imaging continues to grow. This market is driven by advancements in sensor technology, growing use of AI in vision systems, and expanding applications across manufacturing, automotive, logistics, and healthcare sectors worldwide.
GS CMOS Image Sensor for Machine Vision Market Latest Trends
The Global GS CMOS Image Sensor for Machine Vision Market is witnessing strong trends driven by the increasing integration of automation and AI in manufacturing and industrial inspection. There is growing demand for high-resolution, low-latency image sensors capable of capturing fast-moving objects without motion blur, which global shutter CMOS sensors provide. Miniaturization and advancements in sensor design are enabling compact, power-efficient sensors suitable for use in robotics, drones, and smart factory systems. Additionally, the shift toward Industry 4.0 and the adoption of machine vision in logistics, automotive, and electronics manufacturing are further accelerating market growth. Companies are also focusing on developing sensors with enhanced sensitivity and frame rates to meet evolving requirements in precision and real-time imaging.
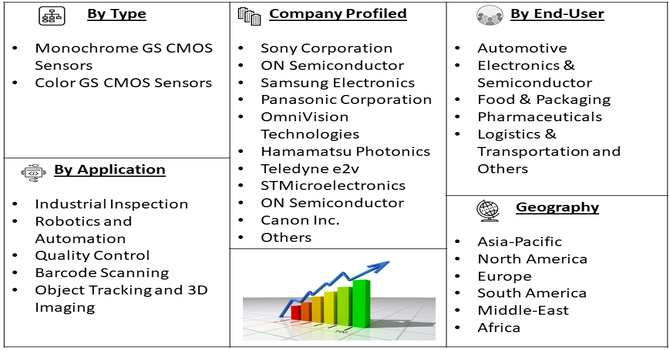
Segmentation: The Global GS CMOS Image Sensor for Machine Vision Market is Segmented by Sensor Type (Monochrome GS CMOS Sensors and Color GS CMOS Sensors), Resolution (Low Resolution (Up to 1 MP), Medium Resolution (1–5 MP) and High Resolution (Above 5 MP)), End-Use Industry (Automotive, Electronics & Semiconductor, Food & Packaging, Pharmaceuticals, Logistics & Transportation and Others), Application (Industrial Inspection, Robotics and Automation, Quality Control, Barcode Scanning, Object Tracking and 3D Imaging), and Geography (North America, Europe, Asia-Pacific, Latin America, Middle East & Africa). The report provides the value (in USD million) for the above segments.
For Detailed Market Segmentation - Get a Free Sample PDF
Market Drivers:
- Rise in Industrial Automation and Smart Manufacturing
The biggest drivers of this market is the rapid growth of industrial automation. More factories and industries are using robots and automated systems to inspect products, detect defects, and manage processes with minimal human intervention. For these systems to work effectively, they need high-quality images without distortion—especially when objects are moving fast. GS (Global Shutter) CMOS sensors are perfect for this because they capture the entire image at once, avoiding motion blur. As more companies move toward Industry 4.0 and smart manufacturing, the demand for these sensors will keep growing to support accurate and reliable machine vision in real-time operations.
- Increasing Adoption in Automotive and Electronics Industries
The automotive and electronics industries are adopting machine vision technologies at a fast pace for tasks like quality control, part inspection, alignment, and automation. These industries require high-speed, accurate imaging systems that can capture fast-moving parts without distortion—something GS CMOS image sensors are specifically designed to handle. In automotive manufacturing, even a tiny defect can impact safety, so precision is critical. Similarly, electronics manufacturers use these sensors to inspect small components on circuit boards. As both industries continue to automate more processes, the need for reliable, real-time imaging will drive strong growth in demand for GS CMOS image sensors.
Market Restraints:
- High Cost of Advanced Sensor Technology
The major restraints for the GS CMOS Image Sensor for Machine Vision Market is the high cost of advanced sensor technology. Global shutter sensors are more complex to design and manufacture compared to rolling shutter sensors. This leads to higher production and integration costs, making them less affordable for small and medium-sized enterprises, especially in cost-sensitive industries. Additionally, integrating these sensors into existing systems may require upgraded hardware and software, which adds to the overall expense. For companies with limited budgets, these factors can slow down adoption, even if the technology would ultimately improve efficiency and accuracy in their operations.
Socio Economic Impact on GS CMOS Image Sensor for Machine Vision Market
The Global GS CMOS Image Sensor for Machine Vision Market is having a positive socio-economic impact by supporting the global shift toward smarter, safer, and more efficient industrial operations. These sensors enable high-precision automation in sectors like manufacturing, automotive, logistics, and healthcare, leading to improved product quality, reduced waste, and lower operational costs. As industries adopt advanced machine vision systems, they also create demand for skilled workers in AI, robotics, and sensor integration, contributing to job growth in tech-driven fields. Additionally, the use of these sensors in safety-critical applications like autonomous vehicles and medical imaging enhances public safety and health outcomes. Thus, the market is helping drive economic modernization while promoting industrial productivity and technological innovation.
Segmental Analysis:
- Color GS CMOS Sensors Segment is Expected to Witness Significant Growth Over the Forecast Period
The Color GS CMOS Sensors segment is expected to witness significant growth as industries increasingly demand detailed and accurate color imaging for machine vision applications. Color sensors help detect subtle defects, color mismatches, and surface variations that monochrome sensors might miss, making them crucial for quality control in sectors like electronics, food processing, and packaging. Advances in sensor technology have improved color accuracy, sensitivity, and speed, enabling real-time inspection of fast-moving objects. As companies prioritize product quality and consumer safety, the adoption of color global shutter CMOS sensors is set to rise, supporting more sophisticated and precise machine vision systems across various industries.
- Medium Resolution (1–5 MP) Segment is Expected to Witness Significant Growth Over the Forecast Period
The Medium Resolution (1–5 MP) segment is expected to experience strong growth due to its ideal balance of image quality, speed, and cost-effectiveness. This resolution range is sufficient for many industrial machine vision tasks such as surface inspection, object recognition, and robotic guidance, without requiring the high costs and processing power associated with ultra-high-resolution sensors. Medium-resolution sensors enable faster data processing and lower latency, which is crucial for real-time applications in manufacturing and automation. Their versatility makes them popular across multiple industries, including electronics, automotive, and packaging, where efficient and reliable imaging is essential for maintaining production quality and operational efficiency.
- Electronics & Semiconductor Segment is Expected to Witness Significant Growth Over the Forecast Period
The Electronics & Semiconductor segment is expected to see significant growth as the demand for high-precision inspection systems intensifies. Manufacturing electronic components and semiconductors requires flawless quality control to detect minute defects such as cracks, contamination, or misalignments. GS CMOS image sensors play a critical role in these processes by providing distortion-free, high-speed imaging that can handle fast-moving production lines. As electronic devices become more compact and complex, the need for advanced machine vision solutions to ensure product reliability grows. This drives the adoption of global shutter sensors in semiconductor fabrication plants and electronics assembly lines, making this segment one of the fastest-growing markets for GS CMOS image sensors.
- Robotics and Automation Segment is Expected to Witness Significant Growth Over the Forecast Period
The Robotics and Automation segment is poised for strong growth as industries increasingly adopt automated systems to improve efficiency and reduce human error. Robots equipped with machine vision rely heavily on GS CMOS image sensors for accurate, distortion-free imaging, especially when identifying and handling fast-moving or complex objects. These sensors enable robots to perform precise tasks such as quality inspection, assembly, and navigation in real time. As factories and warehouses adopt more robotics solutions, demand for advanced imaging sensors rises, making GS CMOS sensors essential to the future of smart manufacturing and Industry 4.0. The ability to capture clear, high-speed images helps enhance automation performance across diverse sectors.
- North America Segment is Expected to Witness Significant Growth Over the Forecast Period
The North America segment is expected to witness significant growth due to its well-established industrial base and early adoption of advanced manufacturing technologies. The region boasts strong research and development capabilities, along with substantial investment in automation, robotics, and machine vision systems. Key industries such as automotive, electronics, aerospace, and logistics are rapidly integrating GS CMOS image sensors to enhance production quality and operational efficiency. Additionally, government initiatives supporting Industry 4.0 and smart factories further drive market expansion. North America’s technological infrastructure and skilled workforce make it a leading market for innovative imaging solutions, positioning the region for continued growth in the GS CMOS Image Sensor for Machine Vision Market.
| Report Matrics |
Details |
| Market Size Value |
USD 2.54 billion |
| Growth Rate |
CAGR of 10.5% |
| Forecast |
2026-2033 |
| Historical data |
2021-2024 |
| Base Year |
2025 |
| Report Coverage |
Forecasted revenue, company rating, competitive environment, growth drivers, and trends |
| Segment Coverage |
Type, Application, End-User, Geography |
| Regional Scope |
North America, Europe, Asia Pacific, Middle East |
| Customized scope |
Free customization of reports (With 3 months Analysis Support ) |
| To Learn More About This Report |
Request a Free Sample Copy |
GS CMOS Image Sensor for Machine Vision Market Competitive Landscape
The competitive landscape of the Global GS CMOS Image Sensor for Machine Vision Market is characterized by the presence of several leading technology companies focusing on innovation, quality, and strategic partnerships to maintain market leadership. Key players invest heavily in research and development to enhance sensor performance, including resolution, speed, and power efficiency, catering to diverse industrial applications. Companies compete by offering customized solutions for sectors like electronics, automotive, and robotics, while expanding their global footprint through collaborations and acquisitions. The market also sees ongoing technological advancements such as improved color accuracy and integration with AI systems, driving competition. Overall, firms that combine cutting-edge technology with strong customer support and supply chain efficiency are positioned to dominate this rapidly evolving market.
Here are 20 major players in the Global GS CMOS Image Sensor for Machine Vision Market:
- Sony Corporation
- ON Semiconductor
- Samsung Electronics
- Panasonic Corporation
- OmniVision Technologies
- Hamamatsu Photonics
- Teledyne e2v
- STMicroelectronics
- ON Semiconductor
- Canon Inc.
- Aptina Imaging (a division of ON Semiconductor)
- SK Hynix
- Sharp Corporation
- Toshiba Corporation
- Micron Technology
- Allegro Microsystems
- AMS AG
- Cypress Semiconductor (Infineon Technologies)
- Tower Semiconductor
- Texas Instruments
Recent News:
- In April 2025, OmniVision, a global developer of semiconductor technology including advanced digital imaging, analog, and display solutions, announced the new OX01N1B image sensor for in-cabin automotive driver monitoring systems (DMS). This device was the latest addition to OmniVision’s industry-leading Nyxel near-infrared (NIR) technology family of automotive sensors. It featured a 1.5-megapixel (MP) RGB-IR or Monochrome BSI global shutter (GS) sensor with a pixel size of 2.2 microns (µm) and an optical format of 1/4.51-inch. OmniVision showcased the OX01N1B sensor with ecosystem partners at Auto Shanghai.
- In April 2024, OmniVision, a global developer of semiconductor solutions including advanced digital imaging, analog, and touch & display technology, announced two new CMOS global shutter (GS) image sensors for machine vision applications. OmniVision established a new Machine Vision Unit focused on developing innovative solutions for industrial automation, robotics, logistics barcode scanners, and intelligent transportation systems (ITS).
Frequently Asked Questions (FAQ) :
Q1. What are the main growth driving factors for this market?
The market growth is primarily driven by the accelerated adoption of industrial automation and robotics across manufacturing sectors under Industry 4.0 initiatives, necessitating high-speed, high-resolution image acquisition. Global Shutter (GS) technology’s ability to capture distortion-free images of fast-moving objects is essential for precise quality assurance, inspection, and vision-guided robotics, particularly in electronics, automotive, and logistics applications. Furthermore, the rising demand for sophisticated 3D machine vision systems also fuels sensor demand.
Q2. What are the main restraining factors for this market?
The primary restraining factors for the GS CMOS Image Sensor for Machine Vision Market are the high upfront costs and the complexity associated with integrating advanced machine vision systems. These systems require significant initial investment in cameras, optics, and specialized hardware, which can be prohibitive for small and medium-sized enterprises (SMEs). Additionally, the lack of sufficient expertise and skilled professionals to deploy, calibrate, and maintain these complex vision systems presents a persistent operational challenge.
Q3. Which segment is expected to witness high growth?
The 3D Vision Systems segment within the machine vision application space is expected to witness the highest growth rate. This is due to the increasing need for high-accuracy measurement, positioning, and guidance in complex robotic and industrial tasks, which 3D vision, enabled by GS CMOS sensors, provides. The Smart Camera-based product segment is also anticipated to show rapid growth, driven by their compact, easy-to-integrate design and built-in processing for decentralized and efficient machine vision solutions.
Q4. Who are the top major players for this market?
The market is highly concentrated, with dominant players like Sony Semiconductor Solutions Corporation and ON Semiconductor (Onsemi) leading the production and innovation of high-performance GS CMOS sensors, with Onsemi often claiming the top share in industrial and automotive image sensors. Other major competitors include STMicroelectronics, Canon, and OmniVision. For the broader machine vision system market that uses these sensors, key players are Cognex Corporation, Keyence Corporation, and Teledyne Technologies.
Q5. Which country is the largest player?
The United States is typically the largest country-level player in the overall Machine Vision market due to the strong presence of major system vendors and a high rate of advanced technology adoption in its extensive industrial and tech sectors, coupled with significant R&D investment. However, China and the broader Asia-Pacific region dominate in terms of production and high-volume consumption, particularly driven by its vast electronics manufacturing and smart city initiatives, positioning it as the largest regional market for sensor demand.
List of Figures
Figure 1: Global GS CMOS Image Sensor for Machine Vision Market Revenue Breakdown (USD Billion, %) by Region, 2023 & 2029
Figure 2: Global GS CMOS Image Sensor for Machine Vision Market Value Share (%), By Segment 1, 2023 & 2029
Figure 3: Global GS CMOS Image Sensor for Machine Vision Market Forecast (USD Billion), by Sub-Segment 1, 2018-2029
Figure 4: Global GS CMOS Image Sensor for Machine Vision Market Forecast (USD Billion), by Sub-Segment 2, 2018-2029
Figure 5: Global GS CMOS Image Sensor for Machine Vision Market Value Share (%), By Segment 2, 2023 & 2029
Figure 6: Global GS CMOS Image Sensor for Machine Vision Market Forecast (USD Billion), by Sub-Segment 1, 2018-2029
Figure 7: Global GS CMOS Image Sensor for Machine Vision Market Forecast (USD Billion), by Sub-Segment 2, 2018-2029
Figure 8: Global GS CMOS Image Sensor for Machine Vision Market Forecast (USD Billion), by Sub-Segment 3, 2018-2029
Figure 9: Global GS CMOS Image Sensor for Machine Vision Market Forecast (USD Billion), by Others, 2018-2029
Figure 10: Global GS CMOS Image Sensor for Machine Vision Market Value Share (%), By Segment 3, 2023 & 2029
Figure 11: Global GS CMOS Image Sensor for Machine Vision Market Forecast (USD Billion), by Sub-Segment 1, 2018-2029
Figure 12: Global GS CMOS Image Sensor for Machine Vision Market Forecast (USD Billion), by Sub-Segment 2, 2018-2029
Figure 13: Global GS CMOS Image Sensor for Machine Vision Market Forecast (USD Billion), by Sub-Segment 3, 2018-2029
Figure 14: Global GS CMOS Image Sensor for Machine Vision Market Forecast (USD Billion), by Others, 2018-2029
Figure 15: Global GS CMOS Image Sensor for Machine Vision Market Value (USD Billion), by Region, 2023 & 2029
Figure 16: North America GS CMOS Image Sensor for Machine Vision Market Value Share (%), By Segment 1, 2023 & 2029
Figure 17: North America GS CMOS Image Sensor for Machine Vision Market Forecast (USD Billion), by Sub-Segment 1, 2018-2029
Figure 18: North America GS CMOS Image Sensor for Machine Vision Market Forecast (USD Billion), by Sub-Segment 2, 2018-2029
Figure 19: North America GS CMOS Image Sensor for Machine Vision Market Value Share (%), By Segment 2, 2023 & 2029
Figure 20: North America GS CMOS Image Sensor for Machine Vision Market Forecast (USD Billion), by Sub-Segment 1, 2018-2029
Figure 21: North America GS CMOS Image Sensor for Machine Vision Market Forecast (USD Billion), by Sub-Segment 2, 2018-2029
Figure 22: North America GS CMOS Image Sensor for Machine Vision Market Forecast (USD Billion), by Sub-Segment 3, 2018-2029
Figure 23: North America GS CMOS Image Sensor for Machine Vision Market Forecast (USD Billion), by Others, 2018-2029
Figure 24: North America GS CMOS Image Sensor for Machine Vision Market Value Share (%), By Segment 3, 2023 & 2029
Figure 25: North America GS CMOS Image Sensor for Machine Vision Market Forecast (USD Billion), by Sub-Segment 1, 2018-2029
Figure 26: North America GS CMOS Image Sensor for Machine Vision Market Forecast (USD Billion), by Sub-Segment 2, 2018-2029
Figure 27: North America GS CMOS Image Sensor for Machine Vision Market Forecast (USD Billion), by Sub-Segment 3, 2018-2029
Figure 28: North America GS CMOS Image Sensor for Machine Vision Market Forecast (USD Billion), by Others, 2018-2029
Figure 29: North America GS CMOS Image Sensor for Machine Vision Market Forecast (USD Billion), by U.S., 2018-2029
Figure 30: North America GS CMOS Image Sensor for Machine Vision Market Forecast (USD Billion), by Canada, 2018-2029
Figure 31: Latin America GS CMOS Image Sensor for Machine Vision Market Value Share (%), By Segment 1, 2023 & 2029
Figure 32: Latin America GS CMOS Image Sensor for Machine Vision Market Forecast (USD Billion), by Sub-Segment 1, 2018-2029
Figure 33: Latin America GS CMOS Image Sensor for Machine Vision Market Forecast (USD Billion), by Sub-Segment 2, 2018-2029
Figure 34: Latin America GS CMOS Image Sensor for Machine Vision Market Value Share (%), By Segment 2, 2023 & 2029
Figure 35: Latin America GS CMOS Image Sensor for Machine Vision Market Forecast (USD Billion), by Sub-Segment 1, 2018-2029
Figure 36: Latin America GS CMOS Image Sensor for Machine Vision Market Forecast (USD Billion), by Sub-Segment 2, 2018-2029
Figure 37: Latin America GS CMOS Image Sensor for Machine Vision Market Forecast (USD Billion), by Sub-Segment 3, 2018-2029
Figure 38: Latin America GS CMOS Image Sensor for Machine Vision Market Forecast (USD Billion), by Others, 2018-2029
Figure 39: Latin America GS CMOS Image Sensor for Machine Vision Market Value Share (%), By Segment 3, 2023 & 2029
Figure 40: Latin America GS CMOS Image Sensor for Machine Vision Market Forecast (USD Billion), by Sub-Segment 1, 2018-2029
Figure 41: Latin America GS CMOS Image Sensor for Machine Vision Market Forecast (USD Billion), by Sub-Segment 2, 2018-2029
Figure 42: Latin America GS CMOS Image Sensor for Machine Vision Market Forecast (USD Billion), by Sub-Segment 3, 2018-2029
Figure 43: Latin America GS CMOS Image Sensor for Machine Vision Market Forecast (USD Billion), by Others, 2018-2029
Figure 44: Latin America GS CMOS Image Sensor for Machine Vision Market Forecast (USD Billion), by Brazil, 2018-2029
Figure 45: Latin America GS CMOS Image Sensor for Machine Vision Market Forecast (USD Billion), by Mexico, 2018-2029
Figure 46: Latin America GS CMOS Image Sensor for Machine Vision Market Forecast (USD Billion), by Rest of Latin America, 2018-2029
Figure 47: Europe GS CMOS Image Sensor for Machine Vision Market Value Share (%), By Segment 1, 2023 & 2029
Figure 48: Europe GS CMOS Image Sensor for Machine Vision Market Forecast (USD Billion), by Sub-Segment 1, 2018-2029
Figure 49: Europe GS CMOS Image Sensor for Machine Vision Market Forecast (USD Billion), by Sub-Segment 2, 2018-2029
Figure 50: Europe GS CMOS Image Sensor for Machine Vision Market Value Share (%), By Segment 2, 2023 & 2029
Figure 51: Europe GS CMOS Image Sensor for Machine Vision Market Forecast (USD Billion), by Sub-Segment 1, 2018-2029
Figure 52: Europe GS CMOS Image Sensor for Machine Vision Market Forecast (USD Billion), by Sub-Segment 2, 2018-2029
Figure 53: Europe GS CMOS Image Sensor for Machine Vision Market Forecast (USD Billion), by Sub-Segment 3, 2018-2029
Figure 54: Europe GS CMOS Image Sensor for Machine Vision Market Forecast (USD Billion), by Others, 2018-2029
Figure 55: Europe GS CMOS Image Sensor for Machine Vision Market Value Share (%), By Segment 3, 2023 & 2029
Figure 56: Europe GS CMOS Image Sensor for Machine Vision Market Forecast (USD Billion), by Sub-Segment 1, 2018-2029
Figure 57: Europe GS CMOS Image Sensor for Machine Vision Market Forecast (USD Billion), by Sub-Segment 2, 2018-2029
Figure 58: Europe GS CMOS Image Sensor for Machine Vision Market Forecast (USD Billion), by Sub-Segment 3, 2018-2029
Figure 59: Europe GS CMOS Image Sensor for Machine Vision Market Forecast (USD Billion), by Others, 2018-2029
Figure 60: Europe GS CMOS Image Sensor for Machine Vision Market Forecast (USD Billion), by U.K., 2018-2029
Figure 61: Europe GS CMOS Image Sensor for Machine Vision Market Forecast (USD Billion), by Germany, 2018-2029
Figure 62: Europe GS CMOS Image Sensor for Machine Vision Market Forecast (USD Billion), by France, 2018-2029
Figure 63: Europe GS CMOS Image Sensor for Machine Vision Market Forecast (USD Billion), by Italy, 2018-2029
Figure 64: Europe GS CMOS Image Sensor for Machine Vision Market Forecast (USD Billion), by Spain, 2018-2029
Figure 65: Europe GS CMOS Image Sensor for Machine Vision Market Forecast (USD Billion), by Russia, 2018-2029
Figure 66: Europe GS CMOS Image Sensor for Machine Vision Market Forecast (USD Billion), by Rest of Europe, 2018-2029
Figure 67: Asia Pacific GS CMOS Image Sensor for Machine Vision Market Value Share (%), By Segment 1, 2023 & 2029
Figure 68: Asia Pacific GS CMOS Image Sensor for Machine Vision Market Forecast (USD Billion), by Sub-Segment 1, 2018-2029
Figure 69: Asia Pacific GS CMOS Image Sensor for Machine Vision Market Forecast (USD Billion), by Sub-Segment 2, 2018-2029
Figure 70: Asia Pacific GS CMOS Image Sensor for Machine Vision Market Value Share (%), By Segment 2, 2023 & 2029
Figure 71: Asia Pacific GS CMOS Image Sensor for Machine Vision Market Forecast (USD Billion), by Sub-Segment 1, 2018-2029
Figure 72: Asia Pacific GS CMOS Image Sensor for Machine Vision Market Forecast (USD Billion), by Sub-Segment 2, 2018-2029
Figure 73: Asia Pacific GS CMOS Image Sensor for Machine Vision Market Forecast (USD Billion), by Sub-Segment 3, 2018-2029
Figure 74: Asia Pacific GS CMOS Image Sensor for Machine Vision Market Forecast (USD Billion), by Others, 2018-2029
Figure 75: Asia Pacific GS CMOS Image Sensor for Machine Vision Market Value Share (%), By Segment 3, 2023 & 2029
Figure 76: Asia Pacific GS CMOS Image Sensor for Machine Vision Market Forecast (USD Billion), by Sub-Segment 1, 2018-2029
Figure 77: Asia Pacific GS CMOS Image Sensor for Machine Vision Market Forecast (USD Billion), by Sub-Segment 2, 2018-2029
Figure 78: Asia Pacific GS CMOS Image Sensor for Machine Vision Market Forecast (USD Billion), by Sub-Segment 3, 2018-2029
Figure 79: Asia Pacific GS CMOS Image Sensor for Machine Vision Market Forecast (USD Billion), by Others, 2018-2029
Figure 80: Asia Pacific GS CMOS Image Sensor for Machine Vision Market Forecast (USD Billion), by China, 2018-2029
Figure 81: Asia Pacific GS CMOS Image Sensor for Machine Vision Market Forecast (USD Billion), by India, 2018-2029
Figure 82: Asia Pacific GS CMOS Image Sensor for Machine Vision Market Forecast (USD Billion), by Japan, 2018-2029
Figure 83: Asia Pacific GS CMOS Image Sensor for Machine Vision Market Forecast (USD Billion), by Australia, 2018-2029
Figure 84: Asia Pacific GS CMOS Image Sensor for Machine Vision Market Forecast (USD Billion), by Southeast Asia, 2018-2029
Figure 85: Asia Pacific GS CMOS Image Sensor for Machine Vision Market Forecast (USD Billion), by Rest of Asia Pacific, 2018-2029
Figure 86: Middle East & Africa GS CMOS Image Sensor for Machine Vision Market Value Share (%), By Segment 1, 2023 & 2029
Figure 87: Middle East & Africa GS CMOS Image Sensor for Machine Vision Market Forecast (USD Billion), by Sub-Segment 1, 2018-2029
Figure 88: Middle East & Africa GS CMOS Image Sensor for Machine Vision Market Forecast (USD Billion), by Sub-Segment 2, 2018-2029
Figure 89: Middle East & Africa GS CMOS Image Sensor for Machine Vision Market Value Share (%), By Segment 2, 2023 & 2029
Figure 90: Middle East & Africa GS CMOS Image Sensor for Machine Vision Market Forecast (USD Billion), by Sub-Segment 1, 2018-2029
Figure 91: Middle East & Africa GS CMOS Image Sensor for Machine Vision Market Forecast (USD Billion), by Sub-Segment 2, 2018-2029
Figure 92: Middle East & Africa GS CMOS Image Sensor for Machine Vision Market Forecast (USD Billion), by Sub-Segment 3, 2018-2029
Figure 93: Middle East & Africa GS CMOS Image Sensor for Machine Vision Market Forecast (USD Billion), by Others, 2018-2029
Figure 94: Middle East & Africa GS CMOS Image Sensor for Machine Vision Market Value Share (%), By Segment 3, 2023 & 2029
Figure 95: Middle East & Africa GS CMOS Image Sensor for Machine Vision Market Forecast (USD Billion), by Sub-Segment 1, 2018-2029
Figure 96: Middle East & Africa GS CMOS Image Sensor for Machine Vision Market Forecast (USD Billion), by Sub-Segment 2, 2018-2029
Figure 97: Middle East & Africa GS CMOS Image Sensor for Machine Vision Market Forecast (USD Billion), by Sub-Segment 3, 2018-2029
Figure 98: Middle East & Africa GS CMOS Image Sensor for Machine Vision Market Forecast (USD Billion), by Others, 2018-2029
Figure 99: Middle East & Africa GS CMOS Image Sensor for Machine Vision Market Forecast (USD Billion), by GCC, 2018-2029
Figure 100: Middle East & Africa GS CMOS Image Sensor for Machine Vision Market Forecast (USD Billion), by South Africa, 2018-2029
Figure 101: Middle East & Africa GS CMOS Image Sensor for Machine Vision Market Forecast (USD Billion), by Rest of Middle East & Africa, 2018-2029
List of Tables
Table 1: Global GS CMOS Image Sensor for Machine Vision Market Revenue (USD Billion) Forecast, by Segment 1, 2018-2029
Table 2: Global GS CMOS Image Sensor for Machine Vision Market Revenue (USD Billion) Forecast, by Segment 2, 2018-2029
Table 3: Global GS CMOS Image Sensor for Machine Vision Market Revenue (USD Billion) Forecast, by Segment 3, 2018-2029
Table 4: Global GS CMOS Image Sensor for Machine Vision Market Revenue (USD Billion) Forecast, by Region, 2018-2029
Table 5: North America GS CMOS Image Sensor for Machine Vision Market Revenue (USD Billion) Forecast, by Segment 1, 2018-2029
Table 6: North America GS CMOS Image Sensor for Machine Vision Market Revenue (USD Billion) Forecast, by Segment 2, 2018-2029
Table 7: North America GS CMOS Image Sensor for Machine Vision Market Revenue (USD Billion) Forecast, by Segment 3, 2018-2029
Table 8: North America GS CMOS Image Sensor for Machine Vision Market Revenue (USD Billion) Forecast, by Country, 2018-2029
Table 9: Europe GS CMOS Image Sensor for Machine Vision Market Revenue (USD Billion) Forecast, by Segment 1, 2018-2029
Table 10: Europe GS CMOS Image Sensor for Machine Vision Market Revenue (USD Billion) Forecast, by Segment 2, 2018-2029
Table 11: Europe GS CMOS Image Sensor for Machine Vision Market Revenue (USD Billion) Forecast, by Segment 3, 2018-2029
Table 12: Europe GS CMOS Image Sensor for Machine Vision Market Revenue (USD Billion) Forecast, by Country, 2018-2029
Table 13: Latin America GS CMOS Image Sensor for Machine Vision Market Revenue (USD Billion) Forecast, by Segment 1, 2018-2029
Table 14: Latin America GS CMOS Image Sensor for Machine Vision Market Revenue (USD Billion) Forecast, by Segment 2, 2018-2029
Table 15: Latin America GS CMOS Image Sensor for Machine Vision Market Revenue (USD Billion) Forecast, by Segment 3, 2018-2029
Table 16: Latin America GS CMOS Image Sensor for Machine Vision Market Revenue (USD Billion) Forecast, by Country, 2018-2029
Table 17: Asia Pacific GS CMOS Image Sensor for Machine Vision Market Revenue (USD Billion) Forecast, by Segment 1, 2018-2029
Table 18: Asia Pacific GS CMOS Image Sensor for Machine Vision Market Revenue (USD Billion) Forecast, by Segment 2, 2018-2029
Table 19: Asia Pacific GS CMOS Image Sensor for Machine Vision Market Revenue (USD Billion) Forecast, by Segment 3, 2018-2029
Table 20: Asia Pacific GS CMOS Image Sensor for Machine Vision Market Revenue (USD Billion) Forecast, by Country, 2018-2029
Table 21: Middle East & Africa GS CMOS Image Sensor for Machine Vision Market Revenue (USD Billion) Forecast, by Segment 1, 2018-2029
Table 22: Middle East & Africa GS CMOS Image Sensor for Machine Vision Market Revenue (USD Billion) Forecast, by Segment 2, 2018-2029
Table 23: Middle East & Africa GS CMOS Image Sensor for Machine Vision Market Revenue (USD Billion) Forecast, by Segment 3, 2018-2029
Table 24: Middle East & Africa GS CMOS Image Sensor for Machine Vision Market Revenue (USD Billion) Forecast, by Country, 2018-2029
Research Process
Data Library Research are conducted by industry experts who offer insight on
industry structure, market segmentations technology assessment and competitive landscape (CL), and penetration, as well as on emerging trends. Their analysis is based on primary interviews (~ 80%) and secondary research (~ 20%) as well as years of professional expertise in their respective industries. Adding to this, by analysing historical trends and current market positions, our analysts predict where the market will be headed for the next five years. Furthermore, the varying trends of segment & categories geographically presented are also studied and the estimated based on the primary & secondary research.
In this particular report from the supply side Data Library Research has conducted primary surveys (interviews) with the key level executives (VP, CEO’s, Marketing Director, Business Development Manager
and SOFT) of the companies that active & prominent as well as the midsized organization
FIGURE 1: DLR RESEARH PROCESS
![research-methodology1]()
Primary Research
Extensive primary research was conducted to gain a deeper insight of the market and industry performance. The analysis is based on both primary and secondary research as well as years of professional expertise in the respective industries.
In addition to analysing current and historical trends, our analysts predict where the market is headed over the next five years.
It varies by segment for these categories geographically presented in the list of market tables. Speaking about this particular report we have conducted primary surveys (interviews) with the key level executives (VP, CEO’s, Marketing Director, Business Development Manager and many more) of the major players active in the market.
Secondary Research
Secondary research was mainly used to collect and identify information useful for the extensive, technical, market-oriented, and Friend’s study of the Global Extra Neutral Alcohol. It was also used to obtain key information about major players, market classification and segmentation according to the industry trends, geographical markets, and developments related to the market and technology perspectives. For this study, analysts have gathered information from various credible sources, such as annual reports, sec filings, journals, white papers, SOFT presentations, and company web sites.
Market Size Estimation
Both, top-down and bottom-up approaches were used to estimate and validate the size of the Global market and to estimate the size of various other dependent submarkets in the overall Extra Neutral Alcohol. The key players in the market were identified through secondary research and their market contributions in the respective geographies were determined through primary and secondary research.
Forecast Model
![research-methodology2]()