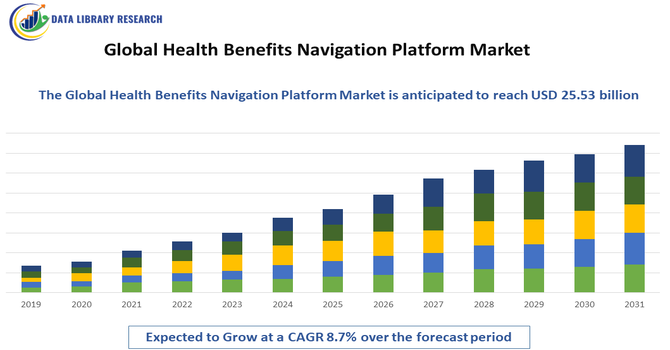
Health Benefits Navigation Platform Market Overview and Analysis:
The Global Health Benefits Navigation Platform Market was valued at USD 11.95 billion in 2025. · It is projected to reach USD 25.53 billion by 2032, growing with a CAGR of 8.7% from 2025 to 2032.
Get Complete Analysis Of The Report - Download Updated Free Sample PDF
The global health benefits navigation platform market is driven by the increasing complexity of healthcare and employee benefits systems, which necessitates intuitive digital tools that help individuals understand and manage their healthcare options more effectively. Employers and health plans are adopting these platforms to enhance employee engagement, streamline benefits communication, and improve overall productivity, as employees seek clear, personalized guidance on healthcare and insurance benefits. Additionally, the rising integration of advanced technologies such as artificial intelligence, cloud-based solutions, and mobile accessibility enables real-time, tailored support that simplifies benefits navigation, fostering wider adoption across organizations of all sizes and regions.
Health Benefits Navigation Platform Market Latest Trends:
The global health benefits navigation platform market is experiencing several key trends centered around advanced technology integration and enhanced user engagement. A major trend is the increasing adoption of artificial intelligence (AI) and machine learning to deliver personalized recommendations, real-time support, and predictive analytics that help users better understand and optimize their health benefits. Additionally, strategic partnerships between navigation solution providers and healthcare or benefits stakeholders are expanding feature sets, while interoperability with electronic health records (EHRs) and other systems is becoming more prevalent to provide seamless, data-driven guidance and care coordination.
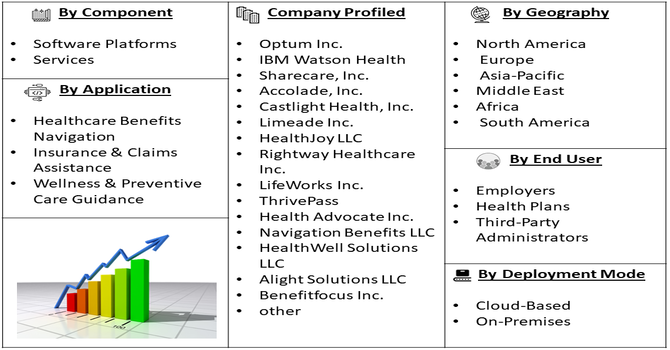
Segmentation: Global Health Benefits Navigation Platform Market is segmented By Component (Software Platforms, Services), By Deployment Mode (Cloud-Based, On-Premises), End-User (Employers, Health Plans, Third-Party Administrators), Application (Healthcare Benefits Navigation, Insurance & Claims Assistance, Wellness & Preventive Care Guidance), and Geography (North America, Europe, Asia-Pacific, Middle East and Africa, and South America). The report provides the value (in USD million) for the above segments.
For Detailed Market Segmentation - Get a Free Sample PDF
Market Drivers:
- Rising Complexity of Healthcare and Employee Benefits Systems
The primary drivers of the global health benefits navigation platform market is the growing complexity of healthcare plans, insurance policies, and employee benefit programs. Employees often face difficulty understanding various coverage options, eligibility criteria, and claims processes. Organizations and insurers are adopting navigation platforms to simplify these processes, providing personalized guidance and decision support. These platforms enable employees to make informed choices regarding their healthcare benefits, reduce confusion, and optimize utilization of available services. The increasing need for transparency and efficiency in benefits administration drives widespread adoption of such platforms across industries.
- Integration of Advanced Technologies and Personalized Solutions
Another key driver is the integration of advanced technologies such as artificial intelligence (AI), machine learning (ML), and cloud computing into health benefits navigation platforms. AI-powered tools can analyze user data to deliver personalized recommendations, predictive insights, and real-time support, enhancing user experience and engagement.
In March 2023, Fujitsu launched a cloud-based health data platform that automates medical data conversion to HL7 FHIR standards, enabling secure data aggregation. This innovation advanced personalized healthcare and drug discovery, accelerating the integration of advanced technologies and strengthening growth in the Global Health Benefits Navigation Platform Market. These technological advancements empower employers, health plans, and third-party administrators to offer tailored, data-driven solutions, thereby accelerating market growth globally.
Market Restraints:
- Data Privacy and Security Concern
A major restraint for the health benefits navigation platform market is the growing concern around data privacy and security. These platforms process sensitive personal health information (PHI) and employee data, which makes them vulnerable to cyberattacks, data breaches, and unauthorized access. Strict regulations such as HIPAA in the U.S. and GDPR in Europe require organizations to ensure robust security and compliance, increasing implementation costs and operational complexity. Organizations hesitant to adopt digital platforms due to potential legal liabilities or reputational risks may slow market growth despite the benefits of navigation solutions.
Socioeconomic Impact on Health Benefits Navigation Platform Market
The Global Health Benefits Navigation Platform Market significantly impacts socioeconomic factors by improving access to healthcare information, simplifying benefits management, and reducing administrative burdens for both providers and patients. These platforms enhance patient engagement and satisfaction by offering personalized guidance on insurance coverage, eligibility, and care options. Increased efficiency in navigating complex healthcare systems leads to cost savings for employers, insurers, and individuals, while promoting timely access to necessary treatments. Market growth drives employment in health tech development, data analytics, and customer support sectors. Furthermore, widespread adoption supports health equity by helping underserved populations better understand and utilize available benefits, contributing to improved public health outcomes globally.
Segmental Analysis:
- Software Platforms segment is expected to witness the highest growth over the forecast period
Software platforms form the core of health benefits navigation solutions, providing digital tools that enable employees to access, understand, and manage their healthcare and insurance benefits. These platforms typically include dashboards, decision-support engines, AI-powered recommendations, and reporting tools for employers. By offering personalized guidance, they improve employee engagement, reduce administrative burden, and optimize benefits utilization. The growing need for real-time, automated, and user-friendly interfaces drives significant adoption of software platforms over service-only solutions.
- The cloud-based segment is expected to witness the highest growth over the forecast period
Cloud-based deployment is increasingly preferred due to its scalability, cost-effectiveness, and ease of access. Organizations can deploy cloud-hosted health benefits platforms without extensive local IT infrastructure, enabling remote access from multiple devices and locations. Cloud solutions support continuous updates, seamless integration with HR and payroll systems, and data analytics capabilities, making them more efficient and flexible than on-premises deployments. The increasing reliance on cloud computing in corporate digital transformation initiatives fuels growth in this segment.
- The employers segment is expected to witness the highest growth over the forecast period
Employers are the primary end-users of health benefits navigation platforms, leveraging these tools to manage employee healthcare and benefits programs efficiently. These platforms help employers reduce administrative overhead, improve benefits communication, and enhance employee satisfaction by providing clear, personalized guidance on medical coverage, claims processes, and wellness programs. Large organizations and multinational corporations are increasingly adopting these solutions to simplify benefits administration and drive workforce engagement.
- Healthcare Benefits Navigation segment is expected to witness the highest growth over the forecast period
Healthcare benefits navigation is a key application, enabling employees to make informed decisions regarding medical, dental, vision, and other healthcare services. The platform guides users through plan selection, eligibility verification, provider directories, and cost comparison tools. By improving clarity and reducing confusion, it enhances user experience, increases benefits utilization, and supports preventive care initiatives, making it a critical application area driving platform adoption.
- North America segment is expected to witness the highest growth over the forecast period
North America dominates the health benefits navigation platform market due to advanced digital health infrastructure, high healthcare expenditure, and widespread employer-sponsored benefits programs. The presence of major technology providers and growing awareness of employee wellness initiatives contribute to strong adoption. For instance, In February 2024, Healix launched Healix ConneX, a digital healthcare solution tailored for small and medium enterprises (SMEs). The service provides three care levels, with the Lite package featuring a virtual 24/7 GP service and mental health assessments. Higher-tier plans include added benefits like a well-being platform, cancer care support, and discounts at MyGym.
Similarly, In March 2023, Transcarent, a care and health service provider, acquired 98point6, an AI-driven virtual care platform and on-demand primary care business. This acquisition aimed to give Transcarent access to advanced AI-powered virtual care technology, enhancing its ability to deliver high-quality, on-demand healthcare through a skilled affiliated medical group.
Thus, the regulatory support, coupled with the prevalence of complex insurance plans, reinforces the demand for intuitive, AI-powered platforms, positioning North America as the leading regional market.
| Report Matrics |
Details |
| Market Size Value |
USD 25.53 billion |
| Growth Rate |
CAGR of 8.7 % |
| Forecast |
2026-2033 |
| Historical data |
2021-2024 |
| Base Year |
2025 |
| Report Coverage |
Forecasted revenue, company rating, competitive environment, growth drivers, and trends |
| Segment Coverage |
Type, Application, End-User, Geography |
| Regional Scope |
North America, Europe, Asia Pacific, Middle East |
| Customized scope |
Free customization of reports (With 3 months' analysis support) |
| To Learn More About This Report |
Request a Free Sample Copy |
Health Benefits Navigation Platform Market Competitive Landscape:
The competitive landscape of the global health benefits navigation platform market is increasingly dynamic, with a broad mix of established healthcare technology firms and specialized benefits navigation providers striving to enhance their offerings through innovation, partnerships, and expanded service portfolios. Companies in this space focus on delivering intuitive, AI enabled platforms that simplify complex benefits information, support personalized guidance, and improve user engagement for employers, health plans, and individuals. As demand for streamlined benefits navigation grows—driven by complex healthcare systems and rising employee expectations—market players are investing in advanced analytics, mobile accessibility, and integrated solutions to differentiate themselves, foster deeper client relationships, and expand their global footprint.
Key Companies in the Market:
- Optum Inc.
- IBM Watson Health
- Sharecare, Inc.
- Accolade, Inc.
- Castlight Health, Inc.
- Limeade Inc.
- HealthJoy LLC
- Rightway Healthcare Inc.
- LifeWorks Inc.
- ThrivePass
- Health Advocate Inc.
- Navigation Benefits LLC
- HealthWell Solutions LLC
- Alight Solutions LLC
- Benefitfocus Inc.
- HealthEquity
- Discovery Benefits
- ConnectYourCare
- PayFlex
- Fidelity Investments
Recent News
- In October 2025, Nava Benefits launched HQ, the first AI-powered benefits platform designed to streamline HR workflows, unify quoting, benchmarking, and demographic insights, and provide instant answers to employee benefits queries. Supported by a USD 30M Series C funding round led by Thrive Capital, this innovation enhanced efficiency, accessibility, and personalization, driving growth in the Global Health Benefits Navigation Platform Market.
- In June 2025, Healthee launched its redesigned platform, simplifying employee engagement with health benefits through an intuitive interface. By offering smarter navigation, streamlined communication, and integrated wellness support, the platform enhanced user experience and accessibility. This innovation strengthened the Global Health Benefits Navigation Platform Market by driving adoption, improving benefit utilization, and promoting efficiency across corporate healthcare management.
Frequently Asked Questions (FAQ) :
Q1. What are the main growth-driving factors for this market?
The market is growing because healthcare plans have become incredibly confusing for the average employee to understand. Companies are adopting these platforms to help staff find the right doctors, compare costs, and maximize their benefits. This reduces HR workloads and keeps employees healthier by ensuring they use the services already available to them.
Q2. What are the main restraining factors for this market?
Growth is limited by the high cost of implementing these platforms for smaller businesses and concerns over the privacy of sensitive medical data. Some employees are also hesitant to use digital tools for personal health matters, preferring traditional human support. Additionally, integrating these platforms with old, complex insurance systems can be technically difficult.
Q3. Which segment is expected to witness high growth?
The Personalized Care Guidance segment is expected to see the highest growth. These tools use artificial intelligence to give employees specific recommendations based on their health history. Because they help users avoid unnecessary procedures and find high-quality, lower-cost specialists, they provide a clear return on investment for companies trying to save money.
Q4. Who are the top major players for this market?
The market is led by innovative tech firms that specialize in "health-tech" and employee wellness. Key players include Accolade, Quantum Health, Castlight Health, Included Health, and Sharecare. These companies dominate by offering mobile apps that act as a single "front door" for all of an employee’s healthcare and insurance needs.
Q5. Which country is the largest player?
The United States is the largest player in this market. This is because the U.S. has a unique, employer-based health insurance system that is famously complex and expensive. American companies spend more than any other country on private health benefits, making these navigation tools essential for controlling costs and keeping workers happy.
List of Figures
Figure 1: Global Health Benefits Navigation Platform Market Revenue Breakdown (USD Billion, %) by Region, 2022 & 2029
Figure 2: Global Health Benefits Navigation Platform Market Value Share (%), By Segment 1, 2022 & 2029
Figure 3: Global Health Benefits Navigation Platform Market Forecast (USD Billion), by Sub-Segment 1, 2018-2029
Figure 4: Global Health Benefits Navigation Platform Market Forecast (USD Billion), by Sub-Segment 2, 2018-2029
Figure 5: Global Health Benefits Navigation Platform Market Value Share (%), By Segment 2, 2022 & 2029
Figure 6: Global Health Benefits Navigation Platform Market Forecast (USD Billion), by Sub-Segment 1, 2018-2029
Figure 7: Global Health Benefits Navigation Platform Market Forecast (USD Billion), by Sub-Segment 2, 2018-2029
Figure 8: Global Health Benefits Navigation Platform Market Forecast (USD Billion), by Sub-Segment 3, 2018-2029
Figure 9: Global Health Benefits Navigation Platform Market Forecast (USD Billion), by Others, 2018-2029
Figure 10: Global Health Benefits Navigation Platform Market Value Share (%), By Segment 3, 2022 & 2029
Figure 11: Global Health Benefits Navigation Platform Market Forecast (USD Billion), by Sub-Segment 1, 2018-2029
Figure 12: Global Health Benefits Navigation Platform Market Forecast (USD Billion), by Sub-Segment 2, 2018-2029
Figure 13: Global Health Benefits Navigation Platform Market Forecast (USD Billion), by Sub-Segment 3, 2018-2029
Figure 14: Global Health Benefits Navigation Platform Market Forecast (USD Billion), by Others, 2018-2029
Figure 15: Global Health Benefits Navigation Platform Market Value (USD Billion), by Region, 2022 & 2029
Figure 16: North America Health Benefits Navigation Platform Market Value Share (%), By Segment 1, 2022 & 2029
Figure 17: North America Health Benefits Navigation Platform Market Forecast (USD Billion), by Sub-Segment 1, 2018-2029
Figure 18: North America Health Benefits Navigation Platform Market Forecast (USD Billion), by Sub-Segment 2, 2018-2029
Figure 19: North America Health Benefits Navigation Platform Market Value Share (%), By Segment 2, 2022 & 2029
Figure 20: North America Health Benefits Navigation Platform Market Forecast (USD Billion), by Sub-Segment 1, 2018-2029
Figure 21: North America Health Benefits Navigation Platform Market Forecast (USD Billion), by Sub-Segment 2, 2018-2029
Figure 22: North America Health Benefits Navigation Platform Market Forecast (USD Billion), by Sub-Segment 3, 2018-2029
Figure 23: North America Health Benefits Navigation Platform Market Forecast (USD Billion), by Others, 2018-2029
Figure 24: North America Health Benefits Navigation Platform Market Value Share (%), By Segment 3, 2022 & 2029
Figure 25: North America Health Benefits Navigation Platform Market Forecast (USD Billion), by Sub-Segment 1, 2018-2029
Figure 26: North America Health Benefits Navigation Platform Market Forecast (USD Billion), by Sub-Segment 2, 2018-2029
Figure 27: North America Health Benefits Navigation Platform Market Forecast (USD Billion), by Sub-Segment 3, 2018-2029
Figure 28: North America Health Benefits Navigation Platform Market Forecast (USD Billion), by Others, 2018-2029
Figure 29: North America Health Benefits Navigation Platform Market Forecast (USD Billion), by U.S., 2018-2029
Figure 30: North America Health Benefits Navigation Platform Market Forecast (USD Billion), by Canada, 2018-2029
Figure 31: Latin America Health Benefits Navigation Platform Market Value Share (%), By Segment 1, 2022 & 2029
Figure 32: Latin America Health Benefits Navigation Platform Market Forecast (USD Billion), by Sub-Segment 1, 2018-2029
Figure 33: Latin America Health Benefits Navigation Platform Market Forecast (USD Billion), by Sub-Segment 2, 2018-2029
Figure 34: Latin America Health Benefits Navigation Platform Market Value Share (%), By Segment 2, 2022 & 2029
Figure 35: Latin America Health Benefits Navigation Platform Market Forecast (USD Billion), by Sub-Segment 1, 2018-2029
Figure 36: Latin America Health Benefits Navigation Platform Market Forecast (USD Billion), by Sub-Segment 2, 2018-2029
Figure 37: Latin America Health Benefits Navigation Platform Market Forecast (USD Billion), by Sub-Segment 3, 2018-2029
Figure 38: Latin America Health Benefits Navigation Platform Market Forecast (USD Billion), by Others, 2018-2029
Figure 39: Latin America Health Benefits Navigation Platform Market Value Share (%), By Segment 3, 2022 & 2029
Figure 40: Latin America Health Benefits Navigation Platform Market Forecast (USD Billion), by Sub-Segment 1, 2018-2029
Figure 41: Latin America Health Benefits Navigation Platform Market Forecast (USD Billion), by Sub-Segment 2, 2018-2029
Figure 42: Latin America Health Benefits Navigation Platform Market Forecast (USD Billion), by Sub-Segment 3, 2018-2029
Figure 43: Latin America Health Benefits Navigation Platform Market Forecast (USD Billion), by Others, 2018-2029
Figure 44: Latin America Health Benefits Navigation Platform Market Forecast (USD Billion), by Brazil, 2018-2029
Figure 45: Latin America Health Benefits Navigation Platform Market Forecast (USD Billion), by Mexico, 2018-2029
Figure 46: Latin America Health Benefits Navigation Platform Market Forecast (USD Billion), by Rest of Latin America, 2018-2029
Figure 47: Europe Health Benefits Navigation Platform Market Value Share (%), By Segment 1, 2022 & 2029
Figure 48: Europe Health Benefits Navigation Platform Market Forecast (USD Billion), by Sub-Segment 1, 2018-2029
Figure 49: Europe Health Benefits Navigation Platform Market Forecast (USD Billion), by Sub-Segment 2, 2018-2029
Figure 50: Europe Health Benefits Navigation Platform Market Value Share (%), By Segment 2, 2022 & 2029
Figure 51: Europe Health Benefits Navigation Platform Market Forecast (USD Billion), by Sub-Segment 1, 2018-2029
Figure 52: Europe Health Benefits Navigation Platform Market Forecast (USD Billion), by Sub-Segment 2, 2018-2029
Figure 53: Europe Health Benefits Navigation Platform Market Forecast (USD Billion), by Sub-Segment 3, 2018-2029
Figure 54: Europe Health Benefits Navigation Platform Market Forecast (USD Billion), by Others, 2018-2029
Figure 55: Europe Health Benefits Navigation Platform Market Value Share (%), By Segment 3, 2022 & 2029
Figure 56: Europe Health Benefits Navigation Platform Market Forecast (USD Billion), by Sub-Segment 1, 2018-2029
Figure 57: Europe Health Benefits Navigation Platform Market Forecast (USD Billion), by Sub-Segment 2, 2018-2029
Figure 58: Europe Health Benefits Navigation Platform Market Forecast (USD Billion), by Sub-Segment 3, 2018-2029
Figure 59: Europe Health Benefits Navigation Platform Market Forecast (USD Billion), by Others, 2018-2029
Figure 60: Europe Health Benefits Navigation Platform Market Forecast (USD Billion), by U.K., 2018-2029
Figure 61: Europe Health Benefits Navigation Platform Market Forecast (USD Billion), by Germany, 2018-2029
Figure 62: Europe Health Benefits Navigation Platform Market Forecast (USD Billion), by France, 2018-2029
Figure 63: Europe Health Benefits Navigation Platform Market Forecast (USD Billion), by Italy, 2018-2029
Figure 64: Europe Health Benefits Navigation Platform Market Forecast (USD Billion), by Spain, 2018-2029
Figure 65: Europe Health Benefits Navigation Platform Market Forecast (USD Billion), by Russia, 2018-2029
Figure 66: Europe Health Benefits Navigation Platform Market Forecast (USD Billion), by Rest of Europe, 2018-2029
Figure 67: Asia Pacific Health Benefits Navigation Platform Market Value Share (%), By Segment 1, 2022 & 2029
Figure 68: Asia Pacific Health Benefits Navigation Platform Market Forecast (USD Billion), by Sub-Segment 1, 2018-2029
Figure 69: Asia Pacific Health Benefits Navigation Platform Market Forecast (USD Billion), by Sub-Segment 2, 2018-2029
Figure 70: Asia Pacific Health Benefits Navigation Platform Market Value Share (%), By Segment 2, 2022 & 2029
Figure 71: Asia Pacific Health Benefits Navigation Platform Market Forecast (USD Billion), by Sub-Segment 1, 2018-2029
Figure 72: Asia Pacific Health Benefits Navigation Platform Market Forecast (USD Billion), by Sub-Segment 2, 2018-2029
Figure 73: Asia Pacific Health Benefits Navigation Platform Market Forecast (USD Billion), by Sub-Segment 3, 2018-2029
Figure 74: Asia Pacific Health Benefits Navigation Platform Market Forecast (USD Billion), by Others, 2018-2029
Figure 75: Asia Pacific Health Benefits Navigation Platform Market Value Share (%), By Segment 3, 2022 & 2029
Figure 76: Asia Pacific Health Benefits Navigation Platform Market Forecast (USD Billion), by Sub-Segment 1, 2018-2029
Figure 77: Asia Pacific Health Benefits Navigation Platform Market Forecast (USD Billion), by Sub-Segment 2, 2018-2029
Figure 78: Asia Pacific Health Benefits Navigation Platform Market Forecast (USD Billion), by Sub-Segment 3, 2018-2029
Figure 79: Asia Pacific Health Benefits Navigation Platform Market Forecast (USD Billion), by Others, 2018-2029
Figure 80: Asia Pacific Health Benefits Navigation Platform Market Forecast (USD Billion), by China, 2018-2029
Figure 81: Asia Pacific Health Benefits Navigation Platform Market Forecast (USD Billion), by India, 2018-2029
Figure 82: Asia Pacific Health Benefits Navigation Platform Market Forecast (USD Billion), by Japan, 2018-2029
Figure 83: Asia Pacific Health Benefits Navigation Platform Market Forecast (USD Billion), by Australia, 2018-2029
Figure 84: Asia Pacific Health Benefits Navigation Platform Market Forecast (USD Billion), by Southeast Asia, 2018-2029
Figure 85: Asia Pacific Health Benefits Navigation Platform Market Forecast (USD Billion), by Rest of Asia Pacific, 2018-2029
Figure 86: Middle East & Africa Health Benefits Navigation Platform Market Value Share (%), By Segment 1, 2022 & 2029
Figure 87: Middle East & Africa Health Benefits Navigation Platform Market Forecast (USD Billion), by Sub-Segment 1, 2018-2029
Figure 88: Middle East & Africa Health Benefits Navigation Platform Market Forecast (USD Billion), by Sub-Segment 2, 2018-2029
Figure 89: Middle East & Africa Health Benefits Navigation Platform Market Value Share (%), By Segment 2, 2022 & 2029
Figure 90: Middle East & Africa Health Benefits Navigation Platform Market Forecast (USD Billion), by Sub-Segment 1, 2018-2029
Figure 91: Middle East & Africa Health Benefits Navigation Platform Market Forecast (USD Billion), by Sub-Segment 2, 2018-2029
Figure 92: Middle East & Africa Health Benefits Navigation Platform Market Forecast (USD Billion), by Sub-Segment 3, 2018-2029
Figure 93: Middle East & Africa Health Benefits Navigation Platform Market Forecast (USD Billion), by Others, 2018-2029
Figure 94: Middle East & Africa Health Benefits Navigation Platform Market Value Share (%), By Segment 3, 2022 & 2029
Figure 95: Middle East & Africa Health Benefits Navigation Platform Market Forecast (USD Billion), by Sub-Segment 1, 2018-2029
Figure 96: Middle East & Africa Health Benefits Navigation Platform Market Forecast (USD Billion), by Sub-Segment 2, 2018-2029
Figure 97: Middle East & Africa Health Benefits Navigation Platform Market Forecast (USD Billion), by Sub-Segment 3, 2018-2029
Figure 98: Middle East & Africa Health Benefits Navigation Platform Market Forecast (USD Billion), by Others, 2018-2029
Figure 99: Middle East & Africa Health Benefits Navigation Platform Market Forecast (USD Billion), by GCC, 2018-2029
Figure 100: Middle East & Africa Health Benefits Navigation Platform Market Forecast (USD Billion), by South Africa, 2018-2029
Figure 101: Middle East & Africa Health Benefits Navigation Platform Market Forecast (USD Billion), by Rest of Middle East & Africa, 2018-2029
List of Tables
Table 1: Global Health Benefits Navigation Platform Market Revenue (USD Billion) Forecast, by Segment 1, 2018-2029
Table 2: Global Health Benefits Navigation Platform Market Revenue (USD Billion) Forecast, by Segment 2, 2018-2029
Table 3: Global Health Benefits Navigation Platform Market Revenue (USD Billion) Forecast, by Segment 3, 2018-2029
Table 4: Global Health Benefits Navigation Platform Market Revenue (USD Billion) Forecast, by Region, 2018-2029
Table 5: North America Health Benefits Navigation Platform Market Revenue (USD Billion) Forecast, by Segment 1, 2018-2029
Table 6: North America Health Benefits Navigation Platform Market Revenue (USD Billion) Forecast, by Segment 2, 2018-2029
Table 7: North America Health Benefits Navigation Platform Market Revenue (USD Billion) Forecast, by Segment 3, 2018-2029
Table 8: North America Health Benefits Navigation Platform Market Revenue (USD Billion) Forecast, by Country, 2018-2029
Table 9: Europe Health Benefits Navigation Platform Market Revenue (USD Billion) Forecast, by Segment 1, 2018-2029
Table 10: Europe Health Benefits Navigation Platform Market Revenue (USD Billion) Forecast, by Segment 2, 2018-2029
Table 11: Europe Health Benefits Navigation Platform Market Revenue (USD Billion) Forecast, by Segment 3, 2018-2029
Table 12: Europe Health Benefits Navigation Platform Market Revenue (USD Billion) Forecast, by Country, 2018-2029
Table 13: Latin America Health Benefits Navigation Platform Market Revenue (USD Billion) Forecast, by Segment 1, 2018-2029
Table 14: Latin America Health Benefits Navigation Platform Market Revenue (USD Billion) Forecast, by Segment 2, 2018-2029
Table 15: Latin America Health Benefits Navigation Platform Market Revenue (USD Billion) Forecast, by Segment 3, 2018-2029
Table 16: Latin America Health Benefits Navigation Platform Market Revenue (USD Billion) Forecast, by Country, 2018-2029
Table 17: Asia Pacific Health Benefits Navigation Platform Market Revenue (USD Billion) Forecast, by Segment 1, 2018-2029
Table 18: Asia Pacific Health Benefits Navigation Platform Market Revenue (USD Billion) Forecast, by Segment 2, 2018-2029
Table 19: Asia Pacific Health Benefits Navigation Platform Market Revenue (USD Billion) Forecast, by Segment 3, 2018-2029
Table 20: Asia Pacific Health Benefits Navigation Platform Market Revenue (USD Billion) Forecast, by Country, 2018-2029
Table 21: Middle East & Africa Health Benefits Navigation Platform Market Revenue (USD Billion) Forecast, by Segment 1, 2018-2029
Table 22: Middle East & Africa Health Benefits Navigation Platform Market Revenue (USD Billion) Forecast, by Segment 2, 2018-2029
Table 23: Middle East & Africa Health Benefits Navigation Platform Market Revenue (USD Billion) Forecast, by Segment 3, 2018-2029
Table 24: Middle East & Africa Health Benefits Navigation Platform Market Revenue (USD Billion) Forecast, by Country, 2018-2029
Research Process
Data Library Research are conducted by industry experts who offer insight on
industry structure, market segmentations technology assessment and competitive landscape (CL), and penetration, as well as on emerging trends. Their analysis is based on primary interviews (~ 80%) and secondary research (~ 20%) as well as years of professional expertise in their respective industries. Adding to this, by analysing historical trends and current market positions, our analysts predict where the market will be headed for the next five years. Furthermore, the varying trends of segment & categories geographically presented are also studied and the estimated based on the primary & secondary research.
In this particular report from the supply side Data Library Research has conducted primary surveys (interviews) with the key level executives (VP, CEO’s, Marketing Director, Business Development Manager
and SOFT) of the companies that active & prominent as well as the midsized organization
FIGURE 1: DLR RESEARH PROCESS
![research-methodology1]()
Primary Research
Extensive primary research was conducted to gain a deeper insight of the market and industry performance. The analysis is based on both primary and secondary research as well as years of professional expertise in the respective industries.
In addition to analysing current and historical trends, our analysts predict where the market is headed over the next five years.
It varies by segment for these categories geographically presented in the list of market tables. Speaking about this particular report we have conducted primary surveys (interviews) with the key level executives (VP, CEO’s, Marketing Director, Business Development Manager and many more) of the major players active in the market.
Secondary Research
Secondary research was mainly used to collect and identify information useful for the extensive, technical, market-oriented, and Friend’s study of the Global Extra Neutral Alcohol. It was also used to obtain key information about major players, market classification and segmentation according to the industry trends, geographical markets, and developments related to the market and technology perspectives. For this study, analysts have gathered information from various credible sources, such as annual reports, sec filings, journals, white papers, SOFT presentations, and company web sites.
Market Size Estimation
Both, top-down and bottom-up approaches were used to estimate and validate the size of the Global market and to estimate the size of various other dependent submarkets in the overall Extra Neutral Alcohol. The key players in the market were identified through secondary research and their market contributions in the respective geographies were determined through primary and secondary research.
Forecast Model
![research-methodology2]()