Hybrid Wet-dry Cooling Tower Market Overview and Analysis:
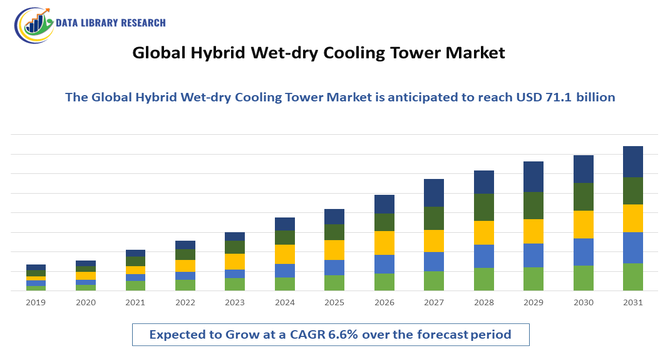
The Global Hybrid Wet-Dry Cooling Tower Market size was USD 41.4 billion in 2025 and is projected to reach USD 71.1 billion by 2032, growing at a CAGR of 6.6% from 2025 to 2032.
Get Complete Analysis Of The Report - Download Updated Free Sample PDF
The growth of the Global Hybrid Wet-Dry Cooling Tower Market is primarily driven by the increasing demand for energy-efficient and water-conserving cooling solutions across industrial, commercial, and power generation sectors. Hybrid wet-dry cooling towers combine the advantages of both wet and dry systems, offering reduced water consumption, lower environmental impact, and enhanced thermal performance, making them suitable for regions facing water scarcity and stringent environmental regulations. Additionally, the rising adoption of sustainable and green technologies, industrial process optimization, and stringent emission norms is accelerating the deployment of hybrid cooling towers globally, fueling market growth over the forecast period.
Hybrid Wet-dry Cooling Tower Market Latest Trends:
The Global Hybrid Wet-Dry Cooling Tower Market is witnessing several key trends driven by sustainability and technological innovation. There is a growing adoption of advanced hybrid designs that optimize water and energy usage while minimizing environmental impact. Integration of smart monitoring systems, IoT-enabled sensors, and automation technologies allows for real-time performance tracking, predictive maintenance, and improved operational efficiency. Additionally, industries are increasingly implementing low-noise and corrosion-resistant materials, as well as modular and compact designs for space-constrained installations. The push toward green building practices, carbon footprint reduction, and water conservation is further shaping market trends globally.
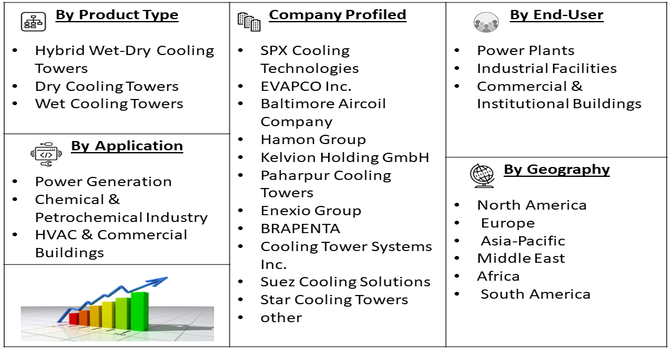
Segmentation: Global Hybrid Wet-dry Cooling Tower Market is segmented By Cooling Type (Hybrid Wet-Dry Cooling Towers, Dry Cooling Towers, Wet Cooling Towers), Tower Size / Capacity (Below 1,000 Tons, 1,000 to 5,000 Tons, Above 5,000 Tons), Application (Power Generation, Chemical & Petrochemical Industry, HVAC & Commercial Buildings), End-User (Power Plants, Industrial Facilities, Commercial & Institutional Buildings), and Geography (North America, Europe, Asia-Pacific, Middle East and Africa, and South America). The report provides the value (in USD million) for the above segments.
For Detailed Market Segmentation - Get a Free Sample PDF
Market Drivers:
- Increasing Focus on Water and Energy Conservation
A major driver for the hybrid wet-dry cooling tower market is the rising emphasis on sustainable water and energy usage in industrial and commercial operations. Hybrid systems combine wet and dry cooling technologies to significantly reduce water consumption compared to conventional wet cooling towers, while maintaining high thermal efficiency. This is especially critical in regions facing water scarcity or stringent regulations on water usage. Moreover, these systems help lower energy costs by optimizing cooling performance, making them attractive for power plants, industrial facilities, and HVAC applications seeking sustainable and cost-efficient solutions.
- Adoption Driven by Environmental and Regulatory Compliance
Environmental concerns and stringent government regulations are driving the adoption of hybrid wet-dry cooling towers. Industries are under increasing pressure to reduce water discharge, minimize thermal pollution, and lower carbon footprints. Hybrid cooling towers allow for controlled water usage and reduced chemical treatment, aligning with environmental standards and sustainability initiatives. Regulatory frameworks in regions like North America, Europe, and parts of Asia-Pacific mandate energy-efficient and eco-friendly cooling technologies, encouraging companies to retrofit or install hybrid systems to ensure compliance while improving operational efficiency.
Market Restraints:
- High Initial Capital Investment
A significant restraint for the hybrid wet-dry cooling tower market is the high upfront cost of installation and commissioning. Compared to conventional wet or dry cooling systems, hybrid towers require advanced materials, sophisticated design, and integration of both wet and dry cooling technologies, which increases capital expenditure. Small and medium-scale industries, particularly in developing regions, may find it financially challenging to adopt hybrid systems, despite long-term operational and water-saving benefits. This high initial investment can slow market penetration, especially where cost-sensitive solutions are preferred.
Socioeconomic Impact on Hybrid Wet-Dry Cooling Tower Market
The global hybrid wet-dry cooling tower market has had significant socioeconomic impacts by improving energy efficiency, reducing water consumption, and minimizing environmental pollution in industrial and power generation sectors. Adoption of hybrid cooling technology has lowered operational costs, increased productivity, and supported sustainable industrial practices, contributing to economic growth. The market has created employment opportunities in manufacturing, engineering, installation, and maintenance services while driving technological innovation in cooling and thermal management systems. Enhanced efficiency and reduced environmental footprint have promoted regulatory compliance and public health benefits. Overall, the market has supported industrial modernization, resource conservation, and sustainable development, positively affecting both economies and communities worldwide.
Segmental Analysis
- Hybrid Wet-Dry Cooling Towers segment is expected to witness highest growth over the forecast period
Hybrid wet-dry cooling towers are gaining strong adoption due to their ability to balance water conservation and cooling efficiency. These systems combine dry cooling during low-load or cooler conditions with wet cooling during peak demand, significantly reducing overall water usage. Their flexibility makes them highly suitable for industries operating in water-stressed regions and for facilities required to comply with strict environmental regulations.
- Capacity – 1,000 to 5,000 Tons segment is expected to witness highest growth over the forecast period
Cooling towers with capacities ranging from 1,000 to 5,000 tons are widely used in medium- to large-scale industrial and commercial facilities. This capacity range offers an optimal balance between cooling performance and capital investment, making it suitable for power plants, manufacturing units, and large commercial complexes requiring reliable and continuous cooling.
- Power Generation segment is expected to witness highest growth over the forecast period
The power generation sector represents a key application area for hybrid wet-dry cooling towers. Power plants require efficient heat rejection systems to ensure operational efficiency and regulatory compliance. Hybrid cooling towers help power plants reduce water consumption and thermal discharge, making them ideal for both new installations and retrofitting existing facilities in regions with water and environmental constraints.
- Industrial Facilities segment is expected to witness highest growth over the forecast period
Industrial facilities are major end-users of hybrid wet-dry cooling towers due to their need for process cooling, energy efficiency, and sustainable operations. Industries such as chemicals, petrochemicals, and manufacturing benefit from these systems by achieving lower operational costs, reduced water dependency, and improved environmental performance, supporting long-term operational reliability.
- North America region is expected to witness highest growth over the forecast period
The North America region is expected to witness the highest growth over the forecast period, driven by the increasing adoption of energy-efficient and water-conserving cooling technologies across power generation, industrial, and commercial sectors.
Stringent environmental regulations related to water usage, thermal discharge, and emissions, along with growing investments in sustainable infrastructure and industrial modernization, are accelerating the deployment of hybrid wet-dry cooling towers. Additionally, the presence of advanced industrial facilities, strong focus on retrofit projects, and rising demand for eco-friendly cooling solutions in the U.S. and Canada are further supporting robust regional market growth. For instance, in Febraury 2025, Kioxia and SanDisk demonstrated a 332-layer die with a 4.8 Gb/s Toggle DDR 6.0 interface. The joint demonstration is intended to speed up the time-to-market for high-bandwidth flash solutions optimized for integration into advanced AI accelerator systems.
Similarly, in January 2025, New EPA TSCA amendments took effect, categorically excluding PFAS from new chemical exemptions. This regulatory change forces a rapid shift toward adopting alternative, safer fill materials and components across the entire cooling tower application industry.
Thus, such factors are driving this region’s growth over the forecast period.
| Report Matrics |
Details |
| Market Size Value |
USD 71.1 billion |
| Growth Rate |
CAGR of 6.6 % |
| Forecast |
2026-2033 |
| Historical data |
2021-2024 |
| Base Year |
2025 |
| Report Coverage |
Forecasted revenue, company rating, competitive environment, growth drivers, and trends |
| Segment Coverage |
Type, Application, End-User, Geography |
| Regional Scope |
North America, Europe, Asia Pacific, Middle East |
| Customized scope |
Free customization of reports (With 3 months' analysis support) |
| To Learn More About This Report |
Request a Free Sample Copy |
Hybrid Wet-dry Cooling Tower Market Competitive Landscape
The competitive landscape of the Global Hybrid Wet-dry Cooling Tower Market is characterized by the presence of established cooling tower manufacturers and specialized thermal management solution providers competing on technology innovation, energy efficiency, water conservation capabilities, and system reliability. Companies are increasingly focusing on advanced hybrid designs, use of corrosion-resistant materials, and integration of smart monitoring and control systems to strengthen their market position. Strategic initiatives such as capacity expansions, partnerships, and retrofit solutions for existing industrial and power facilities are intensifying competition. Growing demand for sustainable and regulation-compliant cooling solutions continues to drive competitive dynamics globally.
Key Players:
- SPX Cooling Technologies
- EVAPCO Inc.
- Baltimore Aircoil Company
- Hamon Group
- Kelvion Holding GmbH
- Paharpur Cooling Towers
- Enexio Group
- Johnson Controls
- Thermax Limited
- MITA Cooling Technologies
- Babcock & Wilcox Enterprises
- Liang Chi Industry Co., Ltd.
- BRAPENTA
- Cooling Tower Systems Inc.
- Suez Cooling Solutions
- Star Cooling Towers
- Shandong Longtaida
- Delta Cooling Towers
- Laxmi Cooling Towers
- Eurocoil
Recent News
- In June 2025, Kioxia launched its CD9P Series PCIe 5.0 NVMe SSDs built on 8th-gen BiCS FLASH. The new drives double capacity to 61.44 TB and boost sequential reads by 60% per watt. This advancement is tailored specifically for use in high-density GPU-based AI servers.
- In February 2025, Samsung unveiled its 10th-gen V-NAND, featuring over 400 layers and hybrid bonding technology running at 5.6 GT/s. This move aims to future-proof their flash memory for next-generation PCIe 6.0 SSDs and maintain their leading position in the premium NAND flash market.
Frequently Asked Questions (FAQ) :
Q1. What are the main growth-driving factors for this market?
The primary driver is the increasing demand for water conservation in industrial processes, driven by global water scarcity and stricter environmental regulations. Hybrid towers, by combining wet and dry cooling, significantly reduce water consumption and eliminate visible plumes, making them essential for sustainable operations, especially in water-stressed regions.
Q2. What are the main restraining factors for this market?
The most significant restraint is the high initial investment cost associated with the complex design of hybrid systems compared to conventional wet towers. Furthermore, the specialized expertise required for the installation, operation, and maintenance of integrated wet and dry components can also pose a technical barrier for some industries.
Q3. Which segment is expected to witness high growth?
The Hybrid Cooling Towers segment itself is expected to register the fastest growth rate among all cooling tower types (wet, dry, hybrid). This rapid adoption is driven by their operational flexibility, allowing industries like power generation and data centers to optimize energy efficiency while complying with water usage constraints.
Q4. Who are the top major players for this market?
The market features several key global players focused on advanced cooling solutions. Top companies include SPX Corporation, Baltimore Aircoil Company (BAC), EVAPCO Inc., Johnson Controls International Plc., and Babcock & Wilcox Enterprises Inc. These firms lead in developing complex hybrid and customized cooling systems.
Q5. Which country is the largest player?
United States, is the largest market player due to intense industrialization and rapid infrastructure expansion. Substantial investments in power generation, manufacturing, and the construction of new data centers in these countries fuel the dominant demand for efficient cooling solutions.
List of Figures
Figure 1: Global Hybrid Wet-dry Cooling Tower Market Revenue Breakdown (USD Billion, %) by Region, 2022 & 2029
Figure 2: Global Hybrid Wet-dry Cooling Tower Market Value Share (%), By Segment 1, 2022 & 2029
Figure 3: Global Hybrid Wet-dry Cooling Tower Market Forecast (USD Billion), by Sub-Segment 1, 2018-2029
Figure 4: Global Hybrid Wet-dry Cooling Tower Market Forecast (USD Billion), by Sub-Segment 2, 2018-2029
Figure 5: Global Hybrid Wet-dry Cooling Tower Market Value Share (%), By Segment 2, 2022 & 2029
Figure 6: Global Hybrid Wet-dry Cooling Tower Market Forecast (USD Billion), by Sub-Segment 1, 2018-2029
Figure 7: Global Hybrid Wet-dry Cooling Tower Market Forecast (USD Billion), by Sub-Segment 2, 2018-2029
Figure 8: Global Hybrid Wet-dry Cooling Tower Market Forecast (USD Billion), by Sub-Segment 3, 2018-2029
Figure 9: Global Hybrid Wet-dry Cooling Tower Market Forecast (USD Billion), by Others, 2018-2029
Figure 10: Global Hybrid Wet-dry Cooling Tower Market Value Share (%), By Segment 3, 2022 & 2029
Figure 11: Global Hybrid Wet-dry Cooling Tower Market Forecast (USD Billion), by Sub-Segment 1, 2018-2029
Figure 12: Global Hybrid Wet-dry Cooling Tower Market Forecast (USD Billion), by Sub-Segment 2, 2018-2029
Figure 13: Global Hybrid Wet-dry Cooling Tower Market Forecast (USD Billion), by Sub-Segment 3, 2018-2029
Figure 14: Global Hybrid Wet-dry Cooling Tower Market Forecast (USD Billion), by Others, 2018-2029
Figure 15: Global Hybrid Wet-dry Cooling Tower Market Value (USD Billion), by Region, 2022 & 2029
Figure 16: North America Hybrid Wet-dry Cooling Tower Market Value Share (%), By Segment 1, 2022 & 2029
Figure 17: North America Hybrid Wet-dry Cooling Tower Market Forecast (USD Billion), by Sub-Segment 1, 2018-2029
Figure 18: North America Hybrid Wet-dry Cooling Tower Market Forecast (USD Billion), by Sub-Segment 2, 2018-2029
Figure 19: North America Hybrid Wet-dry Cooling Tower Market Value Share (%), By Segment 2, 2022 & 2029
Figure 20: North America Hybrid Wet-dry Cooling Tower Market Forecast (USD Billion), by Sub-Segment 1, 2018-2029
Figure 21: North America Hybrid Wet-dry Cooling Tower Market Forecast (USD Billion), by Sub-Segment 2, 2018-2029
Figure 22: North America Hybrid Wet-dry Cooling Tower Market Forecast (USD Billion), by Sub-Segment 3, 2018-2029
Figure 23: North America Hybrid Wet-dry Cooling Tower Market Forecast (USD Billion), by Others, 2018-2029
Figure 24: North America Hybrid Wet-dry Cooling Tower Market Value Share (%), By Segment 3, 2022 & 2029
Figure 25: North America Hybrid Wet-dry Cooling Tower Market Forecast (USD Billion), by Sub-Segment 1, 2018-2029
Figure 26: North America Hybrid Wet-dry Cooling Tower Market Forecast (USD Billion), by Sub-Segment 2, 2018-2029
Figure 27: North America Hybrid Wet-dry Cooling Tower Market Forecast (USD Billion), by Sub-Segment 3, 2018-2029
Figure 28: North America Hybrid Wet-dry Cooling Tower Market Forecast (USD Billion), by Others, 2018-2029
Figure 29: North America Hybrid Wet-dry Cooling Tower Market Forecast (USD Billion), by U.S., 2018-2029
Figure 30: North America Hybrid Wet-dry Cooling Tower Market Forecast (USD Billion), by Canada, 2018-2029
Figure 31: Latin America Hybrid Wet-dry Cooling Tower Market Value Share (%), By Segment 1, 2022 & 2029
Figure 32: Latin America Hybrid Wet-dry Cooling Tower Market Forecast (USD Billion), by Sub-Segment 1, 2018-2029
Figure 33: Latin America Hybrid Wet-dry Cooling Tower Market Forecast (USD Billion), by Sub-Segment 2, 2018-2029
Figure 34: Latin America Hybrid Wet-dry Cooling Tower Market Value Share (%), By Segment 2, 2022 & 2029
Figure 35: Latin America Hybrid Wet-dry Cooling Tower Market Forecast (USD Billion), by Sub-Segment 1, 2018-2029
Figure 36: Latin America Hybrid Wet-dry Cooling Tower Market Forecast (USD Billion), by Sub-Segment 2, 2018-2029
Figure 37: Latin America Hybrid Wet-dry Cooling Tower Market Forecast (USD Billion), by Sub-Segment 3, 2018-2029
Figure 38: Latin America Hybrid Wet-dry Cooling Tower Market Forecast (USD Billion), by Others, 2018-2029
Figure 39: Latin America Hybrid Wet-dry Cooling Tower Market Value Share (%), By Segment 3, 2022 & 2029
Figure 40: Latin America Hybrid Wet-dry Cooling Tower Market Forecast (USD Billion), by Sub-Segment 1, 2018-2029
Figure 41: Latin America Hybrid Wet-dry Cooling Tower Market Forecast (USD Billion), by Sub-Segment 2, 2018-2029
Figure 42: Latin America Hybrid Wet-dry Cooling Tower Market Forecast (USD Billion), by Sub-Segment 3, 2018-2029
Figure 43: Latin America Hybrid Wet-dry Cooling Tower Market Forecast (USD Billion), by Others, 2018-2029
Figure 44: Latin America Hybrid Wet-dry Cooling Tower Market Forecast (USD Billion), by Brazil, 2018-2029
Figure 45: Latin America Hybrid Wet-dry Cooling Tower Market Forecast (USD Billion), by Mexico, 2018-2029
Figure 46: Latin America Hybrid Wet-dry Cooling Tower Market Forecast (USD Billion), by Rest of Latin America, 2018-2029
Figure 47: Europe Hybrid Wet-dry Cooling Tower Market Value Share (%), By Segment 1, 2022 & 2029
Figure 48: Europe Hybrid Wet-dry Cooling Tower Market Forecast (USD Billion), by Sub-Segment 1, 2018-2029
Figure 49: Europe Hybrid Wet-dry Cooling Tower Market Forecast (USD Billion), by Sub-Segment 2, 2018-2029
Figure 50: Europe Hybrid Wet-dry Cooling Tower Market Value Share (%), By Segment 2, 2022 & 2029
Figure 51: Europe Hybrid Wet-dry Cooling Tower Market Forecast (USD Billion), by Sub-Segment 1, 2018-2029
Figure 52: Europe Hybrid Wet-dry Cooling Tower Market Forecast (USD Billion), by Sub-Segment 2, 2018-2029
Figure 53: Europe Hybrid Wet-dry Cooling Tower Market Forecast (USD Billion), by Sub-Segment 3, 2018-2029
Figure 54: Europe Hybrid Wet-dry Cooling Tower Market Forecast (USD Billion), by Others, 2018-2029
Figure 55: Europe Hybrid Wet-dry Cooling Tower Market Value Share (%), By Segment 3, 2022 & 2029
Figure 56: Europe Hybrid Wet-dry Cooling Tower Market Forecast (USD Billion), by Sub-Segment 1, 2018-2029
Figure 57: Europe Hybrid Wet-dry Cooling Tower Market Forecast (USD Billion), by Sub-Segment 2, 2018-2029
Figure 58: Europe Hybrid Wet-dry Cooling Tower Market Forecast (USD Billion), by Sub-Segment 3, 2018-2029
Figure 59: Europe Hybrid Wet-dry Cooling Tower Market Forecast (USD Billion), by Others, 2018-2029
Figure 60: Europe Hybrid Wet-dry Cooling Tower Market Forecast (USD Billion), by U.K., 2018-2029
Figure 61: Europe Hybrid Wet-dry Cooling Tower Market Forecast (USD Billion), by Germany, 2018-2029
Figure 62: Europe Hybrid Wet-dry Cooling Tower Market Forecast (USD Billion), by France, 2018-2029
Figure 63: Europe Hybrid Wet-dry Cooling Tower Market Forecast (USD Billion), by Italy, 2018-2029
Figure 64: Europe Hybrid Wet-dry Cooling Tower Market Forecast (USD Billion), by Spain, 2018-2029
Figure 65: Europe Hybrid Wet-dry Cooling Tower Market Forecast (USD Billion), by Russia, 2018-2029
Figure 66: Europe Hybrid Wet-dry Cooling Tower Market Forecast (USD Billion), by Rest of Europe, 2018-2029
Figure 67: Asia Pacific Hybrid Wet-dry Cooling Tower Market Value Share (%), By Segment 1, 2022 & 2029
Figure 68: Asia Pacific Hybrid Wet-dry Cooling Tower Market Forecast (USD Billion), by Sub-Segment 1, 2018-2029
Figure 69: Asia Pacific Hybrid Wet-dry Cooling Tower Market Forecast (USD Billion), by Sub-Segment 2, 2018-2029
Figure 70: Asia Pacific Hybrid Wet-dry Cooling Tower Market Value Share (%), By Segment 2, 2022 & 2029
Figure 71: Asia Pacific Hybrid Wet-dry Cooling Tower Market Forecast (USD Billion), by Sub-Segment 1, 2018-2029
Figure 72: Asia Pacific Hybrid Wet-dry Cooling Tower Market Forecast (USD Billion), by Sub-Segment 2, 2018-2029
Figure 73: Asia Pacific Hybrid Wet-dry Cooling Tower Market Forecast (USD Billion), by Sub-Segment 3, 2018-2029
Figure 74: Asia Pacific Hybrid Wet-dry Cooling Tower Market Forecast (USD Billion), by Others, 2018-2029
Figure 75: Asia Pacific Hybrid Wet-dry Cooling Tower Market Value Share (%), By Segment 3, 2022 & 2029
Figure 76: Asia Pacific Hybrid Wet-dry Cooling Tower Market Forecast (USD Billion), by Sub-Segment 1, 2018-2029
Figure 77: Asia Pacific Hybrid Wet-dry Cooling Tower Market Forecast (USD Billion), by Sub-Segment 2, 2018-2029
Figure 78: Asia Pacific Hybrid Wet-dry Cooling Tower Market Forecast (USD Billion), by Sub-Segment 3, 2018-2029
Figure 79: Asia Pacific Hybrid Wet-dry Cooling Tower Market Forecast (USD Billion), by Others, 2018-2029
Figure 80: Asia Pacific Hybrid Wet-dry Cooling Tower Market Forecast (USD Billion), by China, 2018-2029
Figure 81: Asia Pacific Hybrid Wet-dry Cooling Tower Market Forecast (USD Billion), by India, 2018-2029
Figure 82: Asia Pacific Hybrid Wet-dry Cooling Tower Market Forecast (USD Billion), by Japan, 2018-2029
Figure 83: Asia Pacific Hybrid Wet-dry Cooling Tower Market Forecast (USD Billion), by Australia, 2018-2029
Figure 84: Asia Pacific Hybrid Wet-dry Cooling Tower Market Forecast (USD Billion), by Southeast Asia, 2018-2029
Figure 85: Asia Pacific Hybrid Wet-dry Cooling Tower Market Forecast (USD Billion), by Rest of Asia Pacific, 2018-2029
Figure 86: Middle East & Africa Hybrid Wet-dry Cooling Tower Market Value Share (%), By Segment 1, 2022 & 2029
Figure 87: Middle East & Africa Hybrid Wet-dry Cooling Tower Market Forecast (USD Billion), by Sub-Segment 1, 2018-2029
Figure 88: Middle East & Africa Hybrid Wet-dry Cooling Tower Market Forecast (USD Billion), by Sub-Segment 2, 2018-2029
Figure 89: Middle East & Africa Hybrid Wet-dry Cooling Tower Market Value Share (%), By Segment 2, 2022 & 2029
Figure 90: Middle East & Africa Hybrid Wet-dry Cooling Tower Market Forecast (USD Billion), by Sub-Segment 1, 2018-2029
Figure 91: Middle East & Africa Hybrid Wet-dry Cooling Tower Market Forecast (USD Billion), by Sub-Segment 2, 2018-2029
Figure 92: Middle East & Africa Hybrid Wet-dry Cooling Tower Market Forecast (USD Billion), by Sub-Segment 3, 2018-2029
Figure 93: Middle East & Africa Hybrid Wet-dry Cooling Tower Market Forecast (USD Billion), by Others, 2018-2029
Figure 94: Middle East & Africa Hybrid Wet-dry Cooling Tower Market Value Share (%), By Segment 3, 2022 & 2029
Figure 95: Middle East & Africa Hybrid Wet-dry Cooling Tower Market Forecast (USD Billion), by Sub-Segment 1, 2018-2029
Figure 96: Middle East & Africa Hybrid Wet-dry Cooling Tower Market Forecast (USD Billion), by Sub-Segment 2, 2018-2029
Figure 97: Middle East & Africa Hybrid Wet-dry Cooling Tower Market Forecast (USD Billion), by Sub-Segment 3, 2018-2029
Figure 98: Middle East & Africa Hybrid Wet-dry Cooling Tower Market Forecast (USD Billion), by Others, 2018-2029
Figure 99: Middle East & Africa Hybrid Wet-dry Cooling Tower Market Forecast (USD Billion), by GCC, 2018-2029
Figure 100: Middle East & Africa Hybrid Wet-dry Cooling Tower Market Forecast (USD Billion), by South Africa, 2018-2029
Figure 101: Middle East & Africa Hybrid Wet-dry Cooling Tower Market Forecast (USD Billion), by Rest of Middle East & Africa, 2018-2029
List of Tables
Table 1: Global Hybrid Wet-dry Cooling Tower Market Revenue (USD Billion) Forecast, by Segment 1, 2018-2029
Table 2: Global Hybrid Wet-dry Cooling Tower Market Revenue (USD Billion) Forecast, by Segment 2, 2018-2029
Table 3: Global Hybrid Wet-dry Cooling Tower Market Revenue (USD Billion) Forecast, by Segment 3, 2018-2029
Table 4: Global Hybrid Wet-dry Cooling Tower Market Revenue (USD Billion) Forecast, by Region, 2018-2029
Table 5: North America Hybrid Wet-dry Cooling Tower Market Revenue (USD Billion) Forecast, by Segment 1, 2018-2029
Table 6: North America Hybrid Wet-dry Cooling Tower Market Revenue (USD Billion) Forecast, by Segment 2, 2018-2029
Table 7: North America Hybrid Wet-dry Cooling Tower Market Revenue (USD Billion) Forecast, by Segment 3, 2018-2029
Table 8: North America Hybrid Wet-dry Cooling Tower Market Revenue (USD Billion) Forecast, by Country, 2018-2029
Table 9: Europe Hybrid Wet-dry Cooling Tower Market Revenue (USD Billion) Forecast, by Segment 1, 2018-2029
Table 10: Europe Hybrid Wet-dry Cooling Tower Market Revenue (USD Billion) Forecast, by Segment 2, 2018-2029
Table 11: Europe Hybrid Wet-dry Cooling Tower Market Revenue (USD Billion) Forecast, by Segment 3, 2018-2029
Table 12: Europe Hybrid Wet-dry Cooling Tower Market Revenue (USD Billion) Forecast, by Country, 2018-2029
Table 13: Latin America Hybrid Wet-dry Cooling Tower Market Revenue (USD Billion) Forecast, by Segment 1, 2018-2029
Table 14: Latin America Hybrid Wet-dry Cooling Tower Market Revenue (USD Billion) Forecast, by Segment 2, 2018-2029
Table 15: Latin America Hybrid Wet-dry Cooling Tower Market Revenue (USD Billion) Forecast, by Segment 3, 2018-2029
Table 16: Latin America Hybrid Wet-dry Cooling Tower Market Revenue (USD Billion) Forecast, by Country, 2018-2029
Table 17: Asia Pacific Hybrid Wet-dry Cooling Tower Market Revenue (USD Billion) Forecast, by Segment 1, 2018-2029
Table 18: Asia Pacific Hybrid Wet-dry Cooling Tower Market Revenue (USD Billion) Forecast, by Segment 2, 2018-2029
Table 19: Asia Pacific Hybrid Wet-dry Cooling Tower Market Revenue (USD Billion) Forecast, by Segment 3, 2018-2029
Table 20: Asia Pacific Hybrid Wet-dry Cooling Tower Market Revenue (USD Billion) Forecast, by Country, 2018-2029
Table 21: Middle East & Africa Hybrid Wet-dry Cooling Tower Market Revenue (USD Billion) Forecast, by Segment 1, 2018-2029
Table 22: Middle East & Africa Hybrid Wet-dry Cooling Tower Market Revenue (USD Billion) Forecast, by Segment 2, 2018-2029
Table 23: Middle East & Africa Hybrid Wet-dry Cooling Tower Market Revenue (USD Billion) Forecast, by Segment 3, 2018-2029
Table 24: Middle East & Africa Hybrid Wet-dry Cooling Tower Market Revenue (USD Billion) Forecast, by Country, 2018-2029
Research Process
Data Library Research are conducted by industry experts who offer insight on
industry structure, market segmentations technology assessment and competitive landscape (CL), and penetration, as well as on emerging trends. Their analysis is based on primary interviews (~ 80%) and secondary research (~ 20%) as well as years of professional expertise in their respective industries. Adding to this, by analysing historical trends and current market positions, our analysts predict where the market will be headed for the next five years. Furthermore, the varying trends of segment & categories geographically presented are also studied and the estimated based on the primary & secondary research.
In this particular report from the supply side Data Library Research has conducted primary surveys (interviews) with the key level executives (VP, CEO’s, Marketing Director, Business Development Manager
and SOFT) of the companies that active & prominent as well as the midsized organization
FIGURE 1: DLR RESEARH PROCESS
![research-methodology1]()
Primary Research
Extensive primary research was conducted to gain a deeper insight of the market and industry performance. The analysis is based on both primary and secondary research as well as years of professional expertise in the respective industries.
In addition to analysing current and historical trends, our analysts predict where the market is headed over the next five years.
It varies by segment for these categories geographically presented in the list of market tables. Speaking about this particular report we have conducted primary surveys (interviews) with the key level executives (VP, CEO’s, Marketing Director, Business Development Manager and many more) of the major players active in the market.
Secondary Research
Secondary research was mainly used to collect and identify information useful for the extensive, technical, market-oriented, and Friend’s study of the Global Extra Neutral Alcohol. It was also used to obtain key information about major players, market classification and segmentation according to the industry trends, geographical markets, and developments related to the market and technology perspectives. For this study, analysts have gathered information from various credible sources, such as annual reports, sec filings, journals, white papers, SOFT presentations, and company web sites.
Market Size Estimation
Both, top-down and bottom-up approaches were used to estimate and validate the size of the Global market and to estimate the size of various other dependent submarkets in the overall Extra Neutral Alcohol. The key players in the market were identified through secondary research and their market contributions in the respective geographies were determined through primary and secondary research.
Forecast Model
![research-methodology2]()