Inboard Inflatable Boat Market Overview and Analysis
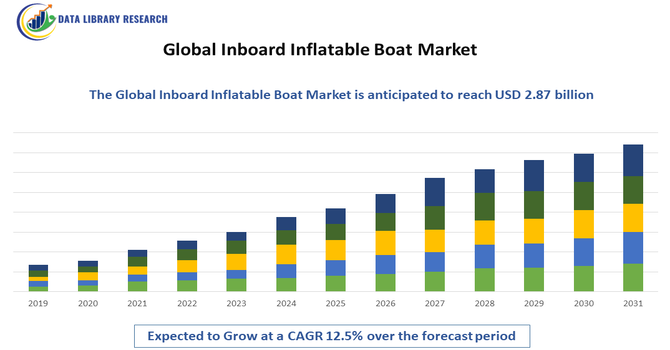
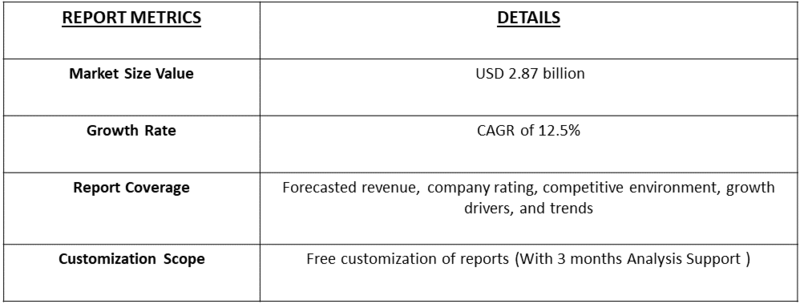
- The Global Inboard Inflatable Boat Market is estimated to increase from USD 2.87 billion in 2025 to USD 4.2 billion by 2032. The market is projected to record a CAGR of 12.5% from 2025 to 2032.
Get Complete Analysis Of The Report - Download Updated Free Sample PDF
The Global Inboard Inflatable Boat Market is experiencing steady growth driven by rising demand for recreational boating, increasing adoption of inflatable boats in maritime surveillance, rescue operations, and coastal patrolling, and growing interest in luxury marine tourism and water sports activities. The market is further supported by advancements in lightweight materials, improved engine performance, and enhanced durability features that make inboard inflatable boats suitable for both leisure and professional marine applications.
Inboard Inflatable Boat Market Latest Trends
The Global Inboard Inflatable Boat Market is witnessing several emerging trends that are reshaping product innovation, performance capabilities, and end-user adoption. The most prominent trends is the shift toward lightweight yet highly durable materials such as Hypalon, reinforced PVC, and advanced composites, enabling improved portability and longevity in harsh marine environments. Another key trend is the integration of electric and hybrid inboard propulsion systems driven by sustainability mandates and the growing preference for quieter, low-emission boating solutions, especially in eco-tourism and marine conservation zones
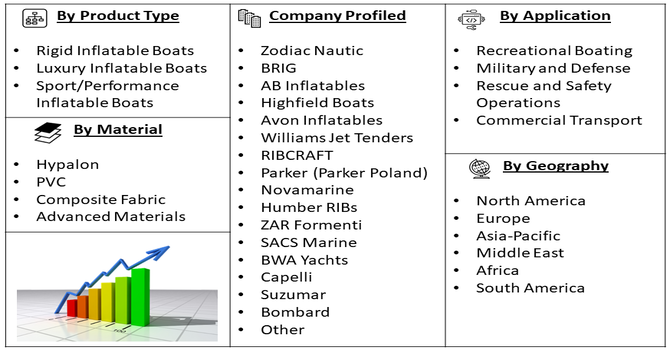
Segmentation: Global Inboard Inflatable Boat Market is segmented By Boat Type (Rigid Inflatable Boats, Luxury Inflatable Boats, and Sport/Performance Inflatable Boats), Material (Hypalon, PVC, Composite Fabric and Advanced Materials), Application (Recreational Boating, Military and Defense, Rescue and Safety Operations, Commercial Transport), and Geography (North America, Europe, Asia-Pacific, Middle East and Africa, and South America). The report provides the value (in USD million) for the above segments.
For Detailed Market Segmentation - Get a Free Sample PDF
Market Drivers:
- Rising Demand for Recreational Boating and Marine Tourism
The major drivers of the Global Inboard Inflatable Boat Market is the increasing popularity of recreational boating, marine tourism, and water-based leisure activities. Rising disposable incomes, growing participation in outdoor recreational sports, and a surge in luxury marine tourism, especially in coastal regions of Europe, North America, and Asia-Pacific, have significantly boosted the adoption of inboard inflatable boats. These boats are favored for their stability, lightweight construction, safety, and versatility, making them suitable for activities such as diving, fishing, coastal cruising, and water sports.
- Increased Use in Defense, Search and Rescue, and Law Enforcement Operations
The rising deployment of inboard inflatable boats in defense, coast guard, police agencies, and emergency response operations. These boats offer rapid deployment capability, high-speed maneuverability, shallow-water accessibility, and exceptional stability, making them ideal for rescue missions, border patrol, maritime surveillance, and disaster relief operations. For instance, in 2021, Delta Power Group’s contract to supply high-speed boats to Blue Light Commercial operators had significantly impacted the Inboard Inflatable Boat Market by driving demand for specialized, durable boats used in defense, search and rescue, and law enforcement. This deal had accelerated the adoption of advanced inflatable boats designed for critical operations, boosting market growth and encouraging manufacturers to develop innovative, high-performance vessels tailored to the rigorous needs of security and emergency services.
As global geopolitical tensions, coastal security challenges, and natural disaster occurrences increase, governments are investing heavily in modernizing their marine response fleets, further driving procurement of durable and high-performance inflatable boats.
Market Restraints:
- High Cost Associated with Manufacturing and Purchasing
The challenges is the high cost associated with manufacturing and purchasing inboard inflatable boats, especially those equipped with advanced propulsion systems, specialized materials like Hypalon, and integrated navigation or safety technologies. This makes them less affordable for budget-conscious buyers and restricts adoption in emerging markets. Additionally, maintenance requirements and repair costs, particularly for boats exposed to harsh marine environments, can deter long-term ownership. Another significant restraint is the regulatory compliance burden, including stringent environmental guidelines on marine engine emissions, safety certifications, and manufacturing standards, which increases operational complexity and production costs for manufacturers.
Segmental Analysis:
- Rigid Inflatable Boats segment is expected to witness highest growth over the forecast period
Rigid Inflatable Boats (RIBs) stand out as the most influential category due to their superior strength, stability, and performance across both calm and rough marine conditions. These boats are widely adopted for military patrol, rescue missions, recreational use, and commercial transport because of their high load-bearing capacity, lightweight structure, and excellent maneuverability. Their hybrid construction—rigid hull with inflatable tubes—offers enhanced safety and buoyancy, making them suitable for long-distance cruising and mission-critical applications. As the demand for multi-functional marine vessels increases, RIBs are expected to continue dominating the segment, with luxury and sport/performance inflatable boats gaining traction in leisure and high-speed marine sports markets.
- Hypalon segment is expected to witness highest growth over the forecast period
Hypalon emerges as the preferred choice due to its exceptional durability, resistance to abrasion, UV radiation, saltwater corrosion, and extreme temperature fluctuations. Although Hypalon is more expensive than PVC, its long service life and low degradation rate make it a preferred material for military, commercial, and heavy-duty recreational applications. PVC remains popular for cost-effective and lightweight consumer boats, while composite fabrics and advanced hybrid materials are increasingly being used to enhance strength-to-weight ratios and improve longevity. Continuous innovation in coating technologies and hybrid polymer structures is shaping the future of material usage in this market.
- Recreational Boating segment is expected to witness highest growth over the forecast period
Recreational Boating represents the fastest-growing category driven by rising participation in water-based leisure activities, yacht tender usage, adventure tourism, and personal marine ownership. Consumers increasingly prefer inboard inflatable boats for their versatility, ease of storage, lightweight structure, and improved safety features. Parallelly, the defense, rescue, and commercial transport sectors continue to generate consistent demand due to the reliability and operational efficiency of inflatable boats in mission-critical environments. The shift toward luxury marine experiences and eco-friendly propulsion systems further accelerates adoption in the leisure segment.
- Asia-Pacific region is expected to witness highest growth over the forecast period
The Asia-Pacific region is expected to experience the highest growth in the Global Inboard Inflatable Boat Market over the forecast period. This growth is driven by increasing disposable incomes, rising interest in recreational boating, and expanding tourism industries in countries like China, Japan, India, and Australia. For instance, Mercury Marine, a division of Brunswick Corporation, opened a centralized 512,000 square-foot distribution center near Indianapolis, Indiana, in December 2021. This facility had improved the supply chain efficiency for Mercury Marine products, including inflatable boats. As a result, it indirectly supported the Asia-Pacific Inboard Inflatable Boat Market by ensuring faster, more reliable product availability, boosting market growth through better distribution networks and increased accessibility of boats in the region.
Governments are investing in improving coastal infrastructure and promoting water sports, further boosting demand. Additionally, advancements in boat design and materials are making inboard inflatable boats more affordable and accessible to a wider audience. The growing middle class and increased urbanization are also contributing to higher boat ownership. Overall, the region’s expanding marine and leisure activities are fueling strong market growth for inboard inflatable boats.
To Learn More About This Report - Request a Free Sample Copy
Inboard Inflatable Boat Market Competitive Landscape:
The competitive landscape of the global inboard inflatable boat market is shaped by a mix of long-established marine builders, specialist RIB/inflatable manufacturers, and niche innovators focusing on materials, propulsion and bespoke mission solutions. Key players compete on design, durability, propulsion efficiency (including hybrid/electric options), after-sales support and OEM partnerships with yacht builders, defense and rescue agencies. Product differentiation through lightweight composite hulls, modular deck layouts, and specialty applications (rescue, patrol, leisure tenders, luxury inflatables) is common, while M&A, strategic alliances and regional production footprints are being used to scale capacity and access new markets.
- Zodiac Nautic
- BRIG
- AB Inflatables
- Highfield Boats
- Avon Inflatables
- Williams Jet Tenders
- RIBCRAFT
- Parker (Parker Poland)
- Novamarine
- Humber RIBs
- ZAR Formenti
- SACS Marine
- BWA Yachts
- Capelli
- Suzumar
- Bombard
- Delta Powerboats
- North River Boats
- Tactical Craft
- Ocean Master
Recent Development
- August 2022: Ribcraft began production under a five-year IDIQ contract to manufacture 278 units of its RIB model, with the contract valued at around USD 0.08 billion.
- June 2022: AB Inflatables introduced the ABJET 390 XP jet tender, designed to improve weight distribution and boat stability. It features a removable lateral seat and optimized passenger capacity, maximizing deck space and overall performance.
Frequently Asked Questions (FAQ) :
Q1. What are the main growth-driving factors for this market?
A major growth driver is the worldwide surge in recreational water-based activities like cruising, fishing, and watersports. Rising disposable incomes, especially in developing economies, enable greater consumer spending on leisure marine vessels. Additionally, increasing demand from military, coast guard, and rescue operations for durable Rigid Inflatable Boats (RIBs) with strong security capabilities further propels the market.
Q2. What are the main restraining factors for this market?
The primary restraining factor is the high initial cost of these advanced boats, particularly models featuring inboard engines and premium materials like Hypalon. Furthermore, the market is vulnerable to economic instability, as boat purchases are often tied to discretionary consumer spending. Geopolitical factors and tariffs can also increase supply chain costs, impacting overall affordability and market competitiveness.
Q3. Which segment is expected to witness high growth?
The Luxury/Premium segment is anticipated to witness exceptionally strong growth. This is fueled by high-net-worth individuals seeking customized tenders and sophisticated vessels for yacht support or premium recreational cruising. Inboard propulsion systems are often preferred in this segment for their optimized performance, reliability, and smooth handling required for high-end watersports activities like wakeboarding.
Q4. Who are the top major players for this market?
The competitive landscape is dominated by several well-known international manufacturers. Key players include Zodiac Nautic, AB Inflatables, Brig Boats, Highfield Boats, and Williams Jet Tenders, which specializes in luxury inboard jet tenders. These companies compete by focusing on innovation, offering superior hull materials, advanced design features, and strong global distribution networks for both recreational and professional use.
Q5. Which country is the largest player?
The Asia-Pacific region holds the largest market share for inflatable boats, driven by high adoption rates and increasing recreational activities in coastal countries like China, Japan, and Australia. While North America maintains the largest established recreational boating fleet overall, the rapid development of coastal tourism, rising consumer affluence, and expanding local manufacturing drive Asia-Pacific's leadership in this specific market segment.
List of Figures
Figure 1: Global Inboard Inflatable Boat Market Revenue Breakdown (USD Billion, %) by Region, 2022 & 2029
Figure 2: Global Inboard Inflatable Boat Market Value Share (%), By Segment 1, 2022 & 2029
Figure 3: Global Inboard Inflatable Boat Market Forecast (USD Billion), by Sub-Segment 1, 2018-2029
Figure 4: Global Inboard Inflatable Boat Market Forecast (USD Billion), by Sub-Segment 2, 2018-2029
Figure 5: Global Inboard Inflatable Boat Market Value Share (%), By Segment 2, 2022 & 2029
Figure 6: Global Inboard Inflatable Boat Market Forecast (USD Billion), by Sub-Segment 1, 2018-2029
Figure 7: Global Inboard Inflatable Boat Market Forecast (USD Billion), by Sub-Segment 2, 2018-2029
Figure 8: Global Inboard Inflatable Boat Market Forecast (USD Billion), by Sub-Segment 3, 2018-2029
Figure 9: Global Inboard Inflatable Boat Market Forecast (USD Billion), by Others, 2018-2029
Figure 10: Global Inboard Inflatable Boat Market Value Share (%), By Segment 3, 2022 & 2029
Figure 11: Global Inboard Inflatable Boat Market Forecast (USD Billion), by Sub-Segment 1, 2018-2029
Figure 12: Global Inboard Inflatable Boat Market Forecast (USD Billion), by Sub-Segment 2, 2018-2029
Figure 13: Global Inboard Inflatable Boat Market Forecast (USD Billion), by Sub-Segment 3, 2018-2029
Figure 14: Global Inboard Inflatable Boat Market Forecast (USD Billion), by Others, 2018-2029
Figure 15: Global Inboard Inflatable Boat Market Value (USD Billion), by Region, 2022 & 2029
Figure 16: North America Inboard Inflatable Boat Market Value Share (%), By Segment 1, 2022 & 2029
Figure 17: North America Inboard Inflatable Boat Market Forecast (USD Billion), by Sub-Segment 1, 2018-2029
Figure 18: North America Inboard Inflatable Boat Market Forecast (USD Billion), by Sub-Segment 2, 2018-2029
Figure 19: North America Inboard Inflatable Boat Market Value Share (%), By Segment 2, 2022 & 2029
Figure 20: North America Inboard Inflatable Boat Market Forecast (USD Billion), by Sub-Segment 1, 2018-2029
Figure 21: North America Inboard Inflatable Boat Market Forecast (USD Billion), by Sub-Segment 2, 2018-2029
Figure 22: North America Inboard Inflatable Boat Market Forecast (USD Billion), by Sub-Segment 3, 2018-2029
Figure 23: North America Inboard Inflatable Boat Market Forecast (USD Billion), by Others, 2018-2029
Figure 24: North America Inboard Inflatable Boat Market Value Share (%), By Segment 3, 2022 & 2029
Figure 25: North America Inboard Inflatable Boat Market Forecast (USD Billion), by Sub-Segment 1, 2018-2029
Figure 26: North America Inboard Inflatable Boat Market Forecast (USD Billion), by Sub-Segment 2, 2018-2029
Figure 27: North America Inboard Inflatable Boat Market Forecast (USD Billion), by Sub-Segment 3, 2018-2029
Figure 28: North America Inboard Inflatable Boat Market Forecast (USD Billion), by Others, 2018-2029
Figure 29: North America Inboard Inflatable Boat Market Forecast (USD Billion), by U.S., 2018-2029
Figure 30: North America Inboard Inflatable Boat Market Forecast (USD Billion), by Canada, 2018-2029
Figure 31: Latin America Inboard Inflatable Boat Market Value Share (%), By Segment 1, 2022 & 2029
Figure 32: Latin America Inboard Inflatable Boat Market Forecast (USD Billion), by Sub-Segment 1, 2018-2029
Figure 33: Latin America Inboard Inflatable Boat Market Forecast (USD Billion), by Sub-Segment 2, 2018-2029
Figure 34: Latin America Inboard Inflatable Boat Market Value Share (%), By Segment 2, 2022 & 2029
Figure 35: Latin America Inboard Inflatable Boat Market Forecast (USD Billion), by Sub-Segment 1, 2018-2029
Figure 36: Latin America Inboard Inflatable Boat Market Forecast (USD Billion), by Sub-Segment 2, 2018-2029
Figure 37: Latin America Inboard Inflatable Boat Market Forecast (USD Billion), by Sub-Segment 3, 2018-2029
Figure 38: Latin America Inboard Inflatable Boat Market Forecast (USD Billion), by Others, 2018-2029
Figure 39: Latin America Inboard Inflatable Boat Market Value Share (%), By Segment 3, 2022 & 2029
Figure 40: Latin America Inboard Inflatable Boat Market Forecast (USD Billion), by Sub-Segment 1, 2018-2029
Figure 41: Latin America Inboard Inflatable Boat Market Forecast (USD Billion), by Sub-Segment 2, 2018-2029
Figure 42: Latin America Inboard Inflatable Boat Market Forecast (USD Billion), by Sub-Segment 3, 2018-2029
Figure 43: Latin America Inboard Inflatable Boat Market Forecast (USD Billion), by Others, 2018-2029
Figure 44: Latin America Inboard Inflatable Boat Market Forecast (USD Billion), by Brazil, 2018-2029
Figure 45: Latin America Inboard Inflatable Boat Market Forecast (USD Billion), by Mexico, 2018-2029
Figure 46: Latin America Inboard Inflatable Boat Market Forecast (USD Billion), by Rest of Latin America, 2018-2029
Figure 47: Europe Inboard Inflatable Boat Market Value Share (%), By Segment 1, 2022 & 2029
Figure 48: Europe Inboard Inflatable Boat Market Forecast (USD Billion), by Sub-Segment 1, 2018-2029
Figure 49: Europe Inboard Inflatable Boat Market Forecast (USD Billion), by Sub-Segment 2, 2018-2029
Figure 50: Europe Inboard Inflatable Boat Market Value Share (%), By Segment 2, 2022 & 2029
Figure 51: Europe Inboard Inflatable Boat Market Forecast (USD Billion), by Sub-Segment 1, 2018-2029
Figure 52: Europe Inboard Inflatable Boat Market Forecast (USD Billion), by Sub-Segment 2, 2018-2029
Figure 53: Europe Inboard Inflatable Boat Market Forecast (USD Billion), by Sub-Segment 3, 2018-2029
Figure 54: Europe Inboard Inflatable Boat Market Forecast (USD Billion), by Others, 2018-2029
Figure 55: Europe Inboard Inflatable Boat Market Value Share (%), By Segment 3, 2022 & 2029
Figure 56: Europe Inboard Inflatable Boat Market Forecast (USD Billion), by Sub-Segment 1, 2018-2029
Figure 57: Europe Inboard Inflatable Boat Market Forecast (USD Billion), by Sub-Segment 2, 2018-2029
Figure 58: Europe Inboard Inflatable Boat Market Forecast (USD Billion), by Sub-Segment 3, 2018-2029
Figure 59: Europe Inboard Inflatable Boat Market Forecast (USD Billion), by Others, 2018-2029
Figure 60: Europe Inboard Inflatable Boat Market Forecast (USD Billion), by U.K., 2018-2029
Figure 61: Europe Inboard Inflatable Boat Market Forecast (USD Billion), by Germany, 2018-2029
Figure 62: Europe Inboard Inflatable Boat Market Forecast (USD Billion), by France, 2018-2029
Figure 63: Europe Inboard Inflatable Boat Market Forecast (USD Billion), by Italy, 2018-2029
Figure 64: Europe Inboard Inflatable Boat Market Forecast (USD Billion), by Spain, 2018-2029
Figure 65: Europe Inboard Inflatable Boat Market Forecast (USD Billion), by Russia, 2018-2029
Figure 66: Europe Inboard Inflatable Boat Market Forecast (USD Billion), by Rest of Europe, 2018-2029
Figure 67: Asia Pacific Inboard Inflatable Boat Market Value Share (%), By Segment 1, 2022 & 2029
Figure 68: Asia Pacific Inboard Inflatable Boat Market Forecast (USD Billion), by Sub-Segment 1, 2018-2029
Figure 69: Asia Pacific Inboard Inflatable Boat Market Forecast (USD Billion), by Sub-Segment 2, 2018-2029
Figure 70: Asia Pacific Inboard Inflatable Boat Market Value Share (%), By Segment 2, 2022 & 2029
Figure 71: Asia Pacific Inboard Inflatable Boat Market Forecast (USD Billion), by Sub-Segment 1, 2018-2029
Figure 72: Asia Pacific Inboard Inflatable Boat Market Forecast (USD Billion), by Sub-Segment 2, 2018-2029
Figure 73: Asia Pacific Inboard Inflatable Boat Market Forecast (USD Billion), by Sub-Segment 3, 2018-2029
Figure 74: Asia Pacific Inboard Inflatable Boat Market Forecast (USD Billion), by Others, 2018-2029
Figure 75: Asia Pacific Inboard Inflatable Boat Market Value Share (%), By Segment 3, 2022 & 2029
Figure 76: Asia Pacific Inboard Inflatable Boat Market Forecast (USD Billion), by Sub-Segment 1, 2018-2029
Figure 77: Asia Pacific Inboard Inflatable Boat Market Forecast (USD Billion), by Sub-Segment 2, 2018-2029
Figure 78: Asia Pacific Inboard Inflatable Boat Market Forecast (USD Billion), by Sub-Segment 3, 2018-2029
Figure 79: Asia Pacific Inboard Inflatable Boat Market Forecast (USD Billion), by Others, 2018-2029
Figure 80: Asia Pacific Inboard Inflatable Boat Market Forecast (USD Billion), by China, 2018-2029
Figure 81: Asia Pacific Inboard Inflatable Boat Market Forecast (USD Billion), by India, 2018-2029
Figure 82: Asia Pacific Inboard Inflatable Boat Market Forecast (USD Billion), by Japan, 2018-2029
Figure 83: Asia Pacific Inboard Inflatable Boat Market Forecast (USD Billion), by Australia, 2018-2029
Figure 84: Asia Pacific Inboard Inflatable Boat Market Forecast (USD Billion), by Southeast Asia, 2018-2029
Figure 85: Asia Pacific Inboard Inflatable Boat Market Forecast (USD Billion), by Rest of Asia Pacific, 2018-2029
Figure 86: Middle East & Africa Inboard Inflatable Boat Market Value Share (%), By Segment 1, 2022 & 2029
Figure 87: Middle East & Africa Inboard Inflatable Boat Market Forecast (USD Billion), by Sub-Segment 1, 2018-2029
Figure 88: Middle East & Africa Inboard Inflatable Boat Market Forecast (USD Billion), by Sub-Segment 2, 2018-2029
Figure 89: Middle East & Africa Inboard Inflatable Boat Market Value Share (%), By Segment 2, 2022 & 2029
Figure 90: Middle East & Africa Inboard Inflatable Boat Market Forecast (USD Billion), by Sub-Segment 1, 2018-2029
Figure 91: Middle East & Africa Inboard Inflatable Boat Market Forecast (USD Billion), by Sub-Segment 2, 2018-2029
Figure 92: Middle East & Africa Inboard Inflatable Boat Market Forecast (USD Billion), by Sub-Segment 3, 2018-2029
Figure 93: Middle East & Africa Inboard Inflatable Boat Market Forecast (USD Billion), by Others, 2018-2029
Figure 94: Middle East & Africa Inboard Inflatable Boat Market Value Share (%), By Segment 3, 2022 & 2029
Figure 95: Middle East & Africa Inboard Inflatable Boat Market Forecast (USD Billion), by Sub-Segment 1, 2018-2029
Figure 96: Middle East & Africa Inboard Inflatable Boat Market Forecast (USD Billion), by Sub-Segment 2, 2018-2029
Figure 97: Middle East & Africa Inboard Inflatable Boat Market Forecast (USD Billion), by Sub-Segment 3, 2018-2029
Figure 98: Middle East & Africa Inboard Inflatable Boat Market Forecast (USD Billion), by Others, 2018-2029
Figure 99: Middle East & Africa Inboard Inflatable Boat Market Forecast (USD Billion), by GCC, 2018-2029
Figure 100: Middle East & Africa Inboard Inflatable Boat Market Forecast (USD Billion), by South Africa, 2018-2029
Figure 101: Middle East & Africa Inboard Inflatable Boat Market Forecast (USD Billion), by Rest of Middle East & Africa, 2018-2029
List of Tables
Table 1: Global Inboard Inflatable Boat Market Revenue (USD Billion) Forecast, by Segment 1, 2018-2029
Table 2: Global Inboard Inflatable Boat Market Revenue (USD Billion) Forecast, by Segment 2, 2018-2029
Table 3: Global Inboard Inflatable Boat Market Revenue (USD Billion) Forecast, by Segment 3, 2018-2029
Table 4: Global Inboard Inflatable Boat Market Revenue (USD Billion) Forecast, by Region, 2018-2029
Table 5: North America Inboard Inflatable Boat Market Revenue (USD Billion) Forecast, by Segment 1, 2018-2029
Table 6: North America Inboard Inflatable Boat Market Revenue (USD Billion) Forecast, by Segment 2, 2018-2029
Table 7: North America Inboard Inflatable Boat Market Revenue (USD Billion) Forecast, by Segment 3, 2018-2029
Table 8: North America Inboard Inflatable Boat Market Revenue (USD Billion) Forecast, by Country, 2018-2029
Table 9: Europe Inboard Inflatable Boat Market Revenue (USD Billion) Forecast, by Segment 1, 2018-2029
Table 10: Europe Inboard Inflatable Boat Market Revenue (USD Billion) Forecast, by Segment 2, 2018-2029
Table 11: Europe Inboard Inflatable Boat Market Revenue (USD Billion) Forecast, by Segment 3, 2018-2029
Table 12: Europe Inboard Inflatable Boat Market Revenue (USD Billion) Forecast, by Country, 2018-2029
Table 13: Latin America Inboard Inflatable Boat Market Revenue (USD Billion) Forecast, by Segment 1, 2018-2029
Table 14: Latin America Inboard Inflatable Boat Market Revenue (USD Billion) Forecast, by Segment 2, 2018-2029
Table 15: Latin America Inboard Inflatable Boat Market Revenue (USD Billion) Forecast, by Segment 3, 2018-2029
Table 16: Latin America Inboard Inflatable Boat Market Revenue (USD Billion) Forecast, by Country, 2018-2029
Table 17: Asia Pacific Inboard Inflatable Boat Market Revenue (USD Billion) Forecast, by Segment 1, 2018-2029
Table 18: Asia Pacific Inboard Inflatable Boat Market Revenue (USD Billion) Forecast, by Segment 2, 2018-2029
Table 19: Asia Pacific Inboard Inflatable Boat Market Revenue (USD Billion) Forecast, by Segment 3, 2018-2029
Table 20: Asia Pacific Inboard Inflatable Boat Market Revenue (USD Billion) Forecast, by Country, 2018-2029
Table 21: Middle East & Africa Inboard Inflatable Boat Market Revenue (USD Billion) Forecast, by Segment 1, 2018-2029
Table 22: Middle East & Africa Inboard Inflatable Boat Market Revenue (USD Billion) Forecast, by Segment 2, 2018-2029
Table 23: Middle East & Africa Inboard Inflatable Boat Market Revenue (USD Billion) Forecast, by Segment 3, 2018-2029
Table 24: Middle East & Africa Inboard Inflatable Boat Market Revenue (USD Billion) Forecast, by Country, 2018-2029
Research Process
Data Library Research are conducted by industry experts who offer insight on
industry structure, market segmentations technology assessment and competitive landscape (CL), and penetration, as well as on emerging trends. Their analysis is based on primary interviews (~ 80%) and secondary research (~ 20%) as well as years of professional expertise in their respective industries. Adding to this, by analysing historical trends and current market positions, our analysts predict where the market will be headed for the next five years. Furthermore, the varying trends of segment & categories geographically presented are also studied and the estimated based on the primary & secondary research.
In this particular report from the supply side Data Library Research has conducted primary surveys (interviews) with the key level executives (VP, CEO’s, Marketing Director, Business Development Manager
and SOFT) of the companies that active & prominent as well as the midsized organization
FIGURE 1: DLR RESEARH PROCESS
![research-methodology1]()
Primary Research
Extensive primary research was conducted to gain a deeper insight of the market and industry performance. The analysis is based on both primary and secondary research as well as years of professional expertise in the respective industries.
In addition to analysing current and historical trends, our analysts predict where the market is headed over the next five years.
It varies by segment for these categories geographically presented in the list of market tables. Speaking about this particular report we have conducted primary surveys (interviews) with the key level executives (VP, CEO’s, Marketing Director, Business Development Manager and many more) of the major players active in the market.
Secondary Research
Secondary research was mainly used to collect and identify information useful for the extensive, technical, market-oriented, and Friend’s study of the Global Extra Neutral Alcohol. It was also used to obtain key information about major players, market classification and segmentation according to the industry trends, geographical markets, and developments related to the market and technology perspectives. For this study, analysts have gathered information from various credible sources, such as annual reports, sec filings, journals, white papers, SOFT presentations, and company web sites.
Market Size Estimation
Both, top-down and bottom-up approaches were used to estimate and validate the size of the Global market and to estimate the size of various other dependent submarkets in the overall Extra Neutral Alcohol. The key players in the market were identified through secondary research and their market contributions in the respective geographies were determined through primary and secondary research.
Forecast Model
![research-methodology2]()