Inhaled Allergens Allergy Diagnostics Market Overview and Analysis:
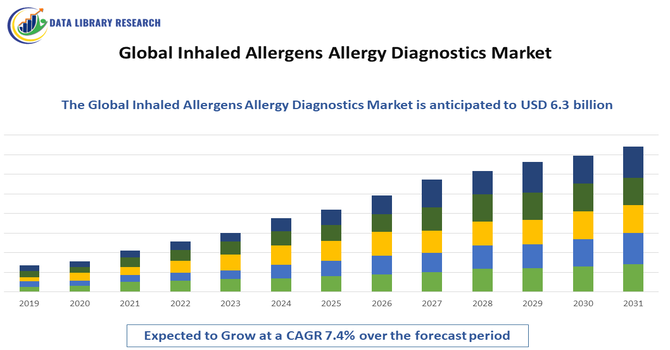
- The market is projected to reach around USD 6.3 billion by 2032, from USD 2.76 billion in 2025. The market is forecasted to grow at a healthy rate, with a CAGR of 7.4% over the forecast period, 2025-2032.
Get Complete Analysis Of The Report - Download Updated Free Sample PDF
The Global Inhaled Allergens Allergy Diagnostics Market is experiencing strong growth as the prevalence of respiratory allergies—including asthma, allergic rhinitis, pollen allergy, dust mite sensitivity, and pet dander reactions—continues to rise globally. The market expansion is driven by increasing environmental pollution, climate change intensifying pollen seasons, urbanization, and growing awareness about allergy testing for accurate disease management. Rising adoption of precision medicine, advancements in diagnostic technologies such as automated immunoassay platforms and point-of-care testing, and greater accessibility to allergy screening in developing healthcare systems further support market growth.
Inhaled Allergens Allergy Diagnostics Market Latest Trends:
The Global Inhaled Allergens Allergy Diagnostics Market is experiencing notable trends driven by advancements in diagnostic technologies and the shift toward personalized healthcare. One of the most prominent trends is the adoption of multiplex and component-resolved diagnostics (CRD), enabling clinicians to identify specific allergen molecules rather than generalized allergen sources for improved treatment precision. AI-powered interpretation tools and cloud-based integrated diagnostic platforms are also gaining momentum, enhancing accuracy and reducing diagnostic time.
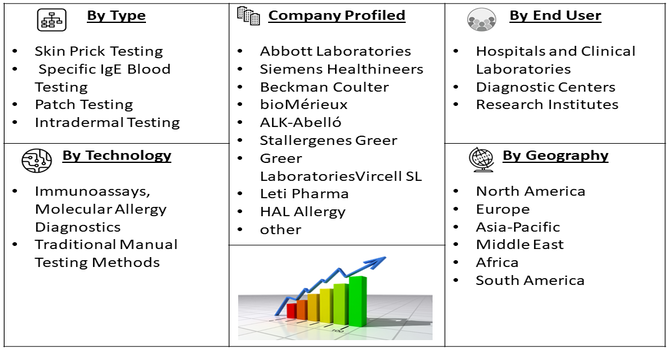
Segmentation: Global Inhaled Allergens Allergy Diagnostics Market is segmented By Test Type (Skin Prick Testing, Specific IgE Blood Testing, Patch Testing, Intradermal Testing), Technology (Immunoassays, Molecular Allergy Diagnostics, Traditional Manual Testing Methods), Allergen Type (Pollen Allergens, Dust Mites, Animal Dander), End User (Hospitals and Clinical Laboratories, Diagnostic Centers, Research Institutes), and Geography (North America, Europe, Asia-Pacific, Middle East and Africa, and South America). The report provides the value (in USD million) for the above segments.
For Detailed Market Segmentation - Get a Free Sample PDF
Market Drivers:
- Rising Prevalence of Allergic Respiratory Disorders
One of the primary drivers of the Global Inhaled Allergens Allergy Diagnostics Market is the increasing burden of allergic respiratory diseases, including allergic rhinitis, asthma, and chronic sinusitis, caused by exposure to airborne allergens such as dust mites, pollen, mold spores, and animal dander. For instance, an article published by NCBI reported that, reported that, rhinitis prevalence varied widely, ranging from 1% to 63%, with median rates of 29.4% for unspecified rhinitis, 18.1% for allergic rhinitis, and 12.0% for non-allergic rhinitis, differing across regions. The increasing trend in rhinitis cases highlighted the growing burden of allergic respiratory disorders, driving demand for advanced inhaled allergen diagnostics. This rising prevalence boosted athe doption of allergy testing solutions, supporting expansion and innovation in the Global Inhaled Allergens Allergy Diagnostics Market.
- Growth in Personalized and Precision Medicine Adoption
The global shift toward personalized medicine is another major driver accelerating the growth of inhaled allergen diagnostic solutions.
Advanced technologies such as molecular diagnostics, component-resolved diagnostics (CRD), and automated immunoassays allow clinicians to pinpoint allergen sensitivities with higher specificity, improving accuracy, treatment effectiveness, and immunotherapy planning. For instance, in February 2025, ATANIS Biotech received a USD 2 million grant from FARE to advance its FAST-PASE allergy test, an ex vivo mast cell activation assay enabling safe and accurate food allergy diagnosis. This innovation supported growth in personalized and precision medicine by offering tailored, risk-free testing. It also strengthened the Global Inhaled Allergens Allergy Diagnostics Market by promoting the adoption of advanced, patient-specific diagnostic solutions and accelerating market expansion.
Market Restraints:
- High Cost Associated with Advanced Allergy Diagnostic Systems
The challenges is the high cost associated with advanced allergy diagnostic systems, particularly molecular and component-resolved diagnostic technologies, which can limit adoption in low- and middle-income regions where reimbursement coverage is limited or inconsistent. Additionally, variability in clinical guidelines and lack of standardization across testing methods often lead to diagnostic inconsistencies and unclear interpretation, reducing clinician confidence in newer platforms. Limited awareness and underdiagnosis of allergic respiratory conditions, especially in developing regions, further restrict the potential patient pool for diagnostic screening.
Socio-Economic Impact on Inhaled Allergens Allergy Diagnostics Market
The Global Inhaled Allergens Allergy Diagnostics Market has significant socioeconomic impacts, as allergies affect millions worldwide, reducing quality of life and productivity. Early and accurate diagnosis helps patients manage symptoms, lowering healthcare costs from repeated doctor visits, hospitalizations, and treatments. Improved diagnostics also reduces work and school absenteeism, supporting economic productivity. Growing awareness, accessibility of testing, and adoption of advanced diagnostic technologies create jobs in healthcare, research, and diagnostics manufacturing. Overall, the market not only improves individual health outcomes but also eases financial burdens on healthcare systems and society, contributing to broader economic and social well-being.
Segmental Analysis:
- Skin Prick Testing segment is expected to witness the highest growth over the forecast period
Skin Prick Testing represents one of the most widely adopted diagnostic approaches due to its cost-effectiveness, rapid results, and long-standing clinical acceptance. It remains a preferred method in clinical and hospital environments because it allows multi-allergen sensitivity testing in a single session, making it highly suitable for large-scale allergy screening programs and routine diagnostic workflows.
- Immunoassays segment is expected to witness the highest growth over the forecast period
Immunoassays account for a significant share of the market owing to their high accuracy, automation compatibility, and scalability. Immunoassay-based platforms, such as ELISA and automated IgE systems, are increasingly used in laboratories due to their ability to quantify specific allergen responses and support clinical decision-making, especially for patients requiring long-term monitoring or immunotherapy planning.
- Pollen Allergens segment is expected to witness the highest growth over the forecast period
Pollen Allergens hold a major market share driven by the strong global rise in seasonal allergic rhinitis and asthma cases linked to environmental changes, urbanization, and increasing airborne pollen concentration. Climate-driven shifts in pollen seasons have led to a greater demand for precise diagnostics that identify specific plant-based allergen triggers such as grasses, trees, and weeds, particularly in regions with high seasonal allergy prevalence.
- Hospitals and Clinical Laboratories segment is expected to witness the highest growth over the forecast period
Hospitals and Clinical Laboratories dominate the market as they serve as primary diagnostic centers for allergy evaluation, treatment planning, and long-term respiratory disease management. Their ability to integrate advanced molecular diagnostics, automated testing platforms, and AI-powered data interpretation tools strengthens their role as key consumers of inhaled allergen diagnostic solutions.
- North America region is expected to witness the highest growth over the forecast period
North America is expected to witness the highest growth over the forecast period, driven by a rising prevalence of allergic respiratory diseases, strong adoption of advanced diagnostic technologies, and well-established healthcare infrastructure supporting accurate allergy screening and precision medicine.
Increasing awareness of inhaled allergen-related conditions, expanding government-backed screening programs, and favorable reimbursement policies are further accelerating demand for modern diagnostic tools such as molecular testing, automated immunoassays, and AI-assisted interpretation systems.
Additionally, the presence of key industry players, ongoing research initiatives, and higher per capita healthcare spending continue to position North America as a leading region for innovation, regulatory approvals, and commercialization of advanced inhaled allergen diagnostic solutions. For instance, The April 2024 launch of Beckman Coulter Life Sciences’ Basophil Activation Test (BAT) had a notable impact on the US allergy diagnostics market. By offering laboratories a highly sensitive, flow cytometry-based method to detect IgE-mediated allergic reactions, it modernized diagnostic workflows, improved testing accuracy, and reduced reliance on riskier procedures like oral food challenges. This innovation strengthened adoption of advanced allergy diagnostics and supported growth in the US market.
Similarly, Thermo Fisher Scientific’s 2022 FDA approval of ImmunoCAP tests for wheat and sesame allergens and 3M’s rapid allergen test kits had a significant impact on the US allergy diagnostics market. These tools enabled clinicians and food manufacturers to accurately identify allergens, reduce misdiagnoses, and prevent unnecessary dietary restrictions. The rapid, reliable testing improved patient safety, streamlined laboratory workflows, and supported broader adoption of advanced allergy diagnostics, driving growth in the US market.
| Report Matrics |
Details |
| Market Size Value |
USD 2.76 billion |
| Growth Rate |
CAGR of 7.4% |
| Forecast |
2026-2033 |
| Historical data |
2021-2024 |
| Base Year |
2025 |
| Report Coverage |
Forecasted revenue, company rating, competitive environment, growth drivers, and trends |
| Segment Coverage |
Type, Application, End-User, Geography |
| Regional Scope |
North America, Europe, Asia Pacific, Middle East |
| Customized scope |
Free customization of reports (With 3 months Analysis Support ) |
| To Learn More About This Report |
Request a Free Sample Copy |
Inhaled Allergens Allergy Diagnostics Market Competitive Landscape:
The competitive landscape features a mix of large in-vitro diagnostics companies, specialized allergy diagnostics firms, and regional niche players competing on assay performance, multiplexing capability, automation, regulatory approvals, and integration with clinical workflows.
Key Players:
- Thermo Fisher Scientific (Phadia)
- Roche Diagnostics
- Abbott Laboratories
- Siemens Healthineers
- Beckman Coulter
- bioMérieux
- ALK-Abelló
- Stallergenes Greer
- Greer Laboratories
- Omega Diagnostics Group
- Orgentec Diagnostika
- Hycor Biomedical
- ACON Laboratories
- Immuno Diagnostic Systems (IDS)
- Vircell SL
- Leti Pharma
- HAL Allergy
- Eurofins Clinical Diagnostics
- DiaSorin
- QuidelOrtho
Recent Development
- In April 2025, In April 2025, Beckman Coulter Life Sciences introduced its next-generation Basophil Activation Test (BAT), marking a major advancement in allergy diagnostics. This innovative assay provides a safer and more efficient alternative to traditional oral food challenges (OFCs), minimizing the risk of severe allergic reactions while improving the accuracy and reliability of allergy testing.
- In July 2024, AliveDx’s IVDR CE-marked microarray immunoassay, designed to detect specific IgE against protein allergens, marks a significant advancement in the Global Inhaled Allergens Allergy Diagnostics Market. By expanding its MosaiQ platform to evaluate multiple allergens simultaneously, including inhalant and food allergens, the company enhances diagnostic efficiency and accuracy. This innovation supports wider adoption of multiplex allergy testing, addresses growing demand for comprehensive allergy diagnostics, and strengthens market growth by offering clinicians more effective tools for early detection and personalized patient management. @@@@@
Frequently Asked Questions (FAQ) :
Q1. What are the main growth-driving factors for this market?
The market saw substantial growth mainly because respiratory allergies like allergic rhinitis became much more common globally. Urbanization and increased air pollution, including smog and pollen, heightened people's sensitivity to inhaled allergens. Furthermore, medical awareness increased, and people sought accurate diagnosis, which in turn drove the demand for better, faster testing kits and technologies.
Q2. What are the main restraining factors for this market?
Growth was limited by the high cost of advanced diagnostic equipment and specific in vitro tests, making them less accessible in developing regions. Another restraint was the shortage of specialized allergists and trained personnel, particularly in emerging healthcare markets. Lastly, the necessity for confirmatory testing sometimes slowed down the patient journey and increased overall costs.
Q3. Which segment is expected to witness high growth?
The In Vitro Test Segment, which includes blood-based testing, was anticipated to see high growth. These tests allowed doctors to identify specific IgE antibodies without exposing the patient to the actual allergen. This method offered better safety and standardization compared to traditional skin tests, making it the preferred choice for a wider range of patients, especially children and those with severe symptoms.
Q4. Who are the top major players for this market?
The market was led by well-established healthcare companies specializing in diagnostics. Key major players included Thermo Fisher Scientific, Siemens Healthineers, and Danaher Corporation. These companies offered a wide portfolio of instruments and recurring consumables (like test kits and reagents), and they were focused on developing fully automated testing platforms for high-volume diagnostic laboratories.
Q5. Which country is the largest player?
North America, primarily the United States, was the largest regional market. This dominance was due to its highly advanced healthcare infrastructure, high incidence of allergic conditions, and strong awareness among both patients and doctors regarding the importance of allergy testing. Favorable reimbursement policies for diagnostic procedures also substantially supported the market's leading position there.
List of Figures
Figure 1: Global Inhaled Allergens Allergy Diagnostics Market Revenue Breakdown (USD Billion, %) by Region, 2022 & 2029
Figure 2: Global Inhaled Allergens Allergy Diagnostics Market Value Share (%), By Segment 1, 2022 & 2029
Figure 3: Global Inhaled Allergens Allergy Diagnostics Market Forecast (USD Billion), by Sub-Segment 1, 2018-2029
Figure 4: Global Inhaled Allergens Allergy Diagnostics Market Forecast (USD Billion), by Sub-Segment 2, 2018-2029
Figure 5: Global Inhaled Allergens Allergy Diagnostics Market Value Share (%), By Segment 2, 2022 & 2029
Figure 6: Global Inhaled Allergens Allergy Diagnostics Market Forecast (USD Billion), by Sub-Segment 1, 2018-2029
Figure 7: Global Inhaled Allergens Allergy Diagnostics Market Forecast (USD Billion), by Sub-Segment 2, 2018-2029
Figure 8: Global Inhaled Allergens Allergy Diagnostics Market Forecast (USD Billion), by Sub-Segment 3, 2018-2029
Figure 9: Global Inhaled Allergens Allergy Diagnostics Market Forecast (USD Billion), by Others, 2018-2029
Figure 10: Global Inhaled Allergens Allergy Diagnostics Market Value Share (%), By Segment 3, 2022 & 2029
Figure 11: Global Inhaled Allergens Allergy Diagnostics Market Forecast (USD Billion), by Sub-Segment 1, 2018-2029
Figure 12: Global Inhaled Allergens Allergy Diagnostics Market Forecast (USD Billion), by Sub-Segment 2, 2018-2029
Figure 13: Global Inhaled Allergens Allergy Diagnostics Market Forecast (USD Billion), by Sub-Segment 3, 2018-2029
Figure 14: Global Inhaled Allergens Allergy Diagnostics Market Forecast (USD Billion), by Others, 2018-2029
Figure 15: Global Inhaled Allergens Allergy Diagnostics Market Value (USD Billion), by Region, 2022 & 2029
Figure 16: North America Inhaled Allergens Allergy Diagnostics Market Value Share (%), By Segment 1, 2022 & 2029
Figure 17: North America Inhaled Allergens Allergy Diagnostics Market Forecast (USD Billion), by Sub-Segment 1, 2018-2029
Figure 18: North America Inhaled Allergens Allergy Diagnostics Market Forecast (USD Billion), by Sub-Segment 2, 2018-2029
Figure 19: North America Inhaled Allergens Allergy Diagnostics Market Value Share (%), By Segment 2, 2022 & 2029
Figure 20: North America Inhaled Allergens Allergy Diagnostics Market Forecast (USD Billion), by Sub-Segment 1, 2018-2029
Figure 21: North America Inhaled Allergens Allergy Diagnostics Market Forecast (USD Billion), by Sub-Segment 2, 2018-2029
Figure 22: North America Inhaled Allergens Allergy Diagnostics Market Forecast (USD Billion), by Sub-Segment 3, 2018-2029
Figure 23: North America Inhaled Allergens Allergy Diagnostics Market Forecast (USD Billion), by Others, 2018-2029
Figure 24: North America Inhaled Allergens Allergy Diagnostics Market Value Share (%), By Segment 3, 2022 & 2029
Figure 25: North America Inhaled Allergens Allergy Diagnostics Market Forecast (USD Billion), by Sub-Segment 1, 2018-2029
Figure 26: North America Inhaled Allergens Allergy Diagnostics Market Forecast (USD Billion), by Sub-Segment 2, 2018-2029
Figure 27: North America Inhaled Allergens Allergy Diagnostics Market Forecast (USD Billion), by Sub-Segment 3, 2018-2029
Figure 28: North America Inhaled Allergens Allergy Diagnostics Market Forecast (USD Billion), by Others, 2018-2029
Figure 29: North America Inhaled Allergens Allergy Diagnostics Market Forecast (USD Billion), by U.S., 2018-2029
Figure 30: North America Inhaled Allergens Allergy Diagnostics Market Forecast (USD Billion), by Canada, 2018-2029
Figure 31: Latin America Inhaled Allergens Allergy Diagnostics Market Value Share (%), By Segment 1, 2022 & 2029
Figure 32: Latin America Inhaled Allergens Allergy Diagnostics Market Forecast (USD Billion), by Sub-Segment 1, 2018-2029
Figure 33: Latin America Inhaled Allergens Allergy Diagnostics Market Forecast (USD Billion), by Sub-Segment 2, 2018-2029
Figure 34: Latin America Inhaled Allergens Allergy Diagnostics Market Value Share (%), By Segment 2, 2022 & 2029
Figure 35: Latin America Inhaled Allergens Allergy Diagnostics Market Forecast (USD Billion), by Sub-Segment 1, 2018-2029
Figure 36: Latin America Inhaled Allergens Allergy Diagnostics Market Forecast (USD Billion), by Sub-Segment 2, 2018-2029
Figure 37: Latin America Inhaled Allergens Allergy Diagnostics Market Forecast (USD Billion), by Sub-Segment 3, 2018-2029
Figure 38: Latin America Inhaled Allergens Allergy Diagnostics Market Forecast (USD Billion), by Others, 2018-2029
Figure 39: Latin America Inhaled Allergens Allergy Diagnostics Market Value Share (%), By Segment 3, 2022 & 2029
Figure 40: Latin America Inhaled Allergens Allergy Diagnostics Market Forecast (USD Billion), by Sub-Segment 1, 2018-2029
Figure 41: Latin America Inhaled Allergens Allergy Diagnostics Market Forecast (USD Billion), by Sub-Segment 2, 2018-2029
Figure 42: Latin America Inhaled Allergens Allergy Diagnostics Market Forecast (USD Billion), by Sub-Segment 3, 2018-2029
Figure 43: Latin America Inhaled Allergens Allergy Diagnostics Market Forecast (USD Billion), by Others, 2018-2029
Figure 44: Latin America Inhaled Allergens Allergy Diagnostics Market Forecast (USD Billion), by Brazil, 2018-2029
Figure 45: Latin America Inhaled Allergens Allergy Diagnostics Market Forecast (USD Billion), by Mexico, 2018-2029
Figure 46: Latin America Inhaled Allergens Allergy Diagnostics Market Forecast (USD Billion), by Rest of Latin America, 2018-2029
Figure 47: Europe Inhaled Allergens Allergy Diagnostics Market Value Share (%), By Segment 1, 2022 & 2029
Figure 48: Europe Inhaled Allergens Allergy Diagnostics Market Forecast (USD Billion), by Sub-Segment 1, 2018-2029
Figure 49: Europe Inhaled Allergens Allergy Diagnostics Market Forecast (USD Billion), by Sub-Segment 2, 2018-2029
Figure 50: Europe Inhaled Allergens Allergy Diagnostics Market Value Share (%), By Segment 2, 2022 & 2029
Figure 51: Europe Inhaled Allergens Allergy Diagnostics Market Forecast (USD Billion), by Sub-Segment 1, 2018-2029
Figure 52: Europe Inhaled Allergens Allergy Diagnostics Market Forecast (USD Billion), by Sub-Segment 2, 2018-2029
Figure 53: Europe Inhaled Allergens Allergy Diagnostics Market Forecast (USD Billion), by Sub-Segment 3, 2018-2029
Figure 54: Europe Inhaled Allergens Allergy Diagnostics Market Forecast (USD Billion), by Others, 2018-2029
Figure 55: Europe Inhaled Allergens Allergy Diagnostics Market Value Share (%), By Segment 3, 2022 & 2029
Figure 56: Europe Inhaled Allergens Allergy Diagnostics Market Forecast (USD Billion), by Sub-Segment 1, 2018-2029
Figure 57: Europe Inhaled Allergens Allergy Diagnostics Market Forecast (USD Billion), by Sub-Segment 2, 2018-2029
Figure 58: Europe Inhaled Allergens Allergy Diagnostics Market Forecast (USD Billion), by Sub-Segment 3, 2018-2029
Figure 59: Europe Inhaled Allergens Allergy Diagnostics Market Forecast (USD Billion), by Others, 2018-2029
Figure 60: Europe Inhaled Allergens Allergy Diagnostics Market Forecast (USD Billion), by U.K., 2018-2029
Figure 61: Europe Inhaled Allergens Allergy Diagnostics Market Forecast (USD Billion), by Germany, 2018-2029
Figure 62: Europe Inhaled Allergens Allergy Diagnostics Market Forecast (USD Billion), by France, 2018-2029
Figure 63: Europe Inhaled Allergens Allergy Diagnostics Market Forecast (USD Billion), by Italy, 2018-2029
Figure 64: Europe Inhaled Allergens Allergy Diagnostics Market Forecast (USD Billion), by Spain, 2018-2029
Figure 65: Europe Inhaled Allergens Allergy Diagnostics Market Forecast (USD Billion), by Russia, 2018-2029
Figure 66: Europe Inhaled Allergens Allergy Diagnostics Market Forecast (USD Billion), by Rest of Europe, 2018-2029
Figure 67: Asia Pacific Inhaled Allergens Allergy Diagnostics Market Value Share (%), By Segment 1, 2022 & 2029
Figure 68: Asia Pacific Inhaled Allergens Allergy Diagnostics Market Forecast (USD Billion), by Sub-Segment 1, 2018-2029
Figure 69: Asia Pacific Inhaled Allergens Allergy Diagnostics Market Forecast (USD Billion), by Sub-Segment 2, 2018-2029
Figure 70: Asia Pacific Inhaled Allergens Allergy Diagnostics Market Value Share (%), By Segment 2, 2022 & 2029
Figure 71: Asia Pacific Inhaled Allergens Allergy Diagnostics Market Forecast (USD Billion), by Sub-Segment 1, 2018-2029
Figure 72: Asia Pacific Inhaled Allergens Allergy Diagnostics Market Forecast (USD Billion), by Sub-Segment 2, 2018-2029
Figure 73: Asia Pacific Inhaled Allergens Allergy Diagnostics Market Forecast (USD Billion), by Sub-Segment 3, 2018-2029
Figure 74: Asia Pacific Inhaled Allergens Allergy Diagnostics Market Forecast (USD Billion), by Others, 2018-2029
Figure 75: Asia Pacific Inhaled Allergens Allergy Diagnostics Market Value Share (%), By Segment 3, 2022 & 2029
Figure 76: Asia Pacific Inhaled Allergens Allergy Diagnostics Market Forecast (USD Billion), by Sub-Segment 1, 2018-2029
Figure 77: Asia Pacific Inhaled Allergens Allergy Diagnostics Market Forecast (USD Billion), by Sub-Segment 2, 2018-2029
Figure 78: Asia Pacific Inhaled Allergens Allergy Diagnostics Market Forecast (USD Billion), by Sub-Segment 3, 2018-2029
Figure 79: Asia Pacific Inhaled Allergens Allergy Diagnostics Market Forecast (USD Billion), by Others, 2018-2029
Figure 80: Asia Pacific Inhaled Allergens Allergy Diagnostics Market Forecast (USD Billion), by China, 2018-2029
Figure 81: Asia Pacific Inhaled Allergens Allergy Diagnostics Market Forecast (USD Billion), by India, 2018-2029
Figure 82: Asia Pacific Inhaled Allergens Allergy Diagnostics Market Forecast (USD Billion), by Japan, 2018-2029
Figure 83: Asia Pacific Inhaled Allergens Allergy Diagnostics Market Forecast (USD Billion), by Australia, 2018-2029
Figure 84: Asia Pacific Inhaled Allergens Allergy Diagnostics Market Forecast (USD Billion), by Southeast Asia, 2018-2029
Figure 85: Asia Pacific Inhaled Allergens Allergy Diagnostics Market Forecast (USD Billion), by Rest of Asia Pacific, 2018-2029
Figure 86: Middle East & Africa Inhaled Allergens Allergy Diagnostics Market Value Share (%), By Segment 1, 2022 & 2029
Figure 87: Middle East & Africa Inhaled Allergens Allergy Diagnostics Market Forecast (USD Billion), by Sub-Segment 1, 2018-2029
Figure 88: Middle East & Africa Inhaled Allergens Allergy Diagnostics Market Forecast (USD Billion), by Sub-Segment 2, 2018-2029
Figure 89: Middle East & Africa Inhaled Allergens Allergy Diagnostics Market Value Share (%), By Segment 2, 2022 & 2029
Figure 90: Middle East & Africa Inhaled Allergens Allergy Diagnostics Market Forecast (USD Billion), by Sub-Segment 1, 2018-2029
Figure 91: Middle East & Africa Inhaled Allergens Allergy Diagnostics Market Forecast (USD Billion), by Sub-Segment 2, 2018-2029
Figure 92: Middle East & Africa Inhaled Allergens Allergy Diagnostics Market Forecast (USD Billion), by Sub-Segment 3, 2018-2029
Figure 93: Middle East & Africa Inhaled Allergens Allergy Diagnostics Market Forecast (USD Billion), by Others, 2018-2029
Figure 94: Middle East & Africa Inhaled Allergens Allergy Diagnostics Market Value Share (%), By Segment 3, 2022 & 2029
Figure 95: Middle East & Africa Inhaled Allergens Allergy Diagnostics Market Forecast (USD Billion), by Sub-Segment 1, 2018-2029
Figure 96: Middle East & Africa Inhaled Allergens Allergy Diagnostics Market Forecast (USD Billion), by Sub-Segment 2, 2018-2029
Figure 97: Middle East & Africa Inhaled Allergens Allergy Diagnostics Market Forecast (USD Billion), by Sub-Segment 3, 2018-2029
Figure 98: Middle East & Africa Inhaled Allergens Allergy Diagnostics Market Forecast (USD Billion), by Others, 2018-2029
Figure 99: Middle East & Africa Inhaled Allergens Allergy Diagnostics Market Forecast (USD Billion), by GCC, 2018-2029
Figure 100: Middle East & Africa Inhaled Allergens Allergy Diagnostics Market Forecast (USD Billion), by South Africa, 2018-2029
Figure 101: Middle East & Africa Inhaled Allergens Allergy Diagnostics Market Forecast (USD Billion), by Rest of Middle East & Africa, 2018-2029
List of Tables
Table 1: Global Inhaled Allergens Allergy Diagnostics Market Revenue (USD Billion) Forecast, by Segment 1, 2018-2029
Table 2: Global Inhaled Allergens Allergy Diagnostics Market Revenue (USD Billion) Forecast, by Segment 2, 2018-2029
Table 3: Global Inhaled Allergens Allergy Diagnostics Market Revenue (USD Billion) Forecast, by Segment 3, 2018-2029
Table 4: Global Inhaled Allergens Allergy Diagnostics Market Revenue (USD Billion) Forecast, by Region, 2018-2029
Table 5: North America Inhaled Allergens Allergy Diagnostics Market Revenue (USD Billion) Forecast, by Segment 1, 2018-2029
Table 6: North America Inhaled Allergens Allergy Diagnostics Market Revenue (USD Billion) Forecast, by Segment 2, 2018-2029
Table 7: North America Inhaled Allergens Allergy Diagnostics Market Revenue (USD Billion) Forecast, by Segment 3, 2018-2029
Table 8: North America Inhaled Allergens Allergy Diagnostics Market Revenue (USD Billion) Forecast, by Country, 2018-2029
Table 9: Europe Inhaled Allergens Allergy Diagnostics Market Revenue (USD Billion) Forecast, by Segment 1, 2018-2029
Table 10: Europe Inhaled Allergens Allergy Diagnostics Market Revenue (USD Billion) Forecast, by Segment 2, 2018-2029
Table 11: Europe Inhaled Allergens Allergy Diagnostics Market Revenue (USD Billion) Forecast, by Segment 3, 2018-2029
Table 12: Europe Inhaled Allergens Allergy Diagnostics Market Revenue (USD Billion) Forecast, by Country, 2018-2029
Table 13: Latin America Inhaled Allergens Allergy Diagnostics Market Revenue (USD Billion) Forecast, by Segment 1, 2018-2029
Table 14: Latin America Inhaled Allergens Allergy Diagnostics Market Revenue (USD Billion) Forecast, by Segment 2, 2018-2029
Table 15: Latin America Inhaled Allergens Allergy Diagnostics Market Revenue (USD Billion) Forecast, by Segment 3, 2018-2029
Table 16: Latin America Inhaled Allergens Allergy Diagnostics Market Revenue (USD Billion) Forecast, by Country, 2018-2029
Table 17: Asia Pacific Inhaled Allergens Allergy Diagnostics Market Revenue (USD Billion) Forecast, by Segment 1, 2018-2029
Table 18: Asia Pacific Inhaled Allergens Allergy Diagnostics Market Revenue (USD Billion) Forecast, by Segment 2, 2018-2029
Table 19: Asia Pacific Inhaled Allergens Allergy Diagnostics Market Revenue (USD Billion) Forecast, by Segment 3, 2018-2029
Table 20: Asia Pacific Inhaled Allergens Allergy Diagnostics Market Revenue (USD Billion) Forecast, by Country, 2018-2029
Table 21: Middle East & Africa Inhaled Allergens Allergy Diagnostics Market Revenue (USD Billion) Forecast, by Segment 1, 2018-2029
Table 22: Middle East & Africa Inhaled Allergens Allergy Diagnostics Market Revenue (USD Billion) Forecast, by Segment 2, 2018-2029
Table 23: Middle East & Africa Inhaled Allergens Allergy Diagnostics Market Revenue (USD Billion) Forecast, by Segment 3, 2018-2029
Table 24: Middle East & Africa Inhaled Allergens Allergy Diagnostics Market Revenue (USD Billion) Forecast, by Country, 2018-2029
Research Process
Data Library Research are conducted by industry experts who offer insight on
industry structure, market segmentations technology assessment and competitive landscape (CL), and penetration, as well as on emerging trends. Their analysis is based on primary interviews (~ 80%) and secondary research (~ 20%) as well as years of professional expertise in their respective industries. Adding to this, by analysing historical trends and current market positions, our analysts predict where the market will be headed for the next five years. Furthermore, the varying trends of segment & categories geographically presented are also studied and the estimated based on the primary & secondary research.
In this particular report from the supply side Data Library Research has conducted primary surveys (interviews) with the key level executives (VP, CEO’s, Marketing Director, Business Development Manager
and SOFT) of the companies that active & prominent as well as the midsized organization
FIGURE 1: DLR RESEARH PROCESS
![research-methodology1]()
Primary Research
Extensive primary research was conducted to gain a deeper insight of the market and industry performance. The analysis is based on both primary and secondary research as well as years of professional expertise in the respective industries.
In addition to analysing current and historical trends, our analysts predict where the market is headed over the next five years.
It varies by segment for these categories geographically presented in the list of market tables. Speaking about this particular report we have conducted primary surveys (interviews) with the key level executives (VP, CEO’s, Marketing Director, Business Development Manager and many more) of the major players active in the market.
Secondary Research
Secondary research was mainly used to collect and identify information useful for the extensive, technical, market-oriented, and Friend’s study of the Global Extra Neutral Alcohol. It was also used to obtain key information about major players, market classification and segmentation according to the industry trends, geographical markets, and developments related to the market and technology perspectives. For this study, analysts have gathered information from various credible sources, such as annual reports, sec filings, journals, white papers, SOFT presentations, and company web sites.
Market Size Estimation
Both, top-down and bottom-up approaches were used to estimate and validate the size of the Global market and to estimate the size of various other dependent submarkets in the overall Extra Neutral Alcohol. The key players in the market were identified through secondary research and their market contributions in the respective geographies were determined through primary and secondary research.
Forecast Model
![research-methodology2]()