Companion Animal Diagnostics Imaging Market Overview and Analysis:
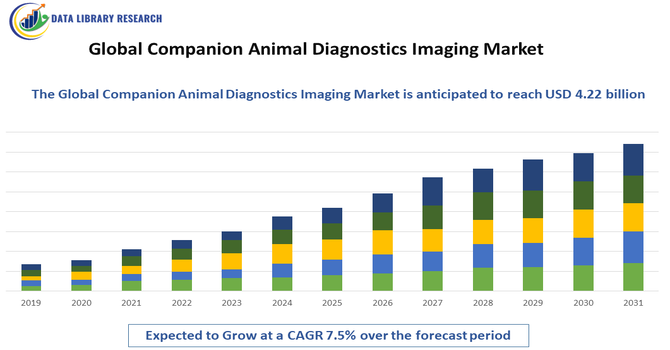
The Global Companion Animal Diagnostics Imaging Market size is expected to grow from USD 2.99 billion in 2025 to USD 4.22 billion by 2032, at a CAGR of 7.5% from 2025-2032.
Get Complete Analysis Of The Report - Download Updated Free Sample PDF
The growth of the global companion animal diagnostics imaging market is being propelled primarily by a rise in companion animal ownership and an increasing willingness among pet owners to invest in advanced veterinary care, which is driving demand for high-quality diagnostic imaging services such as X-ray, ultrasound, CT, and MRI systems. Rising awareness of animal health and longevity, coupled with higher veterinary expenditure and the growing prevalence of chronic and acute diseases in pets, necessitates more frequent and sophisticated imaging diagnostics to accurately detect and manage conditions early.
Companion Animal Diagnostics Imaging Market Latest Trends
In the global companion animal diagnostics imaging market, several key trends are shaping the industry’s evolution, with advanced technological integration and expanding imaging modalities at the forefront. There is an increasing adoption of digital diagnostic imaging technologies—including digital X-rays, CT scans, and AI-augmented imaging tools—that enhance diagnostic accuracy and speed while supporting better clinical decision-making in veterinary care. AI and machine-learning applications are rapidly being incorporated to improve image interpretation, automate anomaly detection, and streamline workflows, reflecting a broader shift toward intelligent diagnostics within veterinary imaging. The market is also witnessing growing demand driven by higher pet ownership rates and greater pet health spending, as companion animals are more frequently treated with human-equivalent care standards, bolstering the uptake of sophisticated imaging services.
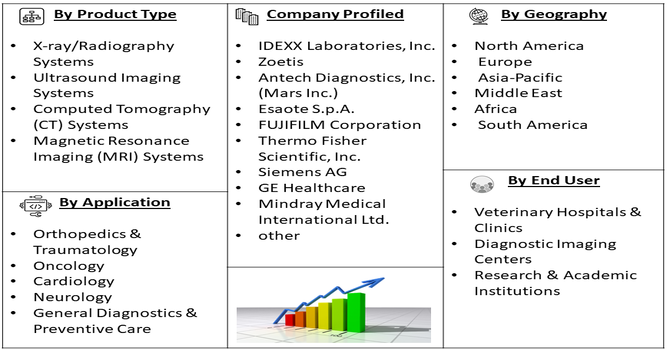
Segmentation: Global Companion Animal Diagnostics Imaging Market is segmented by Product Type (X-ray/Radiography Systems, Ultrasound Imaging Systems, Computed Tomography (CT) Systems, Magnetic Resonance Imaging (MRI) Systems), Imaging Modality (Fixed/Stationary Imaging Systems and Portable/Mobile Imaging Systems), Application (Orthopedics & Traumatology, Oncology, Cardiology, Neurology, and General Diagnostics & Preventive Care), End User (Veterinary Hospitals & Clinics, Diagnostic Imaging Centers, and Research & Academic Institutions), and Geography (North America, Europe, Asia-Pacific, Middle East and Africa, and South America). The report provides the value (in USD million) for the above segments.
For Detailed Market Segmentation - Get a Free Sample PDF
Market Drivers:
- Rising Pet Ownership and Increased Veterinary Healthcare Spending
The primary drivers of the companion animal diagnostics imaging market is the significant global increase in companion animal ownership, particularly in regions like North America, Europe, and increasingly in Asia Pacific. As more households adopt pets—especially dogs and cats—there is a corresponding rise in demand for comprehensive healthcare services, including advanced diagnostic imaging. Pet owners today are more willing to invest in high-quality veterinary care, treating their animals as family members and opting for timely, accurate diagnostics to support early disease detection and better health outcomes. This trend boosts the adoption of advanced imaging modalities such as digital X-rays, ultrasound, CT scans, and MRI systems in veterinary clinics and hospitals worldwide. Increased expenditure on pet health, driven by higher disposable incomes and greater awareness of animal wellness, directly contributes to growth in diagnostic imaging utilization.
- Technological Advancements in Imaging Equipment and Diagnostics
Another key market driver is the continual technological evolution in veterinary imaging technologies that enhances diagnostic precision, efficiency, and accessibility. Innovations such as digital radiography, portable imaging systems, and AI-augmented image interpretation tools are improving the quality and speed of diagnoses while enabling veterinarians to detect conditions earlier and more accurately. These advancements also make imaging tools more adaptable for use in diverse clinical settings, from large hospitals to small animal clinics. The integration of advanced software and connectivity—such as cloud-based image storage and telemedicine support—further expands the utility and appeal of these imaging solutions. As veterinary practices upgrade their diagnostic capabilities to meet rising expectations for pet care, technological progress continues to act as a strong growth catalyst for the market.
Market Restraints:
- High Cost of Advanced Imaging Equipment and Procedures
The major restraints limiting the growth of the companion animal diagnostics imaging market is the high capital and operational cost associated with advanced imaging technologies such as CT and MRI systems. These systems require significant upfront investment, specialized installation, and regular maintenance, making them financially challenging for small and mid-sized veterinary clinics, particularly in developing regions. In addition, imaging procedures often involve high service costs, including anesthesia, trained personnel, and equipment upkeep, which can discourage pet owners from opting for advanced diagnostics due to affordability concerns. Limited reimbursement coverage and uneven adoption of pet insurance in many regions further exacerbate this issue, restricting widespread market penetration of high-end imaging solutions.
Socioeconomic Impact on Companion Animal Diagnostics Imaging Market
The Global Companion Animal Diagnostics Imaging Market has significant socioeconomic impact by enhancing veterinary care, improving early disease detection, and increasing treatment success rates for pets. Advanced imaging technologies, such as X-ray, ultrasound, CT, and MRI, enable veterinarians to accurately diagnose conditions, reducing treatment costs and preventing prolonged animal suffering. Market growth stimulates investment in veterinary clinics, imaging equipment manufacturing, and skilled workforce development, generating employment opportunities and supporting economic activity. Additionally, improved pet health contributes to the well-being of pet owners and strengthens the human-animal bond. Rising pet ownership and willingness to invest in advanced diagnostics further drive market expansion globally.
Segmental Analysis:
- X-ray/Radiography Systems segment is expected to witness highest growth over the forecast period
X-ray and radiography systems represent a widely adopted segment due to their cost-effectiveness, ease of use, and broad application in diagnosing fractures, joint disorders, dental conditions, and thoracic abnormalities in companion animals. These systems are commonly installed across veterinary clinics and hospitals, supporting routine and emergency diagnostics and contributing significantly to overall market value.
- Portable/Mobile Imaging Systems segment is expected to witness highest growth over the forecast period
Portable and mobile imaging systems are gaining strong traction as they offer flexibility, point-of-care diagnostics, and ease of use in small clinics and emergency settings. Their growing adoption supports faster diagnosis and improved workflow efficiency, particularly in practices with limited space or infrastructure.
- Orthopedics & Traumatology segment is expected to witness highest growth over the forecast period
Orthopedics and traumatology account for a major application segment, driven by the high incidence of bone fractures, ligament injuries, and musculoskeletal disorders in companion animals. Imaging plays a critical role in accurate diagnosis, surgical planning, and post-treatment monitoring, supporting consistent demand.
- Veterinary Hospitals & Clinics segment is expected to witness highest growth over the forecast period
Veterinary hospitals and clinics dominate end-user adoption as they are primary providers of diagnostic and therapeutic services. Increasing investments in advanced imaging infrastructure and rising patient volumes strengthen their contribution to market revenue.
Increasing investments in modern imaging infrastructure, coupled with rising patient volumes due to higher pet ownership and awareness of preventive healthcare, further strengthened their market contribution. Additionally, skilled veterinary professionals and integrated diagnostic services enhanced operational efficiency and service quality, collectively driving revenue growth and solidifying hospitals and clinics as the leading end-users in the global companion animal diagnostics imaging market.
- North America segment is expected to witness highest growth over the forecast period
North America holds a significant share due to advanced veterinary healthcare infrastructure, high pet ownership, strong adoption of imaging technologies, and greater spending on companion animal diagnostics, contributing substantially to market.
The region’s veterinary clinics and hospitals are well-equipped with modern imaging technologies, including X-ray, ultrasound, CT, and MRI, facilitating accurate diagnosis and improved treatment outcomes. For instance, in January 2023, The surge in pet adoptions across the U.S. drove increased demand for veterinary imaging services. In response, Esaote North America launched the Magnifico™ Vet MRI system, offering enhanced diagnostic capabilities across diverse veterinary settings. This innovation supported improved disease detection, elevated clinical efficiency, and contributed to growth in the Global Companion Animal Diagnostics Imaging Market.
Strong adoption of these advanced diagnostic tools, coupled with greater expenditure on companion animal health, further fueled market growth. Additionally, rising awareness among pet owners regarding preventive healthcare and early disease detection contributed to increased demand. The combination of technological adoption, consumer spending, and robust veterinary services significantly reinforced North America’s leading position in the market.
| Report Matrics |
Details |
| Market Size Value |
USD 4.22 billion |
| Growth Rate |
CAGR of 7.5 % |
| Forecast |
2026-2033 |
| Historical data |
2021-2024 |
| Base Year |
2025 |
| Report Coverage |
Forecasted revenue, company rating, competitive environment, growth drivers, and trends |
| Segment Coverage |
Type, Application, End-User, Geography |
| Regional Scope |
North America, Europe, Asia Pacific, Middle East |
| Customized scope |
Free customization of reports (With 3 months' Analysis Support ) |
| To Learn More About This Report |
Request a Free Sample Copy |
Companion Animal Diagnostics Imaging Market Competitive Landscape
The competitive landscape of the global companion animal diagnostics imaging market is characterized by the presence of numerous multinational corporations and specialized veterinary imaging providers that focus on technological innovation, broad product portfolios, strategic partnerships, and global distribution networks to enhance their market position. Key players are investing in advanced imaging solutions such as digital X-ray, ultrasound, CT, and MRI systems customized for veterinary applications, while also expanding service offerings and after-sales support to meet the growing demand for accurate and efficient diagnostics in companion animals. The competitive environment is further shaped by mergers and acquisitions, collaborations with veterinary clinics, and continuous R&D to introduce high-performance, user-friendly diagnostic imaging equipment that supports improved animal healthcare outcomes.
Key Companies in the Market:
- IDEXX Laboratories, Inc.
- Zoetis
- Antech Diagnostics, Inc. (Mars Inc.)
- Esaote S.p.A.
- FUJIFILM Corporation
- Thermo Fisher Scientific, Inc.
- Siemens AG
- GE Healthcare
- Mindray Medical International Ltd.
- Carestream Health
- Hallmarq Ltd.
- IMV Technologies Group
- MinXray, Inc.
- Universal Medical Systems, Inc.
- Agfa-Gevaert N.V.
- Samsung Medison
- Canon Medical Systems Corporation
- Hitachi Medical Systems
- Philips Healthcare
- VetRay, Inc.
Recent Development
- In May 2025, Antech launched trūRapid FOUR, an in-house canine vector-borne disease screening test, enabling rapid detection of antibodies for Anaplasma, Ehrlichia, Lyme disease, and heartworm antigens. This innovation enhanced diagnostic efficiency in veterinary practices, improved early disease detection, and reinforced market growth, strengthening the Global Companion Animal Diagnostics Imaging Market through advanced, accessible canine diagnostic solutions.
- . In May 2024, Esaote Group launched the MyLabFOX, a versatile ultrasound system designed for veterinary practices. This adaptable solution featured enhanced workflow tools like “Easy Mode & Easy Color” and AI-powered technologies, including “AutoEF” and “XStrain,” which improved diagnostic efficiency and enabled swift, precise examinations, driving growth in the Global Companion Animal Diagnostics Imaging Market.
Frequently Asked Questions (FAQ) :
Q1. What are the main growth-driving factors for this market?
The market is growing because people now view pets as family members and are willing to spend more on their health. There is a rising number of older pets suffering from age-related diseases like cancer and heart issues. Additionally, better pet insurance coverage makes expensive tests like MRIs and CT scans more affordable for average pet owners.
Q2. What are the main restraining factors for this market?
Growth is limited by the very high cost of purchasing and maintaining advanced imaging machines for small veterinary clinics. There is also a global shortage of specialized veterinary radiologists who are trained to read complex scans. Furthermore, some imaging procedures require pets to be put under anesthesia, which carries risks that concern pet owners.
Q3. Which segment is expected to witness high growth?
The Veterinary Ultrasound segment is expected to see the highest growth. It is popular because it is non-invasive, does not use radiation, and is usually cheaper than an MRI. New portable and handheld ultrasound devices are becoming common, allowing vets to perform quick checks in the exam room rather than sending pets to hospitals.
Q4. Who are the top major players for this market?
The market is led by companies that often adapt human medical technology for animals. Key players include IDEXX Laboratories, Zoetis (Heska), GE Healthcare, Siemens Healthineers, and Fujifilm Holdings. These companies dominate by providing digital systems that allow vets to share images instantly with specialists around the world for a second opinion.
Q5. Which country is the largest player?
The United States is the largest player in this market. It has the world’s highest rate of pet ownership and a very mature veterinary healthcare system. American pet owners spend billions annually on advanced medical care, and the country is home to the most advanced animal hospitals and veterinary research universities in the world.
List of Figures
Figure 1: Global Companion Animal Diagnostics Imaging Market Revenue Breakdown (USD Billion, %) by Region, 2022 & 2029
Figure 2: Global Companion Animal Diagnostics Imaging Market Value Share (%), By Segment 1, 2022 & 2029
Figure 3: Global Companion Animal Diagnostics Imaging Market Forecast (USD Billion), by Sub-Segment 1, 2018-2029
Figure 4: Global Companion Animal Diagnostics Imaging Market Forecast (USD Billion), by Sub-Segment 2, 2018-2029
Figure 5: Global Companion Animal Diagnostics Imaging Market Value Share (%), By Segment 2, 2022 & 2029
Figure 6: Global Companion Animal Diagnostics Imaging Market Forecast (USD Billion), by Sub-Segment 1, 2018-2029
Figure 7: Global Companion Animal Diagnostics Imaging Market Forecast (USD Billion), by Sub-Segment 2, 2018-2029
Figure 8: Global Companion Animal Diagnostics Imaging Market Forecast (USD Billion), by Sub-Segment 3, 2018-2029
Figure 9: Global Companion Animal Diagnostics Imaging Market Forecast (USD Billion), by Others, 2018-2029
Figure 10: Global Companion Animal Diagnostics Imaging Market Value Share (%), By Segment 3, 2022 & 2029
Figure 11: Global Companion Animal Diagnostics Imaging Market Forecast (USD Billion), by Sub-Segment 1, 2018-2029
Figure 12: Global Companion Animal Diagnostics Imaging Market Forecast (USD Billion), by Sub-Segment 2, 2018-2029
Figure 13: Global Companion Animal Diagnostics Imaging Market Forecast (USD Billion), by Sub-Segment 3, 2018-2029
Figure 14: Global Companion Animal Diagnostics Imaging Market Forecast (USD Billion), by Others, 2018-2029
Figure 15: Global Companion Animal Diagnostics Imaging Market Value (USD Billion), by Region, 2022 & 2029
Figure 16: North America Companion Animal Diagnostics Imaging Market Value Share (%), By Segment 1, 2022 & 2029
Figure 17: North America Companion Animal Diagnostics Imaging Market Forecast (USD Billion), by Sub-Segment 1, 2018-2029
Figure 18: North America Companion Animal Diagnostics Imaging Market Forecast (USD Billion), by Sub-Segment 2, 2018-2029
Figure 19: North America Companion Animal Diagnostics Imaging Market Value Share (%), By Segment 2, 2022 & 2029
Figure 20: North America Companion Animal Diagnostics Imaging Market Forecast (USD Billion), by Sub-Segment 1, 2018-2029
Figure 21: North America Companion Animal Diagnostics Imaging Market Forecast (USD Billion), by Sub-Segment 2, 2018-2029
Figure 22: North America Companion Animal Diagnostics Imaging Market Forecast (USD Billion), by Sub-Segment 3, 2018-2029
Figure 23: North America Companion Animal Diagnostics Imaging Market Forecast (USD Billion), by Others, 2018-2029
Figure 24: North America Companion Animal Diagnostics Imaging Market Value Share (%), By Segment 3, 2022 & 2029
Figure 25: North America Companion Animal Diagnostics Imaging Market Forecast (USD Billion), by Sub-Segment 1, 2018-2029
Figure 26: North America Companion Animal Diagnostics Imaging Market Forecast (USD Billion), by Sub-Segment 2, 2018-2029
Figure 27: North America Companion Animal Diagnostics Imaging Market Forecast (USD Billion), by Sub-Segment 3, 2018-2029
Figure 28: North America Companion Animal Diagnostics Imaging Market Forecast (USD Billion), by Others, 2018-2029
Figure 29: North America Companion Animal Diagnostics Imaging Market Forecast (USD Billion), by U.S., 2018-2029
Figure 30: North America Companion Animal Diagnostics Imaging Market Forecast (USD Billion), by Canada, 2018-2029
Figure 31: Latin America Companion Animal Diagnostics Imaging Market Value Share (%), By Segment 1, 2022 & 2029
Figure 32: Latin America Companion Animal Diagnostics Imaging Market Forecast (USD Billion), by Sub-Segment 1, 2018-2029
Figure 33: Latin America Companion Animal Diagnostics Imaging Market Forecast (USD Billion), by Sub-Segment 2, 2018-2029
Figure 34: Latin America Companion Animal Diagnostics Imaging Market Value Share (%), By Segment 2, 2022 & 2029
Figure 35: Latin America Companion Animal Diagnostics Imaging Market Forecast (USD Billion), by Sub-Segment 1, 2018-2029
Figure 36: Latin America Companion Animal Diagnostics Imaging Market Forecast (USD Billion), by Sub-Segment 2, 2018-2029
Figure 37: Latin America Companion Animal Diagnostics Imaging Market Forecast (USD Billion), by Sub-Segment 3, 2018-2029
Figure 38: Latin America Companion Animal Diagnostics Imaging Market Forecast (USD Billion), by Others, 2018-2029
Figure 39: Latin America Companion Animal Diagnostics Imaging Market Value Share (%), By Segment 3, 2022 & 2029
Figure 40: Latin America Companion Animal Diagnostics Imaging Market Forecast (USD Billion), by Sub-Segment 1, 2018-2029
Figure 41: Latin America Companion Animal Diagnostics Imaging Market Forecast (USD Billion), by Sub-Segment 2, 2018-2029
Figure 42: Latin America Companion Animal Diagnostics Imaging Market Forecast (USD Billion), by Sub-Segment 3, 2018-2029
Figure 43: Latin America Companion Animal Diagnostics Imaging Market Forecast (USD Billion), by Others, 2018-2029
Figure 44: Latin America Companion Animal Diagnostics Imaging Market Forecast (USD Billion), by Brazil, 2018-2029
Figure 45: Latin America Companion Animal Diagnostics Imaging Market Forecast (USD Billion), by Mexico, 2018-2029
Figure 46: Latin America Companion Animal Diagnostics Imaging Market Forecast (USD Billion), by Rest of Latin America, 2018-2029
Figure 47: Europe Companion Animal Diagnostics Imaging Market Value Share (%), By Segment 1, 2022 & 2029
Figure 48: Europe Companion Animal Diagnostics Imaging Market Forecast (USD Billion), by Sub-Segment 1, 2018-2029
Figure 49: Europe Companion Animal Diagnostics Imaging Market Forecast (USD Billion), by Sub-Segment 2, 2018-2029
Figure 50: Europe Companion Animal Diagnostics Imaging Market Value Share (%), By Segment 2, 2022 & 2029
Figure 51: Europe Companion Animal Diagnostics Imaging Market Forecast (USD Billion), by Sub-Segment 1, 2018-2029
Figure 52: Europe Companion Animal Diagnostics Imaging Market Forecast (USD Billion), by Sub-Segment 2, 2018-2029
Figure 53: Europe Companion Animal Diagnostics Imaging Market Forecast (USD Billion), by Sub-Segment 3, 2018-2029
Figure 54: Europe Companion Animal Diagnostics Imaging Market Forecast (USD Billion), by Others, 2018-2029
Figure 55: Europe Companion Animal Diagnostics Imaging Market Value Share (%), By Segment 3, 2022 & 2029
Figure 56: Europe Companion Animal Diagnostics Imaging Market Forecast (USD Billion), by Sub-Segment 1, 2018-2029
Figure 57: Europe Companion Animal Diagnostics Imaging Market Forecast (USD Billion), by Sub-Segment 2, 2018-2029
Figure 58: Europe Companion Animal Diagnostics Imaging Market Forecast (USD Billion), by Sub-Segment 3, 2018-2029
Figure 59: Europe Companion Animal Diagnostics Imaging Market Forecast (USD Billion), by Others, 2018-2029
Figure 60: Europe Companion Animal Diagnostics Imaging Market Forecast (USD Billion), by U.K., 2018-2029
Figure 61: Europe Companion Animal Diagnostics Imaging Market Forecast (USD Billion), by Germany, 2018-2029
Figure 62: Europe Companion Animal Diagnostics Imaging Market Forecast (USD Billion), by France, 2018-2029
Figure 63: Europe Companion Animal Diagnostics Imaging Market Forecast (USD Billion), by Italy, 2018-2029
Figure 64: Europe Companion Animal Diagnostics Imaging Market Forecast (USD Billion), by Spain, 2018-2029
Figure 65: Europe Companion Animal Diagnostics Imaging Market Forecast (USD Billion), by Russia, 2018-2029
Figure 66: Europe Companion Animal Diagnostics Imaging Market Forecast (USD Billion), by Rest of Europe, 2018-2029
Figure 67: Asia Pacific Companion Animal Diagnostics Imaging Market Value Share (%), By Segment 1, 2022 & 2029
Figure 68: Asia Pacific Companion Animal Diagnostics Imaging Market Forecast (USD Billion), by Sub-Segment 1, 2018-2029
Figure 69: Asia Pacific Companion Animal Diagnostics Imaging Market Forecast (USD Billion), by Sub-Segment 2, 2018-2029
Figure 70: Asia Pacific Companion Animal Diagnostics Imaging Market Value Share (%), By Segment 2, 2022 & 2029
Figure 71: Asia Pacific Companion Animal Diagnostics Imaging Market Forecast (USD Billion), by Sub-Segment 1, 2018-2029
Figure 72: Asia Pacific Companion Animal Diagnostics Imaging Market Forecast (USD Billion), by Sub-Segment 2, 2018-2029
Figure 73: Asia Pacific Companion Animal Diagnostics Imaging Market Forecast (USD Billion), by Sub-Segment 3, 2018-2029
Figure 74: Asia Pacific Companion Animal Diagnostics Imaging Market Forecast (USD Billion), by Others, 2018-2029
Figure 75: Asia Pacific Companion Animal Diagnostics Imaging Market Value Share (%), By Segment 3, 2022 & 2029
Figure 76: Asia Pacific Companion Animal Diagnostics Imaging Market Forecast (USD Billion), by Sub-Segment 1, 2018-2029
Figure 77: Asia Pacific Companion Animal Diagnostics Imaging Market Forecast (USD Billion), by Sub-Segment 2, 2018-2029
Figure 78: Asia Pacific Companion Animal Diagnostics Imaging Market Forecast (USD Billion), by Sub-Segment 3, 2018-2029
Figure 79: Asia Pacific Companion Animal Diagnostics Imaging Market Forecast (USD Billion), by Others, 2018-2029
Figure 80: Asia Pacific Companion Animal Diagnostics Imaging Market Forecast (USD Billion), by China, 2018-2029
Figure 81: Asia Pacific Companion Animal Diagnostics Imaging Market Forecast (USD Billion), by India, 2018-2029
Figure 82: Asia Pacific Companion Animal Diagnostics Imaging Market Forecast (USD Billion), by Japan, 2018-2029
Figure 83: Asia Pacific Companion Animal Diagnostics Imaging Market Forecast (USD Billion), by Australia, 2018-2029
Figure 84: Asia Pacific Companion Animal Diagnostics Imaging Market Forecast (USD Billion), by Southeast Asia, 2018-2029
Figure 85: Asia Pacific Companion Animal Diagnostics Imaging Market Forecast (USD Billion), by Rest of Asia Pacific, 2018-2029
Figure 86: Middle East & Africa Companion Animal Diagnostics Imaging Market Value Share (%), By Segment 1, 2022 & 2029
Figure 87: Middle East & Africa Companion Animal Diagnostics Imaging Market Forecast (USD Billion), by Sub-Segment 1, 2018-2029
Figure 88: Middle East & Africa Companion Animal Diagnostics Imaging Market Forecast (USD Billion), by Sub-Segment 2, 2018-2029
Figure 89: Middle East & Africa Companion Animal Diagnostics Imaging Market Value Share (%), By Segment 2, 2022 & 2029
Figure 90: Middle East & Africa Companion Animal Diagnostics Imaging Market Forecast (USD Billion), by Sub-Segment 1, 2018-2029
Figure 91: Middle East & Africa Companion Animal Diagnostics Imaging Market Forecast (USD Billion), by Sub-Segment 2, 2018-2029
Figure 92: Middle East & Africa Companion Animal Diagnostics Imaging Market Forecast (USD Billion), by Sub-Segment 3, 2018-2029
Figure 93: Middle East & Africa Companion Animal Diagnostics Imaging Market Forecast (USD Billion), by Others, 2018-2029
Figure 94: Middle East & Africa Companion Animal Diagnostics Imaging Market Value Share (%), By Segment 3, 2022 & 2029
Figure 95: Middle East & Africa Companion Animal Diagnostics Imaging Market Forecast (USD Billion), by Sub-Segment 1, 2018-2029
Figure 96: Middle East & Africa Companion Animal Diagnostics Imaging Market Forecast (USD Billion), by Sub-Segment 2, 2018-2029
Figure 97: Middle East & Africa Companion Animal Diagnostics Imaging Market Forecast (USD Billion), by Sub-Segment 3, 2018-2029
Figure 98: Middle East & Africa Companion Animal Diagnostics Imaging Market Forecast (USD Billion), by Others, 2018-2029
Figure 99: Middle East & Africa Companion Animal Diagnostics Imaging Market Forecast (USD Billion), by GCC, 2018-2029
Figure 100: Middle East & Africa Companion Animal Diagnostics Imaging Market Forecast (USD Billion), by South Africa, 2018-2029
Figure 101: Middle East & Africa Companion Animal Diagnostics Imaging Market Forecast (USD Billion), by Rest of Middle East & Africa, 2018-2029
List of Tables
Table 1: Global Companion Animal Diagnostics Imaging Market Revenue (USD Billion) Forecast, by Segment 1, 2018-2029
Table 2: Global Companion Animal Diagnostics Imaging Market Revenue (USD Billion) Forecast, by Segment 2, 2018-2029
Table 3: Global Companion Animal Diagnostics Imaging Market Revenue (USD Billion) Forecast, by Segment 3, 2018-2029
Table 4: Global Companion Animal Diagnostics Imaging Market Revenue (USD Billion) Forecast, by Region, 2018-2029
Table 5: North America Companion Animal Diagnostics Imaging Market Revenue (USD Billion) Forecast, by Segment 1, 2018-2029
Table 6: North America Companion Animal Diagnostics Imaging Market Revenue (USD Billion) Forecast, by Segment 2, 2018-2029
Table 7: North America Companion Animal Diagnostics Imaging Market Revenue (USD Billion) Forecast, by Segment 3, 2018-2029
Table 8: North America Companion Animal Diagnostics Imaging Market Revenue (USD Billion) Forecast, by Country, 2018-2029
Table 9: Europe Companion Animal Diagnostics Imaging Market Revenue (USD Billion) Forecast, by Segment 1, 2018-2029
Table 10: Europe Companion Animal Diagnostics Imaging Market Revenue (USD Billion) Forecast, by Segment 2, 2018-2029
Table 11: Europe Companion Animal Diagnostics Imaging Market Revenue (USD Billion) Forecast, by Segment 3, 2018-2029
Table 12: Europe Companion Animal Diagnostics Imaging Market Revenue (USD Billion) Forecast, by Country, 2018-2029
Table 13: Latin America Companion Animal Diagnostics Imaging Market Revenue (USD Billion) Forecast, by Segment 1, 2018-2029
Table 14: Latin America Companion Animal Diagnostics Imaging Market Revenue (USD Billion) Forecast, by Segment 2, 2018-2029
Table 15: Latin America Companion Animal Diagnostics Imaging Market Revenue (USD Billion) Forecast, by Segment 3, 2018-2029
Table 16: Latin America Companion Animal Diagnostics Imaging Market Revenue (USD Billion) Forecast, by Country, 2018-2029
Table 17: Asia Pacific Companion Animal Diagnostics Imaging Market Revenue (USD Billion) Forecast, by Segment 1, 2018-2029
Table 18: Asia Pacific Companion Animal Diagnostics Imaging Market Revenue (USD Billion) Forecast, by Segment 2, 2018-2029
Table 19: Asia Pacific Companion Animal Diagnostics Imaging Market Revenue (USD Billion) Forecast, by Segment 3, 2018-2029
Table 20: Asia Pacific Companion Animal Diagnostics Imaging Market Revenue (USD Billion) Forecast, by Country, 2018-2029
Table 21: Middle East & Africa Companion Animal Diagnostics Imaging Market Revenue (USD Billion) Forecast, by Segment 1, 2018-2029
Table 22: Middle East & Africa Companion Animal Diagnostics Imaging Market Revenue (USD Billion) Forecast, by Segment 2, 2018-2029
Table 23: Middle East & Africa Companion Animal Diagnostics Imaging Market Revenue (USD Billion) Forecast, by Segment 3, 2018-2029
Table 24: Middle East & Africa Companion Animal Diagnostics Imaging Market Revenue (USD Billion) Forecast, by Country, 2018-2029
Research Process
Data Library Research are conducted by industry experts who offer insight on
industry structure, market segmentations technology assessment and competitive landscape (CL), and penetration, as well as on emerging trends. Their analysis is based on primary interviews (~ 80%) and secondary research (~ 20%) as well as years of professional expertise in their respective industries. Adding to this, by analysing historical trends and current market positions, our analysts predict where the market will be headed for the next five years. Furthermore, the varying trends of segment & categories geographically presented are also studied and the estimated based on the primary & secondary research.
In this particular report from the supply side Data Library Research has conducted primary surveys (interviews) with the key level executives (VP, CEO’s, Marketing Director, Business Development Manager
and SOFT) of the companies that active & prominent as well as the midsized organization
FIGURE 1: DLR RESEARH PROCESS
![research-methodology1]()
Primary Research
Extensive primary research was conducted to gain a deeper insight of the market and industry performance. The analysis is based on both primary and secondary research as well as years of professional expertise in the respective industries.
In addition to analysing current and historical trends, our analysts predict where the market is headed over the next five years.
It varies by segment for these categories geographically presented in the list of market tables. Speaking about this particular report we have conducted primary surveys (interviews) with the key level executives (VP, CEO’s, Marketing Director, Business Development Manager and many more) of the major players active in the market.
Secondary Research
Secondary research was mainly used to collect and identify information useful for the extensive, technical, market-oriented, and Friend’s study of the Global Extra Neutral Alcohol. It was also used to obtain key information about major players, market classification and segmentation according to the industry trends, geographical markets, and developments related to the market and technology perspectives. For this study, analysts have gathered information from various credible sources, such as annual reports, sec filings, journals, white papers, SOFT presentations, and company web sites.
Market Size Estimation
Both, top-down and bottom-up approaches were used to estimate and validate the size of the Global market and to estimate the size of various other dependent submarkets in the overall Extra Neutral Alcohol. The key players in the market were identified through secondary research and their market contributions in the respective geographies were determined through primary and secondary research.
Forecast Model
![research-methodology2]()