Intelligent Urinal Market Overview and Analysis:

The Global Intelligent Urinal Market was valued at 1.25 billion in 2025 and is projected to reach 3.8 billion by 2032, growing at a compound 9.6% from 2025-2032.

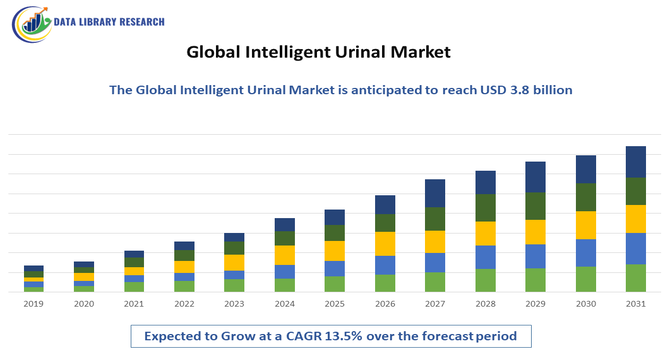
The Global Intelligent Urinal Market refers to the industry focused on smart urinal systems equipped with sensors, automated flushing, water-saving features, and hygiene-monitoring technologies. These urinals are increasingly adopted in commercial, public, and institutional facilities, driven by demand for water efficiency, sanitation improvements, and integration with smart building and IoT solutions.

The growth of the global intelligent urinal market is driven by increasing awareness of water conservation, rising demand for hygiene and sanitation in public and commercial spaces, and the adoption of smart building technologies. Technological advancements, such as sensor-based flushing, IoT integration, and maintenance monitoring, further propel market expansion by enhancing efficiency, convenience, and sustainability.

Intelligent Urinal Market Latest Trends

The global intelligent urinal market has experienced significant growth due to rising demand for water-efficient, hygiene-focused sanitation solutions in commercial, institutional, and public facilities. Key trends include sensor-based flushing systems, IoT connectivity, and real-time usage analytics, allowing for remote monitoring, predictive maintenance, and optimized water consumption. Touchless operation, antimicrobial materials, and seamless integration into smart building and smart-city infrastructure are increasingly prioritized.

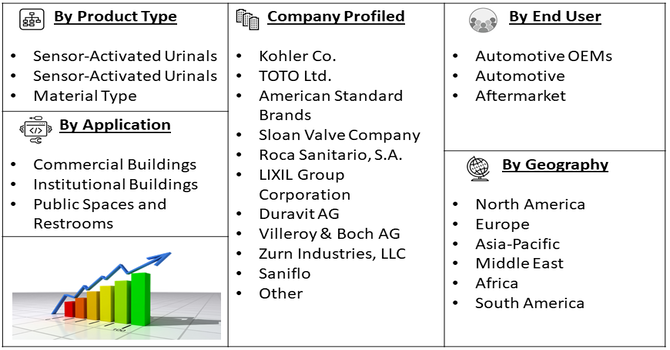
Segmentation: The Global Intelligent Urinal Market is segmented by Product Type (Sensor-Activated Urinals, Sensor-Activated Urinals, and Material Type), Application (Commercial Buildings, Institutional Buildings and Public Spaces and Restrooms), and Geography (North America, Europe, Asia-Pacific, Middle East and Africa, and South America). The report provides the value (in USD million) for the above segments.

Market Drivers:

  • Rising Demand for Water Conservation

The global intelligent urinal market is significantly driven by increasing emphasis on water conservation. Intelligent urinals feature sensor-based, automated flushing systems that optimize water usage by reducing unnecessary flushing, helping commercial, public, and institutional facilities save substantial amounts of water. Governments and environmental agencies worldwide are promoting sustainable water management practices, encouraging the adoption of water-efficient fixtures. Rising awareness of environmental sustainability among consumers and facility managers has further accelerated deployment. As urban populations grow and water scarcity becomes a critical concern, intelligent urinals are seen as essential for efficient, eco-friendly sanitation solutions.

  • Growing Focus on Hygiene and Smart Building Integration

The market is also propelled by the increasing demand for enhanced hygiene standards and integration with smart building infrastructure. Intelligent urinals offer touchless operation, antimicrobial materials, and real-time monitoring, reducing the spread of germs in high-traffic areas. Their compatibility with IoT and building management systems enables remote monitoring, predictive maintenance, and data-driven facility management.

In November 2025, AceLife strengthened the global intelligent urinal market and smart building integration by achieving U.S. UPC certification for its TREVI Smart Toilet, the first Korean product to do so. Meeting stringent water-saving and plumbing standards, the certification underscored the product’s hygiene and efficiency credentials, boosting confidence in smart, sustainable restroom solutions and encouraging broader adoption worldwide. This combination of convenience, safety, and operational efficiency is driving the global intelligent urinal market’s rapid growth, particularly in urbanized and technologically advanced regions.

Market Restraints:

  • High Initial Cost and Installation Complexity

Despite the advantages, the global intelligent urinal market faces restraints due to high initial costs and installation complexity. Advanced features like sensors, IoT connectivity, and automated flushing significantly increase purchase and maintenance expenses compared to conventional urinals. Installation often requires specialized plumbing and integration with building management systems, posing challenges for small businesses or budget-conscious facilities. Additionally, the cost of replacement parts and periodic maintenance can deter adoption in developing regions.

Socioeconomic Impact on Intelligent Urinal Market

The Intelligent urinals have a notable socioeconomic impact by improving public health, conserving water resources, and reducing operational costs in high-traffic facilities. Their adoption enhances hygiene standards in airports, hospitals, offices, and commercial buildings, which directly benefits occupants and visitors. Reduced water usage lowers utility expenses and supports environmental sustainability, particularly in regions facing water scarcity. The deployment of these smart sanitation systems also promotes modernization in urban infrastructure, contributing to safer, cleaner, and more efficient public and commercial environments. Thus, the technology supports sustainable development goals while improving both economic efficiency and quality of life.

Segmental Analysis:

  • Sensor-Activated Urinals segment is expected to witness highest growth over the forecast period

The sensor-activated urinals segment is expected to witness the highest growth over the forecast period due to rising demand for hygiene, water efficiency, and convenience in public and commercial restrooms. These urinals automatically flush only when used, significantly reducing water consumption compared to traditional systems while minimizing the spread of germs through touchless operation. Increasing awareness of sustainability and sanitation, coupled with the integration of smart technologies in modern facilities, has accelerated their adoption globally. High-traffic areas such as airports, hospitals, shopping malls, and office complexes benefit particularly from these systems, as they reduce maintenance requirements, improve user experience, and support facility managers in achieving environmental and operational efficiency goals.

  • Commercial Buildings segment is expected to witness highest growth over the forecast period

The commercial buildings segment, including offices, hospitals, hotels, airports, and shopping malls, is expected to experience the highest growth due to the need for efficient, hygienic, and sustainable sanitation solutions. Intelligent urinals offer automated flushing, water conservation, and reduced maintenance, making them ideal for high-footfall areas. Companies and institutions increasingly implement smart sanitary fixtures to meet sustainability standards and green-building certification requirements. The growing emphasis on user comfort, operational efficiency, and environmental responsibility in commercial infrastructure has made intelligent urinals a preferred choice. As new construction and modernization projects expand, the adoption of these systems in commercial buildings is expected to remain a key driver of market growth worldwide.

  • Asia-Pacific Region segment is expected to witness highest growth over the forecast period

The Asia-Pacific region is projected to witness the fastest growth in the intelligent urinal market due to rapid urbanization, increasing infrastructure development, and growing awareness of hygiene and water conservation. For instance, in November 2025, Professor Park Seung-min advanced the Asia-Pacific intelligent urinal market by developing the region’s first smart toilet capable of diagnosing colorectal cancer through stool DNA analysis. This innovative health-focused technology highlighted the potential for intelligent restroom systems to provide diagnostic and wellness benefits, attracting research funding and accelerating adoption of advanced smart urinal and toilet solutions across the Asia-Pacific region.

Governments and developers are increasingly incorporating smart restroom solutions in commercial and public facilities, aligning with smart-city initiatives and sustainability goals. Rising disposable incomes and modernization in high-traffic areas such as airports, malls, hospitals, and offices are driving demand for advanced, touchless sanitation systems.

Additionally, increasing environmental regulations and the push for water-efficient solutions further accelerate adoption. For instance, in July 2025, Toto Ltd. influenced the Asia-Pacific intelligent urinal market by launching Japan’s first home-use toilet capable of analyzing stool quantity, consistency, and other health indicators. Coupled with a smartphone app for tracking daily metrics, this innovation catered to health-conscious consumers, demonstrating the potential of intelligent restroom technologies to integrate wellness monitoring and driving adoption of advanced smart urinals across the region. As a result, intelligent urinal technologies are gaining strong traction across both urban and emerging markets within the Asia-Pacific region.

Intelligent Urinal Market Competitive Landscape:

The competitive landscape of the intelligent urinal market features established sanitaryware manufacturers and emerging technology providers focusing on sensors, IoT integration, and water-management innovations. Companies compete based on advanced features such as automated flushing, analytics, self-cleaning, and connectivity, as well as adherence to water-efficiency and green-building standards. The market is increasingly driven by large-scale installations in airports, shopping malls, office complexes, and public facilities, prompting continuous innovation in design and technology. Strategic collaborations, product differentiation, and investments in research and development are key competitive strategies, as manufacturers seek to expand market share and meet growing demand for sustainable, intelligent restroom solutions globally.

The major players for above market are:

  • Kohler Co.
  • TOTO Ltd.
  • American Standard Brands
  • Sloan Valve Company
  • Roca Sanitario, S.A.
  • LIXIL Group Corporation
  • Duravit AG
  • Villeroy & Boch AG
  • Zurn Industries, LLC
  • Geberit AG
  • Mansfield Plumbing Products LLC
  • Jaquar Group
  • VitrA
  • Saniflo
  • Hindware Homes
  • Moen Incorporated
  • Delta Faucet Company
  • Grohe AG
  • Cera Sanitaryware Limited
  • Jomoo Group Co., Ltd.

Recent Development

  • In October 2025, Kohler Co. made a significant impact on the global intelligent urinal market by launching Kohler Health and its smart toilet device, Dekoda. By transforming restrooms into connected, data-driven environments, the initiative highlighted the potential for integrating health monitoring with intelligent sanitation systems. This innovation accelerated interest in smart urinals and advanced restroom technologies worldwide.


  • In March 2022, The installation of the Smart Urinal at Barcelona Sants station, through a collaboration between Roca, One Hundred Restrooms, and Kamleon, showcased innovation in the global intelligent urinal market. By promoting hydration and personal wellbeing, this first-of-its-kind system highlighted the potential for health-focused smart restroom solutions, driving awareness and accelerating adoption of intelligent urinal technologies worldwide.


Frequently Asked Questions (FAQ) :

Q1. What are the main growth-driving factors for this market?

The primary driver is the global focus on water conservation and sustainability, compelling commercial and institutional users to adopt waterless or highly efficient sensor-activated solutions. Additionally, rising public awareness regarding hygiene and sanitation promotes the use of touchless, intelligent fixtures to minimize germ spread in public and commercial restrooms.

Q2. What are the main restraining factors for this market?

The main hurdles include the higher initial cost of smart or waterless urinals compared to conventional models, which can deter adoption in price-sensitive markets. There are also perceived issues related to maintenance complexity and user hygiene skepticism, as some users doubt the effectiveness or cleanliness of water-free systems.

Q3. Which segment is expected to witness high growth?

The Sensor-Activated flush mechanism segment is projected for high growth. This is driven by the increasing integration of touchless technology in smart buildings and the strong demand from commercial sectors (like offices and malls) seeking improved public hygiene, operational efficiency, and enhanced user experience.

Q4. Who are the top major players for this market?

This market involves several key players, primarily companies specializing in sanitaryware and plumbing fixtures, often focusing on water-saving and sensor technologies. While specific brand dominance varies by region, top players include established global brands that manufacture and innovate across the sanitary and bathroom equipment sector.

Q5. Which country is the largest player?

The Asia Pacific (APAC) region, particularly due to rapid urbanization and extensive infrastructure development in countries like China and India, holds the largest and fastest-growing share of the overall urinals market. North America and Europe also maintain significant market shares due to high adoption rates of water-efficient technology.

Intelligent Urinal MARKET STUDY GLOBAL MARKET ANALYSIS, INSIGHTS AND FORECAST, 2022-2029

    1. Introduction

    • 1.1. Research Scope
    • 1.2. Market Segmentation
    • 1.3. Research Methodology
    • 1.4. Definitions and Assumptions

    2. Executive Summary

      3. Market Dynamics

      • 3.1. Market Drivers
      • 3.2. Market Restraints
      • 3.3. Market Opportunities

      4. Key Insights

      • 4.1. Key Emerging Trends – For Major Countries
      • 4.2. Latest Technological Advancement
      • 4.3. Regulatory Landscape
      • 4.4. Industry SWOT Analysis
      • 4.5. Porters Five Forces Analysis

      5. Global Intelligent Urinal Market Analysis (USD Billion), Insights and Forecast, 2018-2029

      • 5.1. Key Findings / Summary
      • 5.2. Market Analysis, Insights and Forecast – By Segment 1
        • 5.2.1. Sub-Segment 1
        • 5.2.2. Sub-Segment 2
      • 5.3. Market Analysis, Insights and Forecast – By Segment 2
        • 5.3.1. Sub-Segment 1
        • 5.3.2. Sub-Segment 2
        • 5.3.3. Sub-Segment 3
        • 5.3.4. Others
      • 5.4. Market Analysis, Insights and Forecast – By Segment 3
        • 5.4.1. Sub-Segment 1
        • 5.4.2. Sub-Segment 2
        • 5.4.3. Sub-Segment 3
        • 5.4.4. Others
      • 5.5. Market Analysis, Insights and Forecast – By Region
        • 5.5.1. North America
        • 5.5.2. Latin America
        • 5.5.3. Europe
        • 5.5.4. Asia Pacific
        • 5.5.5. Middle East and Africa

      6. North America Intelligent Urinal Market Analysis (USD Billion), Insights and Forecast, 2018-2029

      • 6.1. Key Findings / Summary
      • 6.2. Market Analysis, Insights and Forecast – By Segment 1
        • 6.2.1. Sub-Segment 1
        • 6.2.2. Sub-Segment 2
      • 6.3. Market Analysis, Insights and Forecast – By Segment 2
        • 6.3.1. Sub-Segment 1
        • 6.3.2. Sub-Segment 2
        • 6.3.3. Sub-Segment 3
        • 6.3.4. Others
      • 6.4. Market Analysis, Insights and Forecast – By Segment 3
        • 6.4.1. Sub-Segment 1
        • 6.4.2. Sub-Segment 2
        • 6.4.3. Sub-Segment 3
        • 6.4.4. Others
      • 6.5. Market Analysis, Insights and Forecast – By Country
        • 6.5.1. U.S.
        • 6.5.2. Canada

      7. Latin America Intelligent Urinal Market Analysis (USD Billion), Insights and Forecast, 2018-2029

      • 7.1. Key Findings / Summary
      • 7.2. Market Analysis, Insights and Forecast – By Segment 1
        • 7.2.1. Sub-Segment 1
        • 7.2.2. Sub-Segment 2
      • 7.3. Market Analysis, Insights and Forecast – By Segment 2
        • 7.3.1. Sub-Segment 1
        • 7.3.2. Sub-Segment 2
        • 7.3.3. Sub-Segment 3
        • 7.3.4. Others
      • 7.4. Market Analysis, Insights and Forecast – By Segment 3
        • 7.4.1. Sub-Segment 1
        • 7.4.2. Sub-Segment 2
        • 7.4.3. Sub-Segment 3
        • 7.4.4. Others
      • 7.5. Insights and Forecast – By Country
        • 7.5.1. Brazil
        • 7.5.2. Mexico
        • 7.5.3. Rest of Latin America

      8. Europe Intelligent Urinal Market Analysis (USD Billion), Insights and Forecast, 2018-2029

      • 8.1. Key Findings / Summary
      • 8.2. Market Analysis, Insights and Forecast – By Segment 1
        • 8.2.1. Sub-Segment 1
        • 8.2.2. Sub-Segment 2
      • 8.3. Market Analysis, Insights and Forecast – By Segment 2
        • 8.3.1. Sub-Segment 1
        • 8.3.2. Sub-Segment 2
        • 8.3.3. Sub-Segment 3
        • 8.3.4. Others
      • 8.4. Market Analysis, Insights and Forecast – By Segment 3
        • 8.4.1. Sub-Segment 1
        • 8.4.2. Sub-Segment 2
        • 8.4.3. Sub-Segment 3
        • 8.4.4. Others
      • 8.5. Market Analysis, Insights and Forecast – By Country
        • 8.5.1. UK
        • 8.5.2. Germany
        • 8.5.3. France
        • 8.5.4. Italy
        • 8.5.5. Spain
        • 8.5.6. Russia
        • 8.5.7. Rest of Europe

      9. Asia Pacific Intelligent Urinal Market Analysis (USD Billion), Insights and Forecast, 2018-2029

      • 9.1. Key Findings / Summary
      • 9.2. Market Analysis, Insights and Forecast – By Segment 1
        • 9.2.1. Sub-Segment 1
        • 9.2.2. Sub-Segment 2
      • 9.3. Market Analysis, Insights and Forecast – By Segment 2
        • 9.3.1. Sub-Segment 1
        • 9.3.2. Sub-Segment 2
        • 9.3.3. Sub-Segment 3
        • 9.3.4. Others
      • 9.4. Market Analysis, Insights and Forecast – By Segment 3
        • 9.4.1. Sub-Segment 1
        • 9.4.2. Sub-Segment 2
        • 9.4.3. Sub-Segment 3
        • 9.4.4. Others
      • 9.5. Market Analysis, Insights and Forecast – By Country
        • 9.5.1. China
        • 9.5.2. India
        • 9.5.3. Japan
        • 9.5.4. Australia
        • 9.5.5. South East Asia
        • 9.5.6. Rest of Asia Pacific

      10. Middle East & Africa Intelligent Urinal Market Analysis (USD Billion), Insights and Forecast, 2018-2029

      • 10.1. Key Findings / Summary
      • 10.2. Market Analysis, Insights and Forecast – By Segment 1
        • 10.2.1. Sub-Segment 1
        • 10.2.2. Sub-Segment 2
      • 10.3. Market Analysis, Insights and Forecast – By Segment 2
        • 10.3.1. Sub-Segment 1
        • 10.3.2. Sub-Segment 2
        • 10.3.3. Sub-Segment 3
        • 10.3.4. Others
      • 10.4. Market Analysis, Insights and Forecast – By Segment 3
        • 10.4.1. Sub-Segment 1
        • 10.4.2. Sub-Segment 2
        • 10.4.3. Sub-Segment 3
        • 10.4.4. Others
      • 10.5. Market Analysis, Insights and Forecast – By Country
        • 10.5.1. GCC
        • 10.5.2. South Africa
        • 10.5.3. Rest of Middle East & Africa

      11. Competitive Analysis

      • 11.1. Company Market Share Analysis, 2018
      • 11.2. Key Industry Developments
      • 11.3. Company Profile
        • 11.3.1. Company 1
          • 11.3.1.1. Business Overview
          • 11.3.1.2. Segment 1 & Service Offering
          • 11.3.1.3. Overall Revenue
          • 11.3.1.4. Geographic Presence
          • 11.3.1.5. Recent Development
        *Similar details will be provided for the following companies
        • 11.3.2. Company 2
        • 11.3.3. Company 3
        • 11.3.4. Company 4
        • 11.3.5. Company 5
        • 11.3.6. Company 6
        • 11.3.7. Company 7
        • 11.3.8. Company 8
        • 11.3.9. Company 9
        • 11.3.10. Company 10
        • 11.3.11. Company 11
        • 11.3.12. Company 12
      List of Figures

      Figure 1: Global Intelligent Urinal Market Revenue Breakdown (USD Billion, %) by Region, 2022 & 2029
      Figure 2: Global Intelligent Urinal Market Value Share (%), By Segment 1, 2022 & 2029
      Figure 3: Global Intelligent Urinal Market Forecast (USD Billion), by Sub-Segment 1, 2018-2029
      Figure 4: Global Intelligent Urinal Market Forecast (USD Billion), by Sub-Segment 2, 2018-2029
      Figure 5: Global Intelligent Urinal Market Value Share (%), By Segment 2, 2022 & 2029
      Figure 6: Global Intelligent Urinal Market Forecast (USD Billion), by Sub-Segment 1, 2018-2029
      Figure 7: Global Intelligent Urinal Market Forecast (USD Billion), by Sub-Segment 2, 2018-2029
      Figure 8: Global Intelligent Urinal Market Forecast (USD Billion), by Sub-Segment 3, 2018-2029
      Figure 9: Global Intelligent Urinal Market Forecast (USD Billion), by Others, 2018-2029
      Figure 10: Global Intelligent Urinal Market Value Share (%), By Segment 3, 2022 & 2029
      Figure 11: Global Intelligent Urinal Market Forecast (USD Billion), by Sub-Segment 1, 2018-2029
      Figure 12: Global Intelligent Urinal Market Forecast (USD Billion), by Sub-Segment 2, 2018-2029
      Figure 13: Global Intelligent Urinal Market Forecast (USD Billion), by Sub-Segment 3, 2018-2029
      Figure 14: Global Intelligent Urinal Market Forecast (USD Billion), by Others, 2018-2029
      Figure 15: Global Intelligent Urinal Market Value (USD Billion), by Region, 2022 & 2029
      Figure 16: North America Intelligent Urinal Market Value Share (%), By Segment 1, 2022 & 2029
      Figure 17: North America Intelligent Urinal Market Forecast (USD Billion), by Sub-Segment 1, 2018-2029
      Figure 18: North America Intelligent Urinal Market Forecast (USD Billion), by Sub-Segment 2, 2018-2029
      Figure 19: North America Intelligent Urinal Market Value Share (%), By Segment 2, 2022 & 2029
      Figure 20: North America Intelligent Urinal Market Forecast (USD Billion), by Sub-Segment 1, 2018-2029
      Figure 21: North America Intelligent Urinal Market Forecast (USD Billion), by Sub-Segment 2, 2018-2029
      Figure 22: North America Intelligent Urinal Market Forecast (USD Billion), by Sub-Segment 3, 2018-2029
      Figure 23: North America Intelligent Urinal Market Forecast (USD Billion), by Others, 2018-2029
      Figure 24: North America Intelligent Urinal Market Value Share (%), By Segment 3, 2022 & 2029
      Figure 25: North America Intelligent Urinal Market Forecast (USD Billion), by Sub-Segment 1, 2018-2029
      Figure 26: North America Intelligent Urinal Market Forecast (USD Billion), by Sub-Segment 2, 2018-2029
      Figure 27: North America Intelligent Urinal Market Forecast (USD Billion), by Sub-Segment 3, 2018-2029
      Figure 28: North America Intelligent Urinal Market Forecast (USD Billion), by Others, 2018-2029
      Figure 29: North America Intelligent Urinal Market Forecast (USD Billion), by U.S., 2018-2029
      Figure 30: North America Intelligent Urinal Market Forecast (USD Billion), by Canada, 2018-2029
      Figure 31: Latin America Intelligent Urinal Market Value Share (%), By Segment 1, 2022 & 2029
      Figure 32: Latin America Intelligent Urinal Market Forecast (USD Billion), by Sub-Segment 1, 2018-2029
      Figure 33: Latin America Intelligent Urinal Market Forecast (USD Billion), by Sub-Segment 2, 2018-2029
      Figure 34: Latin America Intelligent Urinal Market Value Share (%), By Segment 2, 2022 & 2029
      Figure 35: Latin America Intelligent Urinal Market Forecast (USD Billion), by Sub-Segment 1, 2018-2029
      Figure 36: Latin America Intelligent Urinal Market Forecast (USD Billion), by Sub-Segment 2, 2018-2029
      Figure 37: Latin America Intelligent Urinal Market Forecast (USD Billion), by Sub-Segment 3, 2018-2029
      Figure 38: Latin America Intelligent Urinal Market Forecast (USD Billion), by Others, 2018-2029
      Figure 39: Latin America Intelligent Urinal Market Value Share (%), By Segment 3, 2022 & 2029
      Figure 40: Latin America Intelligent Urinal Market Forecast (USD Billion), by Sub-Segment 1, 2018-2029
      Figure 41: Latin America Intelligent Urinal Market Forecast (USD Billion), by Sub-Segment 2, 2018-2029
      Figure 42: Latin America Intelligent Urinal Market Forecast (USD Billion), by Sub-Segment 3, 2018-2029
      Figure 43: Latin America Intelligent Urinal Market Forecast (USD Billion), by Others, 2018-2029
      Figure 44: Latin America Intelligent Urinal Market Forecast (USD Billion), by Brazil, 2018-2029
      Figure 45: Latin America Intelligent Urinal Market Forecast (USD Billion), by Mexico, 2018-2029
      Figure 46: Latin America Intelligent Urinal Market Forecast (USD Billion), by Rest of Latin America, 2018-2029
      Figure 47: Europe Intelligent Urinal Market Value Share (%), By Segment 1, 2022 & 2029
      Figure 48: Europe Intelligent Urinal Market Forecast (USD Billion), by Sub-Segment 1, 2018-2029
      Figure 49: Europe Intelligent Urinal Market Forecast (USD Billion), by Sub-Segment 2, 2018-2029
      Figure 50: Europe Intelligent Urinal Market Value Share (%), By Segment 2, 2022 & 2029
      Figure 51: Europe Intelligent Urinal Market Forecast (USD Billion), by Sub-Segment 1, 2018-2029
      Figure 52: Europe Intelligent Urinal Market Forecast (USD Billion), by Sub-Segment 2, 2018-2029
      Figure 53: Europe Intelligent Urinal Market Forecast (USD Billion), by Sub-Segment 3, 2018-2029
      Figure 54: Europe Intelligent Urinal Market Forecast (USD Billion), by Others, 2018-2029
      Figure 55: Europe Intelligent Urinal Market Value Share (%), By Segment 3, 2022 & 2029
      Figure 56: Europe Intelligent Urinal Market Forecast (USD Billion), by Sub-Segment 1, 2018-2029
      Figure 57: Europe Intelligent Urinal Market Forecast (USD Billion), by Sub-Segment 2, 2018-2029
      Figure 58: Europe Intelligent Urinal Market Forecast (USD Billion), by Sub-Segment 3, 2018-2029
      Figure 59: Europe Intelligent Urinal Market Forecast (USD Billion), by Others, 2018-2029
      Figure 60: Europe Intelligent Urinal Market Forecast (USD Billion), by U.K., 2018-2029
      Figure 61: Europe Intelligent Urinal Market Forecast (USD Billion), by Germany, 2018-2029
      Figure 62: Europe Intelligent Urinal Market Forecast (USD Billion), by France, 2018-2029
      Figure 63: Europe Intelligent Urinal Market Forecast (USD Billion), by Italy, 2018-2029
      Figure 64: Europe Intelligent Urinal Market Forecast (USD Billion), by Spain, 2018-2029
      Figure 65: Europe Intelligent Urinal Market Forecast (USD Billion), by Russia, 2018-2029
      Figure 66: Europe Intelligent Urinal Market Forecast (USD Billion), by Rest of Europe, 2018-2029
      Figure 67: Asia Pacific Intelligent Urinal Market Value Share (%), By Segment 1, 2022 & 2029
      Figure 68: Asia Pacific Intelligent Urinal Market Forecast (USD Billion), by Sub-Segment 1, 2018-2029
      Figure 69: Asia Pacific Intelligent Urinal Market Forecast (USD Billion), by Sub-Segment 2, 2018-2029
      Figure 70: Asia Pacific Intelligent Urinal Market Value Share (%), By Segment 2, 2022 & 2029
      Figure 71: Asia Pacific Intelligent Urinal Market Forecast (USD Billion), by Sub-Segment 1, 2018-2029
      Figure 72: Asia Pacific Intelligent Urinal Market Forecast (USD Billion), by Sub-Segment 2, 2018-2029
      Figure 73: Asia Pacific Intelligent Urinal Market Forecast (USD Billion), by Sub-Segment 3, 2018-2029
      Figure 74: Asia Pacific Intelligent Urinal Market Forecast (USD Billion), by Others, 2018-2029
      Figure 75: Asia Pacific Intelligent Urinal Market Value Share (%), By Segment 3, 2022 & 2029
      Figure 76: Asia Pacific Intelligent Urinal Market Forecast (USD Billion), by Sub-Segment 1, 2018-2029
      Figure 77: Asia Pacific Intelligent Urinal Market Forecast (USD Billion), by Sub-Segment 2, 2018-2029
      Figure 78: Asia Pacific Intelligent Urinal Market Forecast (USD Billion), by Sub-Segment 3, 2018-2029
      Figure 79: Asia Pacific Intelligent Urinal Market Forecast (USD Billion), by Others, 2018-2029
      Figure 80: Asia Pacific Intelligent Urinal Market Forecast (USD Billion), by China, 2018-2029
      Figure 81: Asia Pacific Intelligent Urinal Market Forecast (USD Billion), by India, 2018-2029
      Figure 82: Asia Pacific Intelligent Urinal Market Forecast (USD Billion), by Japan, 2018-2029
      Figure 83: Asia Pacific Intelligent Urinal Market Forecast (USD Billion), by Australia, 2018-2029
      Figure 84: Asia Pacific Intelligent Urinal Market Forecast (USD Billion), by Southeast Asia, 2018-2029
      Figure 85: Asia Pacific Intelligent Urinal Market Forecast (USD Billion), by Rest of Asia Pacific, 2018-2029
      Figure 86: Middle East & Africa Intelligent Urinal Market Value Share (%), By Segment 1, 2022 & 2029
      Figure 87: Middle East & Africa Intelligent Urinal Market Forecast (USD Billion), by Sub-Segment 1, 2018-2029
      Figure 88: Middle East & Africa Intelligent Urinal Market Forecast (USD Billion), by Sub-Segment 2, 2018-2029
      Figure 89: Middle East & Africa Intelligent Urinal Market Value Share (%), By Segment 2, 2022 & 2029
      Figure 90: Middle East & Africa Intelligent Urinal Market Forecast (USD Billion), by Sub-Segment 1, 2018-2029
      Figure 91: Middle East & Africa Intelligent Urinal Market Forecast (USD Billion), by Sub-Segment 2, 2018-2029
      Figure 92: Middle East & Africa Intelligent Urinal Market Forecast (USD Billion), by Sub-Segment 3, 2018-2029
      Figure 93: Middle East & Africa Intelligent Urinal Market Forecast (USD Billion), by Others, 2018-2029
      Figure 94: Middle East & Africa Intelligent Urinal Market Value Share (%), By Segment 3, 2022 & 2029
      Figure 95: Middle East & Africa Intelligent Urinal Market Forecast (USD Billion), by Sub-Segment 1, 2018-2029
      Figure 96: Middle East & Africa Intelligent Urinal Market Forecast (USD Billion), by Sub-Segment 2, 2018-2029
      Figure 97: Middle East & Africa Intelligent Urinal Market Forecast (USD Billion), by Sub-Segment 3, 2018-2029
      Figure 98: Middle East & Africa Intelligent Urinal Market Forecast (USD Billion), by Others, 2018-2029
      Figure 99: Middle East & Africa Intelligent Urinal Market Forecast (USD Billion), by GCC, 2018-2029
      Figure 100: Middle East & Africa Intelligent Urinal Market Forecast (USD Billion), by South Africa, 2018-2029
      Figure 101: Middle East & Africa Intelligent Urinal Market Forecast (USD Billion), by Rest of Middle East & Africa, 2018-2029 
      List of Tables
      Table 1: Global Intelligent Urinal Market Revenue (USD Billion) Forecast, by Segment 1, 2018-2029
      Table 2: Global Intelligent Urinal Market Revenue (USD Billion) Forecast, by Segment 2, 2018-2029
      Table 3: Global Intelligent Urinal Market Revenue (USD Billion) Forecast, by Segment 3, 2018-2029
      Table 4: Global Intelligent Urinal Market Revenue (USD Billion) Forecast, by Region, 2018-2029
      Table 5: North America Intelligent Urinal Market Revenue (USD Billion) Forecast, by Segment 1, 2018-2029
      Table 6: North America Intelligent Urinal Market Revenue (USD Billion) Forecast, by Segment 2, 2018-2029
      Table 7: North America Intelligent Urinal Market Revenue (USD Billion) Forecast, by Segment 3, 2018-2029
      Table 8: North America Intelligent Urinal Market Revenue (USD Billion) Forecast, by Country, 2018-2029
      Table 9: Europe Intelligent Urinal Market Revenue (USD Billion) Forecast, by Segment 1, 2018-2029
      Table 10: Europe Intelligent Urinal Market Revenue (USD Billion) Forecast, by Segment 2, 2018-2029
      Table 11: Europe Intelligent Urinal Market Revenue (USD Billion) Forecast, by Segment 3, 2018-2029
      Table 12: Europe Intelligent Urinal Market Revenue (USD Billion) Forecast, by Country, 2018-2029
      Table 13: Latin America Intelligent Urinal Market Revenue (USD Billion) Forecast, by Segment 1, 2018-2029
      Table 14: Latin America Intelligent Urinal Market Revenue (USD Billion) Forecast, by Segment 2, 2018-2029
      Table 15: Latin America Intelligent Urinal Market Revenue (USD Billion) Forecast, by Segment 3, 2018-2029
      Table 16: Latin America Intelligent Urinal Market Revenue (USD Billion) Forecast, by Country, 2018-2029
      Table 17: Asia Pacific Intelligent Urinal Market Revenue (USD Billion) Forecast, by Segment 1, 2018-2029
      Table 18: Asia Pacific Intelligent Urinal Market Revenue (USD Billion) Forecast, by Segment 2, 2018-2029
      Table 19: Asia Pacific Intelligent Urinal Market Revenue (USD Billion) Forecast, by Segment 3, 2018-2029
      Table 20: Asia Pacific Intelligent Urinal Market Revenue (USD Billion) Forecast, by Country, 2018-2029
      Table 21: Middle East & Africa Intelligent Urinal Market Revenue (USD Billion) Forecast, by Segment 1, 2018-2029
      Table 22: Middle East & Africa Intelligent Urinal Market Revenue (USD Billion) Forecast, by Segment 2, 2018-2029
      Table 23: Middle East & Africa Intelligent Urinal Market Revenue (USD Billion) Forecast, by Segment 3, 2018-2029
      Table 24: Middle East & Africa Intelligent Urinal Market Revenue (USD Billion) Forecast, by Country, 2018-2029
      Research Process

      Data Library Research are conducted by industry experts who offer insight on industry structure, market segmentations technology assessment and competitive landscape (CL), and penetration, as well as on emerging trends. Their analysis is based on primary interviews (~ 80%) and secondary research (~ 20%) as well as years of professional expertise in their respective industries. Adding to this, by analysing historical trends and current market positions, our analysts predict where the market will be headed for the next five years. Furthermore, the varying trends of segment & categories geographically presented are also studied and the estimated based on the primary & secondary research.

      In this particular report from the supply side Data Library Research has conducted primary surveys (interviews) with the key level executives (VP, CEO’s, Marketing Director, Business Development Manager and SOFT) of the companies that active & prominent as well as the midsized organization

      FIGURE 1: DLR RESEARH PROCESS

      research-methodology1

      Primary Research

      Extensive primary research was conducted to gain a deeper insight of the market and industry performance. The analysis is based on both primary and secondary research as well as years of professional expertise in the respective industries.

      In addition to analysing current and historical trends, our analysts predict where the market is headed over the next five years.

      It varies by segment for these categories geographically presented in the list of market tables. Speaking about this particular report we have conducted primary surveys (interviews) with the key level executives (VP, CEO’s, Marketing Director, Business Development Manager and many more) of the major players active in the market.

      Secondary Research

      Secondary research was mainly used to collect and identify information useful for the extensive, technical, market-oriented, and Friend’s study of the Global Extra Neutral Alcohol. It was also used to obtain key information about major players, market classification and segmentation according to the industry trends, geographical markets, and developments related to the market and technology perspectives. For this study, analysts have gathered information from various credible sources, such as annual reports, sec filings, journals, white papers, SOFT presentations, and company web sites.

      Market Size Estimation

      Both, top-down and bottom-up approaches were used to estimate and validate the size of the Global market and to estimate the size of various other dependent submarkets in the overall Extra Neutral Alcohol. The key players in the market were identified through secondary research and their market contributions in the respective geographies were determined through primary and secondary research.

      Forecast Model

      research-methodology2