Keratolytic Agents Market Overview and Analysis
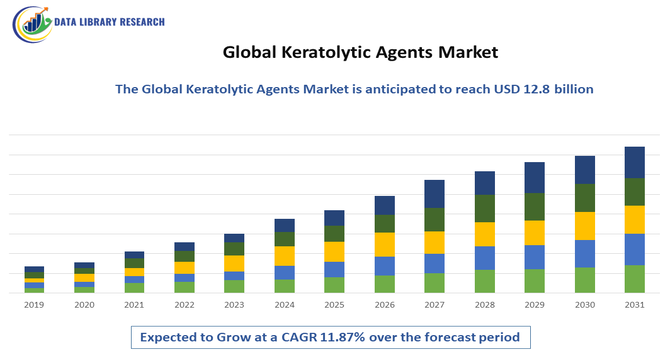
- The Global Keratolytic Agents Market, valued at approximately USD 4.8 billion in 2025, and this market is forecasted to grow to reach USD 12.8 billion by 2032, reflecting a Compound Annual Growth Rate (CAGR) of about 11.87% during the 2025-2032 period.
Get Complete Analysis Of The Report - Download Updated Free Sample PDF
The Global Keratolytic Agents Market is witnessing significant growth, driven primarily by the rising prevalence of dermatological conditions such as acne, psoriasis, warts, and hyperkeratosis worldwide. Increasing consumer awareness about skin health and the growing demand for effective over-the-counter and prescription skincare treatments are further fueling market expansion. The surge in the use of topical formulations, combined with advancements in drug delivery systems that enhance efficacy and patient compliance, is also boosting adoption.
Keratolytic Agents Market Latest Trends
The Global Keratolytic Agents Market is currently witnessing several notable trends. There is a growing preference for combination therapies that integrate keratolytic agents with moisturizers, anti-inflammatory compounds, or retinoids to enhance treatment efficacy and reduce skin irritation. Natural and plant-derived keratolytic formulations are gaining traction as consumers increasingly seek safer, organic, and sustainable skincare solutions. Additionally, innovations in topical delivery systems, such as gels, creams, foams, and patches, are improving patient compliance and targeted action. The market is also seeing a rise in over-the-counter (OTC) availability, making treatments more accessible, along with an increased focus on personalized skincare solutions for various skin types and conditions.
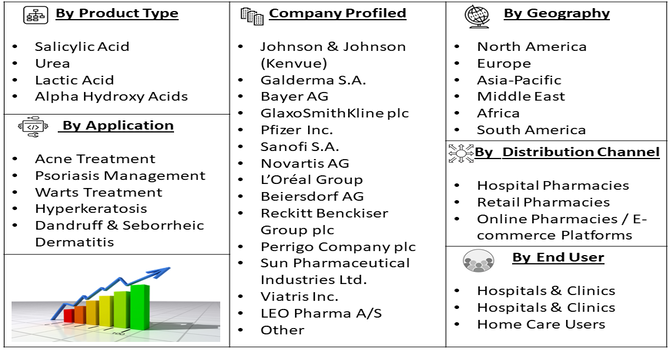
Segmentation: Global Keratolytic Agents Market is segmented By Product Type (Salicylic Acid, Urea, Lactic Acid, Alpha Hydroxy Acids), Formulation (Creams & Ointments, Gels, Lotions, Solutions & Liquid), Application (Acne Treatment, Psoriasis Management, Warts Treatment, Hyperkeratosis, Dandruff & Seborrheic Dermatitis), Distribution Channel (Hospital Pharmacies, Retail Pharmacies, Online Pharmacies / E-commerce Platforms), End User (Hospitals & Clinics, Hospitals & Clinics, Home Care Users), and Geography (North America, Europe, Asia-Pacific, Middle East and Africa, and South America). The report provides the value (in USD million) for the above segments.
For Detailed Market Segmentation - Get a Free Sample PDF
Market Drivers:
- Rising Prevalence of Dermatological Disorders
The growing global burden of skin conditions such as acne, psoriasis, warts, hyperkeratosis, dandruff, and seborrheic dermatitis is a major driver of the keratolytic agents market. Acne alone affects nearly 80–90% of adolescents and a significant percentage of adults, increasing long-term demand for keratolytic ingredients like salicylic acid and AHAs. Similarly, rising cases of chronic skin diseases—often linked to hormonal imbalance, pollution, stress, and lifestyle changes—fuel continuous product consumption. As dermatology visits increase, both prescription-based and OTC keratolytic formulations see strong and sustained uptake.
- Growing Consumer Shift Toward Advanced Skincare and Cosmetic Dermatology
Increasing awareness of skincare, rising disposable income, and the trend toward personalized beauty routines significantly boost demand for keratolytic products. Consumers are increasingly preferring exfoliating solutions such as salicylic acid serums, urea-based moisturizers, and lactic acid chemical exfoliants to manage skin texture, pigmentation, and aging concerns. The expansion of e-commerce, skincare influencers, and dermatologist-backed brands further accelerates product penetration. Additionally, the growth of cosmeceuticals and clean beauty formulations incorporating keratolytic ingredients contributes to the market’s strong upward trajectory.
Market Restraints:
- Risk of Skin Irritation and Adverse Reactions
The primary challenges is the risk of skin irritation and adverse reactions, particularly among individuals with sensitive skin. Keratolytic ingredients such as salicylic acid, urea, and alpha hydroxy acids can cause redness, burning, excessive dryness, or peeling when used in high concentrations or without proper guidance. These side effects often discourage long-term use and lead consumers to opt for milder alternatives, reducing product adoption in certain segments. Additionally, stringent regulatory frameworks surrounding dermatological and cosmetic formulations create hurdles for manufacturers. Ensuring safety compliance, ingredient approval, and clinical validation increases development costs and extends product launch timelines.
Socioeconomic Impact on Keratolytic Agents Market
The socioeconomic impact of the Global Keratolytic Agents Market has been significant as demand for products that treat conditions like acne, psoriasis, dandruff and calluses continues to rise. These agents, used in both medical and cosmetic skincare, help improve quality of life by easing discomfort and boosting confidence for millions of people. Growing awareness of skin health has supported job creation in pharmaceutical manufacturing, dermatology services, retail, and research. The market has also encouraged innovation in safer and more effective formulations. In developing regions, increasing access to affordable keratolytic products has improved basic skincare, supporting overall public health and wellbeing.
Segmental Analysis
- Salicylic Acid segment is expected to witness the highest growth over the forecast period
Salicylic acid dominates the keratolytic agents market due to its strong efficacy in treating acne, warts, calluses, and psoriasis. Its deep exfoliating action, anti-inflammatory properties, and widespread availability in OTC skincare products make it the most commonly used keratolytic ingredient globally.
Additionally, the versatility of salicylic acid allows it to be incorporated into various formulations, including cleansers, serums, creams, shampoos and medicated patches, enhancing its accessibility and appeal across diverse consumer needs. Its long-standing clinical validation and safety profile have built strong trust among dermatologists and consumers alike. This sustained demand ensures its continued dominance within the global keratolytic agents market.
- Creams & Ointments segment is expected to witness the highest growth over the forecast period
Creams and ointments account for a major share as they provide targeted, long-lasting application and superior skin absorption. These formulations are preferred for chronic conditions like psoriasis and hyperkeratosis because they offer moisturization along with therapeutic keratolysis.
- Acne Treatment segment is expected to witness the highest growth over the forecast period
Acne treatment represents the leading application segment as keratolytic agents are widely used to unclog pores, remove dead skin buildup, and reduce inflammation. The rising global acne incidence and growth of dermatologist-recommended and OTC products fuel the segment’s prominence.
Moreover, increasing consumer awareness of early acne management and preventive skincare has strengthened demand for keratolytic-based formulations in daily routines. The expansion of e-commerce platforms has improved access to specialized treatments, while social media has accelerated awareness of science-backed acne solutions.
- Retail Pharmacies segment is expected to witness the highest growth over the forecast period
Retail pharmacies play a critical role in the distribution of keratolytic agents as they offer easy accessibility, pharmacist guidance, and a broad range of OTC keratolytic products. Their extensive presence across urban and rural areas supports consistent product availability.
- Home Care Users segment is expected to witness the highest growth over the forecast period
Home care users form the largest end-user group, driven by growing consumer preference for self-care solutions and the availability of user-friendly OTC keratolytic treatments. Increasing awareness of skincare routines and cost-effective self-application methods boosts this segment's demand.
- North America segment is expected to witness the highest growth over the forecast period
North America leads the market due to high awareness of dermatological health, strong demand for advanced skincare products, and the widespread availability of dermatology services. Favorable healthcare spending and robust OTC product adoption further strengthen the region’s dominance.
The region benefits from widespread access to dermatologists, well-established healthcare infrastructure and strong insurance coverage for related treatments. Additionally, consumers show a high preference for over-the-counter keratolytic products, supported by strong retail and e-commerce networks. Favorable healthcare spending, continuous product innovation and proactive adoption of science-backed skincare further contribute to the region’s dominance. The presence of major pharmaceutical manufacturers and ongoing clinical research also reinforces North America’s position as the most influential market.
| Report Matrics |
Details |
| Market Size Value |
USD 12.8 billion |
| Growth Rate |
CAGR of 11.87% |
| Forecast |
2026-2033 |
| Historical data |
2021-2024 |
| Base Year |
2025 |
| Report Coverage |
Forecasted revenue, company rating, competitive environment, growth drivers, and trends |
| Segment Coverage |
Type, Application, End-User, Geography |
| Regional Scope |
North America, Europe, Asia Pacific, Middle East |
| Customized scope |
Free customization of reports (With 3 months Analysis Support ) |
| To Learn More About This Report |
Request a Free Sample Copy |
Keratolytic Agents Market Competitive Landscape
The competitive landscape of the Global Keratolytic Agents Market is diverse and dynamic, featuring a mix of large pharmaceutical companies, specialized dermatology firms, and consumer-skincare brands. Competition centers on formulation innovation (balancing efficacy with tolerability), ingredient sourcing (synthetic vs. natural/plant-derived actives), delivery formats (gels, creams, patches, OTC vs. prescription), and strong go-to-market channels (retail, pharmacy, e-commerce). Leading players differentiate through clinical evidence, regulatory approvals, targeted marketing to dermatologists and consumers, and value-added services such as patient education and digital engagement. Mergers, strategic partnerships, and line extensions (e.g., combination products and cosmeceuticals) are common strategies to expand portfolios and geographic reach, while cost, safety profiles, and brand trust remain critical to capturing market share.
Key Players:
- Johnson & Johnson (Kenvue)
- Galderma S.A.
- Bayer AG
- GlaxoSmithKline plc
- Pfizer Inc.
- Sanofi S.A.
- Novartis AG
- L’Oréal Group
- Beiersdorf AG
- Reckitt Benckiser Group plc
- Perrigo Company plc
- Sun Pharmaceutical Industries Ltd.
- Viatris Inc.
- LEO Pharma A/S
- Almirall S.A.
- Pierre Fabre Laboratories
- Himalaya Global Holdings
- Dermalogica (brand / professional skincare firms)
- The Estée Lauder Companies
- Boots / Walgreens Boots Alliance
Recent Development
- In December 2025, Sun Pharmaceutical launched its innovative biologic ILUMYA (Tildrakizumab) in India for treating moderate-to-severe plaque psoriasis. Already recognized globally for its safety and effectiveness, this introduction expanded advanced treatment options. Its arrival positively influenced the Global Keratolytic Agents Market by increasing dermatological awareness and driving demand for complementary keratolytic skincare products.
- In July 2025, Johnson & Johnson filed a new drug application with the FDA for its investigational targeted oral peptide icotrokinra to treat adults and adolescents with moderate to severe plaque psoriasis. This advancement supported the Global Keratolytic Agents Market by increasing attention on psoriasis care and boosting demand for complementary keratolytic therapies that enhance treatment outcomes.
Frequently Asked Questions (FAQ) :
Q1. What are the main growth-driving factors for this market?
Market growth is primarily driven by the rising global prevalence of chronic skin conditions, such as acne, psoriasis, warts, and dandruff. Increased consumer awareness about skin health and the benefits of regular exfoliation also boost demand. Furthermore, the availability of these effective agents in convenient over-the-counter (OTC) products expands market accessibility worldwide.
Q2. What are the main restraining factors for this market?
A key restraint is the potential for adverse side effects when using some keratolytic agents, especially in high concentrations. Issues like skin irritation, redness, burning, and dryness can reduce patient compliance. Another limitation is the increasing competition from alternative, non-chemical treatment options, including home remedies and natural skincare alternatives.
Q3. Which segment is expected to witness high growth?
The Salicylic Acid segment was expected to witness the highest growth due to its strong effectiveness in exfoliation, acne control, and treatment of various skin conditions, driving broad medical and cosmetic demand.
Q4. Who are the top major players for this market?
The market includes major pharmaceutical and personal care companies with strong dermatology portfolios. Top global players include companies like Johnson & Johnson, Pfizer, Novartis, Galderma Laboratories, and Merck & Co., Inc. These firms focus on research and development to create new, safer, and more effective topical formulations.
Q5. Which country is the largest player?
The United States, representing a major share of North America, is the largest regional player in this market. This dominance is due to high healthcare expenditure, significant consumer awareness regarding dermatological health, and the wide availability and acceptance of both prescription and over-the-counter keratolytic products for treating prevalent skin disorders.
List of Figures
Figure 1: Global Keratolytic Agents Market Revenue Breakdown (USD Billion, %) by Region, 2022 & 2029
Figure 2: Global Keratolytic Agents Market Value Share (%), By Segment 1, 2022 & 2029
Figure 3: Global Keratolytic Agents Market Forecast (USD Billion), by Sub-Segment 1, 2018-2029
Figure 4: Global Keratolytic Agents Market Forecast (USD Billion), by Sub-Segment 2, 2018-2029
Figure 5: Global Keratolytic Agents Market Value Share (%), By Segment 2, 2022 & 2029
Figure 6: Global Keratolytic Agents Market Forecast (USD Billion), by Sub-Segment 1, 2018-2029
Figure 7: Global Keratolytic Agents Market Forecast (USD Billion), by Sub-Segment 2, 2018-2029
Figure 8: Global Keratolytic Agents Market Forecast (USD Billion), by Sub-Segment 3, 2018-2029
Figure 9: Global Keratolytic Agents Market Forecast (USD Billion), by Others, 2018-2029
Figure 10: Global Keratolytic Agents Market Value Share (%), By Segment 3, 2022 & 2029
Figure 11: Global Keratolytic Agents Market Forecast (USD Billion), by Sub-Segment 1, 2018-2029
Figure 12: Global Keratolytic Agents Market Forecast (USD Billion), by Sub-Segment 2, 2018-2029
Figure 13: Global Keratolytic Agents Market Forecast (USD Billion), by Sub-Segment 3, 2018-2029
Figure 14: Global Keratolytic Agents Market Forecast (USD Billion), by Others, 2018-2029
Figure 15: Global Keratolytic Agents Market Value (USD Billion), by Region, 2022 & 2029
Figure 16: North America Keratolytic Agents Market Value Share (%), By Segment 1, 2022 & 2029
Figure 17: North America Keratolytic Agents Market Forecast (USD Billion), by Sub-Segment 1, 2018-2029
Figure 18: North America Keratolytic Agents Market Forecast (USD Billion), by Sub-Segment 2, 2018-2029
Figure 19: North America Keratolytic Agents Market Value Share (%), By Segment 2, 2022 & 2029
Figure 20: North America Keratolytic Agents Market Forecast (USD Billion), by Sub-Segment 1, 2018-2029
Figure 21: North America Keratolytic Agents Market Forecast (USD Billion), by Sub-Segment 2, 2018-2029
Figure 22: North America Keratolytic Agents Market Forecast (USD Billion), by Sub-Segment 3, 2018-2029
Figure 23: North America Keratolytic Agents Market Forecast (USD Billion), by Others, 2018-2029
Figure 24: North America Keratolytic Agents Market Value Share (%), By Segment 3, 2022 & 2029
Figure 25: North America Keratolytic Agents Market Forecast (USD Billion), by Sub-Segment 1, 2018-2029
Figure 26: North America Keratolytic Agents Market Forecast (USD Billion), by Sub-Segment 2, 2018-2029
Figure 27: North America Keratolytic Agents Market Forecast (USD Billion), by Sub-Segment 3, 2018-2029
Figure 28: North America Keratolytic Agents Market Forecast (USD Billion), by Others, 2018-2029
Figure 29: North America Keratolytic Agents Market Forecast (USD Billion), by U.S., 2018-2029
Figure 30: North America Keratolytic Agents Market Forecast (USD Billion), by Canada, 2018-2029
Figure 31: Latin America Keratolytic Agents Market Value Share (%), By Segment 1, 2022 & 2029
Figure 32: Latin America Keratolytic Agents Market Forecast (USD Billion), by Sub-Segment 1, 2018-2029
Figure 33: Latin America Keratolytic Agents Market Forecast (USD Billion), by Sub-Segment 2, 2018-2029
Figure 34: Latin America Keratolytic Agents Market Value Share (%), By Segment 2, 2022 & 2029
Figure 35: Latin America Keratolytic Agents Market Forecast (USD Billion), by Sub-Segment 1, 2018-2029
Figure 36: Latin America Keratolytic Agents Market Forecast (USD Billion), by Sub-Segment 2, 2018-2029
Figure 37: Latin America Keratolytic Agents Market Forecast (USD Billion), by Sub-Segment 3, 2018-2029
Figure 38: Latin America Keratolytic Agents Market Forecast (USD Billion), by Others, 2018-2029
Figure 39: Latin America Keratolytic Agents Market Value Share (%), By Segment 3, 2022 & 2029
Figure 40: Latin America Keratolytic Agents Market Forecast (USD Billion), by Sub-Segment 1, 2018-2029
Figure 41: Latin America Keratolytic Agents Market Forecast (USD Billion), by Sub-Segment 2, 2018-2029
Figure 42: Latin America Keratolytic Agents Market Forecast (USD Billion), by Sub-Segment 3, 2018-2029
Figure 43: Latin America Keratolytic Agents Market Forecast (USD Billion), by Others, 2018-2029
Figure 44: Latin America Keratolytic Agents Market Forecast (USD Billion), by Brazil, 2018-2029
Figure 45: Latin America Keratolytic Agents Market Forecast (USD Billion), by Mexico, 2018-2029
Figure 46: Latin America Keratolytic Agents Market Forecast (USD Billion), by Rest of Latin America, 2018-2029
Figure 47: Europe Keratolytic Agents Market Value Share (%), By Segment 1, 2022 & 2029
Figure 48: Europe Keratolytic Agents Market Forecast (USD Billion), by Sub-Segment 1, 2018-2029
Figure 49: Europe Keratolytic Agents Market Forecast (USD Billion), by Sub-Segment 2, 2018-2029
Figure 50: Europe Keratolytic Agents Market Value Share (%), By Segment 2, 2022 & 2029
Figure 51: Europe Keratolytic Agents Market Forecast (USD Billion), by Sub-Segment 1, 2018-2029
Figure 52: Europe Keratolytic Agents Market Forecast (USD Billion), by Sub-Segment 2, 2018-2029
Figure 53: Europe Keratolytic Agents Market Forecast (USD Billion), by Sub-Segment 3, 2018-2029
Figure 54: Europe Keratolytic Agents Market Forecast (USD Billion), by Others, 2018-2029
Figure 55: Europe Keratolytic Agents Market Value Share (%), By Segment 3, 2022 & 2029
Figure 56: Europe Keratolytic Agents Market Forecast (USD Billion), by Sub-Segment 1, 2018-2029
Figure 57: Europe Keratolytic Agents Market Forecast (USD Billion), by Sub-Segment 2, 2018-2029
Figure 58: Europe Keratolytic Agents Market Forecast (USD Billion), by Sub-Segment 3, 2018-2029
Figure 59: Europe Keratolytic Agents Market Forecast (USD Billion), by Others, 2018-2029
Figure 60: Europe Keratolytic Agents Market Forecast (USD Billion), by U.K., 2018-2029
Figure 61: Europe Keratolytic Agents Market Forecast (USD Billion), by Germany, 2018-2029
Figure 62: Europe Keratolytic Agents Market Forecast (USD Billion), by France, 2018-2029
Figure 63: Europe Keratolytic Agents Market Forecast (USD Billion), by Italy, 2018-2029
Figure 64: Europe Keratolytic Agents Market Forecast (USD Billion), by Spain, 2018-2029
Figure 65: Europe Keratolytic Agents Market Forecast (USD Billion), by Russia, 2018-2029
Figure 66: Europe Keratolytic Agents Market Forecast (USD Billion), by Rest of Europe, 2018-2029
Figure 67: Asia Pacific Keratolytic Agents Market Value Share (%), By Segment 1, 2022 & 2029
Figure 68: Asia Pacific Keratolytic Agents Market Forecast (USD Billion), by Sub-Segment 1, 2018-2029
Figure 69: Asia Pacific Keratolytic Agents Market Forecast (USD Billion), by Sub-Segment 2, 2018-2029
Figure 70: Asia Pacific Keratolytic Agents Market Value Share (%), By Segment 2, 2022 & 2029
Figure 71: Asia Pacific Keratolytic Agents Market Forecast (USD Billion), by Sub-Segment 1, 2018-2029
Figure 72: Asia Pacific Keratolytic Agents Market Forecast (USD Billion), by Sub-Segment 2, 2018-2029
Figure 73: Asia Pacific Keratolytic Agents Market Forecast (USD Billion), by Sub-Segment 3, 2018-2029
Figure 74: Asia Pacific Keratolytic Agents Market Forecast (USD Billion), by Others, 2018-2029
Figure 75: Asia Pacific Keratolytic Agents Market Value Share (%), By Segment 3, 2022 & 2029
Figure 76: Asia Pacific Keratolytic Agents Market Forecast (USD Billion), by Sub-Segment 1, 2018-2029
Figure 77: Asia Pacific Keratolytic Agents Market Forecast (USD Billion), by Sub-Segment 2, 2018-2029
Figure 78: Asia Pacific Keratolytic Agents Market Forecast (USD Billion), by Sub-Segment 3, 2018-2029
Figure 79: Asia Pacific Keratolytic Agents Market Forecast (USD Billion), by Others, 2018-2029
Figure 80: Asia Pacific Keratolytic Agents Market Forecast (USD Billion), by China, 2018-2029
Figure 81: Asia Pacific Keratolytic Agents Market Forecast (USD Billion), by India, 2018-2029
Figure 82: Asia Pacific Keratolytic Agents Market Forecast (USD Billion), by Japan, 2018-2029
Figure 83: Asia Pacific Keratolytic Agents Market Forecast (USD Billion), by Australia, 2018-2029
Figure 84: Asia Pacific Keratolytic Agents Market Forecast (USD Billion), by Southeast Asia, 2018-2029
Figure 85: Asia Pacific Keratolytic Agents Market Forecast (USD Billion), by Rest of Asia Pacific, 2018-2029
Figure 86: Middle East & Africa Keratolytic Agents Market Value Share (%), By Segment 1, 2022 & 2029
Figure 87: Middle East & Africa Keratolytic Agents Market Forecast (USD Billion), by Sub-Segment 1, 2018-2029
Figure 88: Middle East & Africa Keratolytic Agents Market Forecast (USD Billion), by Sub-Segment 2, 2018-2029
Figure 89: Middle East & Africa Keratolytic Agents Market Value Share (%), By Segment 2, 2022 & 2029
Figure 90: Middle East & Africa Keratolytic Agents Market Forecast (USD Billion), by Sub-Segment 1, 2018-2029
Figure 91: Middle East & Africa Keratolytic Agents Market Forecast (USD Billion), by Sub-Segment 2, 2018-2029
Figure 92: Middle East & Africa Keratolytic Agents Market Forecast (USD Billion), by Sub-Segment 3, 2018-2029
Figure 93: Middle East & Africa Keratolytic Agents Market Forecast (USD Billion), by Others, 2018-2029
Figure 94: Middle East & Africa Keratolytic Agents Market Value Share (%), By Segment 3, 2022 & 2029
Figure 95: Middle East & Africa Keratolytic Agents Market Forecast (USD Billion), by Sub-Segment 1, 2018-2029
Figure 96: Middle East & Africa Keratolytic Agents Market Forecast (USD Billion), by Sub-Segment 2, 2018-2029
Figure 97: Middle East & Africa Keratolytic Agents Market Forecast (USD Billion), by Sub-Segment 3, 2018-2029
Figure 98: Middle East & Africa Keratolytic Agents Market Forecast (USD Billion), by Others, 2018-2029
Figure 99: Middle East & Africa Keratolytic Agents Market Forecast (USD Billion), by GCC, 2018-2029
Figure 100: Middle East & Africa Keratolytic Agents Market Forecast (USD Billion), by South Africa, 2018-2029
Figure 101: Middle East & Africa Keratolytic Agents Market Forecast (USD Billion), by Rest of Middle East & Africa, 2018-2029
List of Tables
Table 1: Global Keratolytic Agents Market Revenue (USD Billion) Forecast, by Segment 1, 2018-2029
Table 2: Global Keratolytic Agents Market Revenue (USD Billion) Forecast, by Segment 2, 2018-2029
Table 3: Global Keratolytic Agents Market Revenue (USD Billion) Forecast, by Segment 3, 2018-2029
Table 4: Global Keratolytic Agents Market Revenue (USD Billion) Forecast, by Region, 2018-2029
Table 5: North America Keratolytic Agents Market Revenue (USD Billion) Forecast, by Segment 1, 2018-2029
Table 6: North America Keratolytic Agents Market Revenue (USD Billion) Forecast, by Segment 2, 2018-2029
Table 7: North America Keratolytic Agents Market Revenue (USD Billion) Forecast, by Segment 3, 2018-2029
Table 8: North America Keratolytic Agents Market Revenue (USD Billion) Forecast, by Country, 2018-2029
Table 9: Europe Keratolytic Agents Market Revenue (USD Billion) Forecast, by Segment 1, 2018-2029
Table 10: Europe Keratolytic Agents Market Revenue (USD Billion) Forecast, by Segment 2, 2018-2029
Table 11: Europe Keratolytic Agents Market Revenue (USD Billion) Forecast, by Segment 3, 2018-2029
Table 12: Europe Keratolytic Agents Market Revenue (USD Billion) Forecast, by Country, 2018-2029
Table 13: Latin America Keratolytic Agents Market Revenue (USD Billion) Forecast, by Segment 1, 2018-2029
Table 14: Latin America Keratolytic Agents Market Revenue (USD Billion) Forecast, by Segment 2, 2018-2029
Table 15: Latin America Keratolytic Agents Market Revenue (USD Billion) Forecast, by Segment 3, 2018-2029
Table 16: Latin America Keratolytic Agents Market Revenue (USD Billion) Forecast, by Country, 2018-2029
Table 17: Asia Pacific Keratolytic Agents Market Revenue (USD Billion) Forecast, by Segment 1, 2018-2029
Table 18: Asia Pacific Keratolytic Agents Market Revenue (USD Billion) Forecast, by Segment 2, 2018-2029
Table 19: Asia Pacific Keratolytic Agents Market Revenue (USD Billion) Forecast, by Segment 3, 2018-2029
Table 20: Asia Pacific Keratolytic Agents Market Revenue (USD Billion) Forecast, by Country, 2018-2029
Table 21: Middle East & Africa Keratolytic Agents Market Revenue (USD Billion) Forecast, by Segment 1, 2018-2029
Table 22: Middle East & Africa Keratolytic Agents Market Revenue (USD Billion) Forecast, by Segment 2, 2018-2029
Table 23: Middle East & Africa Keratolytic Agents Market Revenue (USD Billion) Forecast, by Segment 3, 2018-2029
Table 24: Middle East & Africa Keratolytic Agents Market Revenue (USD Billion) Forecast, by Country, 2018-2029
Research Process
Data Library Research are conducted by industry experts who offer insight on
industry structure, market segmentations technology assessment and competitive landscape (CL), and penetration, as well as on emerging trends. Their analysis is based on primary interviews (~ 80%) and secondary research (~ 20%) as well as years of professional expertise in their respective industries. Adding to this, by analysing historical trends and current market positions, our analysts predict where the market will be headed for the next five years. Furthermore, the varying trends of segment & categories geographically presented are also studied and the estimated based on the primary & secondary research.
In this particular report from the supply side Data Library Research has conducted primary surveys (interviews) with the key level executives (VP, CEO’s, Marketing Director, Business Development Manager
and SOFT) of the companies that active & prominent as well as the midsized organization
FIGURE 1: DLR RESEARH PROCESS
![research-methodology1]()
Primary Research
Extensive primary research was conducted to gain a deeper insight of the market and industry performance. The analysis is based on both primary and secondary research as well as years of professional expertise in the respective industries.
In addition to analysing current and historical trends, our analysts predict where the market is headed over the next five years.
It varies by segment for these categories geographically presented in the list of market tables. Speaking about this particular report we have conducted primary surveys (interviews) with the key level executives (VP, CEO’s, Marketing Director, Business Development Manager and many more) of the major players active in the market.
Secondary Research
Secondary research was mainly used to collect and identify information useful for the extensive, technical, market-oriented, and Friend’s study of the Global Extra Neutral Alcohol. It was also used to obtain key information about major players, market classification and segmentation according to the industry trends, geographical markets, and developments related to the market and technology perspectives. For this study, analysts have gathered information from various credible sources, such as annual reports, sec filings, journals, white papers, SOFT presentations, and company web sites.
Market Size Estimation
Both, top-down and bottom-up approaches were used to estimate and validate the size of the Global market and to estimate the size of various other dependent submarkets in the overall Extra Neutral Alcohol. The key players in the market were identified through secondary research and their market contributions in the respective geographies were determined through primary and secondary research.
Forecast Model
![research-methodology2]()