Get Complete Analysis Of The Report - Download Updated Free Sample PDF
The Global Live Fill Light Market is experiencing robust growth driven by the increasing popularity of digital content creation, including live streaming, online education, video conferencing, gaming broadcasts, social media influencing, and virtual events. The surge in platforms such as YouTube, TikTok, Instagram, Twitch, and professional webinar tools is significantly boosting the demand for high-quality lighting solutions to enhance video clarity and on-camera appearance. Additionally, the growing adoption of remote working and virtual communication tools has led to higher usage of ring lights, panel lights, and portable LED fill lights among professionals and home users.
The global Live Fill Light market is experiencing several notable trends shaping product development, user preferences, and distribution strategies. Firstly, there’s a strong push toward smart, feature-rich lighting systems. Manufacturers are increasingly integrating adjustable color-temperature settings, brightness control via mobile apps, and even voice or cloud connectivity to simplify live streaming setups. Secondly, the rise of the creator economy and live commerce is driving demand for specialized fill lights tailored for on-the-go use and semi-professional setups, with emphasis on portability, compact designs, and high color accuracy LEDs. Thirdly, there’s a pivot toward dedicated lighting kits combining ring lights or panel lights with mounts for mobile phones/cameras, collapsing the accessory stack for content creators.
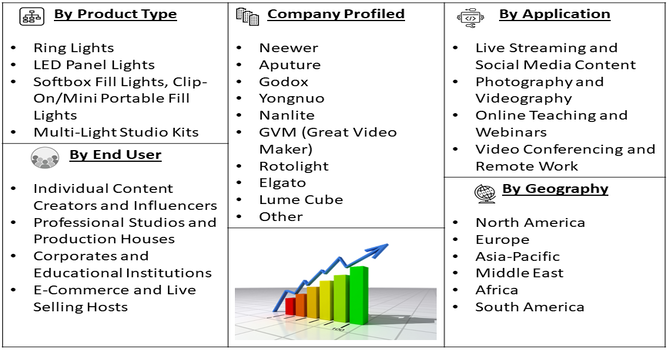
Segmentation: Global Live Fill Light Market is segmented By Type (Ring Lights, LED Panel Lights, Softbox Fill Lights, Clip-On/Mini Portable Fill Lights, Multi-Light Studio Kits), Power Source (USB-Powered Lights, Battery-Powered/Rechargeable Lights, AC-Powered Professional Lighting Systems), Application (Live Streaming and Social Media Content, Photography and Videography, Online Teaching and Webinars, Video Conferencing and Remote Work), End User (Individual Content Creators and Influencers, Professional Studios and Production Houses, Corporates and Educational Institutions, E-Commerce and Live Selling Hosts), and Geography (North America, Europe, Asia-Pacific, Middle East and Africa, and South America). The report provides the value (in USD million) for the above segments.
For Detailed Market Segmentation - Get a Free Sample PDF
Market Drivers:
The major drivers of the Global Live Fill Light Market is the explosive rise of digital content creation across platforms such as YouTube, TikTok, Instagram, Twitch, Facebook Live, and emerging live-commerce applications. As millions of independent creators, influencers, livestream sellers, and podcasters seek professional-quality lighting to enhance video clarity and on-camera appearance, demand for live fill lights continues to escalate. The global boom in short-form video content, vlogging culture, and influencer-led marketing has driven consumers to invest in lighting equipment that improves skin tone appearance, reduces shadows, and delivers studio-grade visuals even in home environments.
Another significant driver is the widespread shift toward remote work, virtual meetings, online classes, and hybrid corporate collaboration models. With video calls now integral to business, education, healthcare, and training environments, professionals increasingly require lighting solutions that provide clear visibility and professional presentation on video conferencing platforms such as Zoom, Microsoft Teams, and Google Meet. This trend has also extended into areas such as virtual job interviews, telehealth consultations, and online coaching, where visual quality plays a critical role in communication effectiveness. The growing recognition that proper lighting enhances engagement, reduces eye strain, and improves confidence during virtual interactions is leading individuals, schools, and organizations to adopt high-quality live fill lights.
Market Restraints:
The Global Live Fill Light Market faces several restraints that may limit growth despite rising demand. One of the primary challenges is the high competition and price saturation in the market, especially in the low- to mid-range product segment, where numerous low-cost manufacturers—particularly from Asia—offer similar products, leading to reduced profit margins and difficulty in brand differentiation. Additionally, technological obsolescence poses a concern, as rapid innovation in LED efficiency, smart connectivity, and integrated lighting systems forces manufacturers to continuously upgrade designs, increasing development costs and shortening product lifecycles.
The Global Live Fill Light Market had a positive socioeconomic impact by creating job opportunities in manufacturing, sales, and installation sectors worldwide. It supported industries like photography, broadcasting, and entertainment, helping businesses improve quality and efficiency. The growing demand for better lighting solutions made events and productions more accessible and visually appealing, boosting local economies. Additionally, advances in live fill lighting technology contributed to energy savings and environmental benefits. Overall, the market’s growth helped improve livelihoods, supported creative industries, and encouraged innovation across multiple sectors globally.
Segmental Analysis
Ring Lights hold a major share due to their widespread adoption by content creators, vloggers, social media influencers, and online presenters. Their circular design provides even illumination with minimal shadows, making them ideal for close-range recording, beauty streaming, product reviews, and personal broadcasting. The portability, affordability, and simple setup of ring lights make them the most accessible lighting option, especially for individuals transitioning into digital content production. As live streaming grows across platforms like TikTok, YouTube, Instagram, and live shopping apps, demand for ring lights continues to rise, driven by both entry-level consumers and professionals seeking adjustable, multi-brightness and RGB-capable variants.
USB-Powered Lights are gaining strong traction as they offer the convenience of compatibility with smartphones, laptops, power banks, and portable charging devices. Their plug-and-play operation and low power consumption make them ideal for mobile content creation, remote work, and casual live streaming. USB-powered models have become especially popular in markets where portability and travel-friendly solutions are prioritized. As hybrid work models and mobile content production become mainstream, USB-powered fill lights are expected to see sustained demand, particularly among students, remote employees, and freelance content creators.
Live Streaming and Social Media Content represents the most rapidly growing segment in response to the booming creator economy and increasing use of platforms such as Twitch, TikTok, Facebook Live, YouTube Live, and Instagram Reels. This segment benefits from rising monetization opportunities, brand collaborations, influencer marketing, and live e-commerce trends. As more individuals pursue digital careers or leverage content production for business branding, demand for professional-quality lighting accessories continues to accelerate.
Individual Content Creators and Influencers form the leading segment as millions of new digital creators enter the market annually, driven by accessible monetization tools and low entry barriers for recording equipment. These users prioritize cost-effective, compact, and customizable lighting solutions that enhance facial clarity, product presentations, and visual storytelling. The growth of micro-influencers and live-stream sellers further amplifies this segment’s expansion.
North America region is expected to witness the highest growth over the forecast period, driven by the rapid expansion of the creator economy, strong presence of professional content production industries, and widespread adoption of advanced digital communication tools.
The region benefits from a mature market for livestreaming, online education platforms, and remote work solutions, along with high spending power among consumers and professionals seeking high-quality lighting equipment. Additionally, the presence of major technology brands, established e-commerce distribution channels, and increasing demand from influencers, podcasters, and live sellers further contribute to the accelerated market expansion in North America throughout the forecast period.
| Report Matrics | Details |
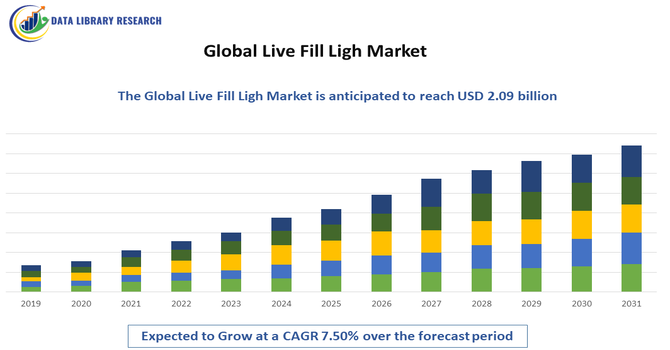
| Market Size Value | USD 2.09 billion |
| Growth Rate | CAGR of 7.50% |
| Forecast | 2026-2033 |
| Historical data | 2021-2024 |
| Base Year | 2025 |
| Report Coverage | Forecasted revenue, company rating, competitive environment, growth drivers, and trends |
| Segment Coverage | Type, Application, End-User, Geography |
| Regional Scope | North America, Europe, Asia Pacific, Middle East |
| Customized scope | Free customization of reports (With 3 months Analysis Support ) |
| To Learn More About This Report | Request a Free Sample Copy |
The market is competitive and diverse, populated by specialist lighting manufacturers, camera-accessory brands, and consumer-electronics firms offering a range of products from affordable ring lights to professional LED panels and studio kits. Players compete on features (CRI/ TLCI, color temperature range, RGB capabilities), portability, power options (USB, battery, AC), smart controls (apps, Bluetooth), and price-to-performance—while distribution through e-commerce, specialty retailers, and OEM bundles shapes market reach.
Key Players:
Recent Development
Q1. What are the main growth-driving factors for this market?
The market is primarily driven by the explosive growth of the creator economy, fueled by platforms like TikTok, YouTube, and Instagram, which demand professional-quality video content. The sustained trend of remote work and online education also necessitates better professional video presence for meetings and classes. Furthermore, the rapid expansion of live e-commerce and live shopping events creates a continuous commercial demand for effective, high-quality lighting.
Q2. What are the main restraining factors for this market?
A key restraining factor is the fierce competition from established, traditional lighting manufacturers that are now entering the compact LED light segment. Market growth can also be hindered by high initial and deployment costs associated with premium, feature-rich smart lighting systems that incorporate high Color Rendering Index (CRI) and advanced app controls. Potential supply chain disruptions affecting component availability are also a constant concern.
Q3. Which segment is expected to witness high growth?
The Commercial segment is projected to witness the highest growth. This dominance is driven by revenue-generating applications, including professional studios, live commerce companies, and digital marketing agencies that require large-scale, high-performance lighting setups. While the household segment grows, commercial entities make larger investments and purchase greater volumes of high-end, customizable fill lights for consistent brand quality.
Q4. Who are the top major players for this market?
The market features both traditional lighting companies and specialized tech firms. Major players include companies like ALLTOP, Spectrum, Shenzhen Maolin Global, and Shenzhen Shishang Creative Development Technology. These players compete by focusing on technological innovations, such as introducing app-controlled features, improving color accuracy (high CRI), and developing more compact, portable, and energy-efficient LED fill light designs.
Q5. Which country is the largest player?
The Asia-Pacific (APAC) region, led prominently by China and India, is considered the largest player in the live fill light market. This dominance stems from its enormous digital user base, the thriving domestic e-commerce ecosystem, and rapid urbanization. China is also a global leader in lighting exports and manufacturing, supporting both domestic consumption and international supply.
Data Library Research are conducted by industry experts who offer insight on industry structure, market segmentations technology assessment and competitive landscape (CL), and penetration, as well as on emerging trends. Their analysis is based on primary interviews (~ 80%) and secondary research (~ 20%) as well as years of professional expertise in their respective industries. Adding to this, by analysing historical trends and current market positions, our analysts predict where the market will be headed for the next five years. Furthermore, the varying trends of segment & categories geographically presented are also studied and the estimated based on the primary & secondary research.
In this particular report from the supply side Data Library Research has conducted primary surveys (interviews) with the key level executives (VP, CEO’s, Marketing Director, Business Development Manager and SOFT) of the companies that active & prominent as well as the midsized organization
FIGURE 1: DLR RESEARH PROCESS
Extensive primary research was conducted to gain a deeper insight of the market and industry performance. The analysis is based on both primary and secondary research as well as years of professional expertise in the respective industries.
In addition to analysing current and historical trends, our analysts predict where the market is headed over the next five years.
It varies by segment for these categories geographically presented in the list of market tables. Speaking about this particular report we have conducted primary surveys (interviews) with the key level executives (VP, CEO’s, Marketing Director, Business Development Manager and many more) of the major players active in the market.
Secondary ResearchSecondary research was mainly used to collect and identify information useful for the extensive, technical, market-oriented, and Friend’s study of the Global Extra Neutral Alcohol. It was also used to obtain key information about major players, market classification and segmentation according to the industry trends, geographical markets, and developments related to the market and technology perspectives. For this study, analysts have gathered information from various credible sources, such as annual reports, sec filings, journals, white papers, SOFT presentations, and company web sites.
Market Size EstimationBoth, top-down and bottom-up approaches were used to estimate and validate the size of the Global market and to estimate the size of various other dependent submarkets in the overall Extra Neutral Alcohol. The key players in the market were identified through secondary research and their market contributions in the respective geographies were determined through primary and secondary research.
Forecast Model