Machine Vision Solutions For Industry 4.0  Market Overview and analysis

The Global Machine Vision Solutions for Industry 4.0 Market size was estimated at USD 19,76 billion in 2025 and is projected to reach USD 42.9 billion by 2032, growing at a CAGR of 8.9% from 2025-2032.

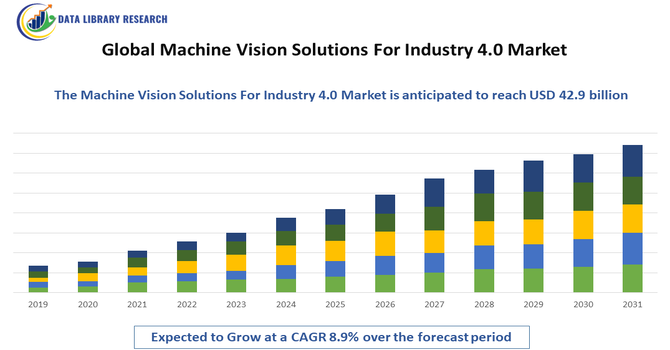
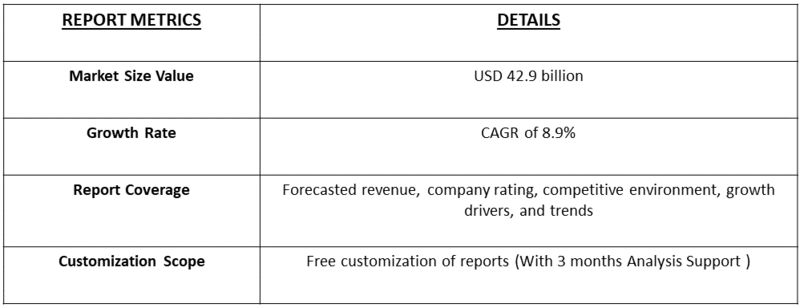
The Global Machine Vision Solutions for Industry 4.0 Market refers to the adoption of advanced imaging and vision technologies integrated with industrial automation systems to enhance manufacturing efficiency, quality control, and process monitoring. Leveraging AI, IoT, and robotics, these solutions enable real-time inspection, defect detection, and predictive maintenance, driving productivity, precision, and smart factory implementation across various industrial sectors worldwide.

The growth of the Global Machine Vision Solutions for Industry 4.0 Market is driven by increasing automation across manufacturing sectors, rising demand for high-precision quality inspection, and the integration of AI, IoT, and robotics in industrial processes. Growing emphasis on predictive maintenance, operational efficiency, and defect reduction fuels adoption. Additionally, the need for real-time monitoring, traceability, and smart factory implementation, coupled with Industry 4.0 initiatives and technological advancements in imaging and sensor systems, further accelerates market expansion globally.

Machine Vision Solutions For Industry 4.0  Market Latest Trends

The Global Machine Vision Solutions for Industry 4.0 Market is witnessing trends such as the integration of AI-powered image recognition, deep learning algorithms, and 3D vision technologies to improve accuracy and efficiency. Adoption of cloud-based and edge computing platforms enables real-time data processing, predictive analytics, and seamless connectivity across smart factories. Additionally, modular and scalable vision systems, coupled with increased use in robotics, semiconductor, automotive, and electronics manufacturing, are shaping the market toward higher automation and precision-driven production.

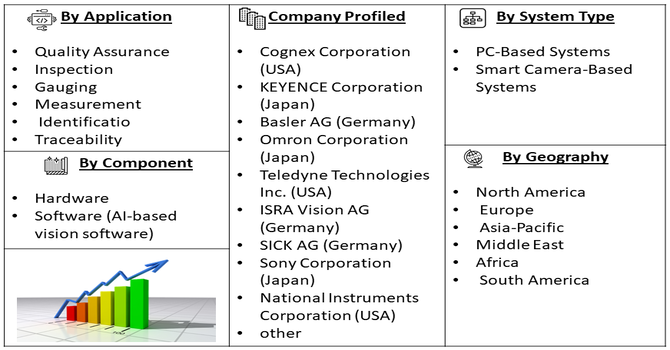
Segmentation: The Global Machine Vision Solutions for Industry 4.0 Market is segmented by Component (Hardware and Software (AI-based vision software)), System Type (PC-Based Systems and Smart Camera-Based Systems), Application (Quality Assurance & Inspection, Gauging & Measurement, Identification & Traceability), Industry/End-User (Electronics & Semiconductor, Automotive, Food & Beverage, Pharmaceuticals, and Logistics & Warehousing) and Geography (North America, Europe, Asia-Pacific, Middle East and Africa, and South America). The report provides the value (in USD million) for the above segments.

Market Drivers:

  • Rising Automation and Smart Manufacturing Adoption

The Global Machine Vision Solutions for Industry 4.0 Market is driven by the increasing adoption of automation and smart manufacturing technologies across industries. Manufacturers are implementing AI-powered vision systems to enhance quality control, reduce production errors, and improve operational efficiency. The integration of machine vision with robotics, IoT, and predictive maintenance enables real-time monitoring, defect detection, and process optimization. Growing industrial digitization and the demand for high-precision production in automotive, electronics, pharmaceuticals, and food processing sectors further fuel market growth. Additionally, governments and enterprises are investing in Industry 4.0 initiatives, creating a favorable environment for widespread adoption of advanced vision solutions.

  • Demand for High-Quality Inspection and Product Traceability

Increasing emphasis on product quality, safety, and regulatory compliance is a major growth driver for the machine vision market. Industries such as electronics, semiconductors, automotive, and consumer goods require precise inspection systems to detect defects, verify assembly, and ensure accurate labeling. Machine vision solutions enable real-time monitoring, reduce human error, and enhance traceability across the supply chain. Rising consumer awareness and stringent industry standards push manufacturers to adopt advanced imaging and AI-driven inspection technologies. Moreover, the growing need to minimize production waste, improve yield, and maintain consistent quality across high-speed manufacturing lines drives investments in automated vision systems globally, accelerating market expansion.

Market Restraint:

  • High Initial Investment and Technical Complexity

A key restraint for the Global Machine Vision Solutions for Industry 4.0 Market is the high initial cost of implementation and the technical complexity of advanced systems. Setting up AI-powered vision solutions, 3D imaging systems, and integrated robotics requires significant capital expenditure, which can be challenging for small and medium-sized enterprises. Additionally, the systems demand specialized technical expertise for installation, programming, and maintenance, increasing operational overheads. Compatibility issues with existing equipment, integration challenges, and the need for continuous software updates further hinder adoption. These factors may slow market penetration in price-sensitive regions, particularly among manufacturers with limited budgets or those lacking skilled personnel to manage advanced vision technologies.

Socio Economic Impact on Machine Vision Solutions For Industry 4.0  Market

Machine vision solutions are driving significant socioeconomic benefits by enhancing industrial productivity, reducing labor-intensive inspection tasks, and improving product quality. Automation of repetitive processes allows workforce reallocation to higher-value activities, contributing to skill development and efficiency gains. Improved precision reduces waste, lowers operational costs, and promotes sustainable manufacturing practices. Furthermore, the adoption of smart factory technologies supports industrial competitiveness, boosts economic growth, and enables enterprises to meet rising global demand while ensuring safety and reliability in manufacturing operations.

Segmental Analysis:

  • Software Segment is Expected to Witness Significant Growth Over the Forecast Period

The Software segment in the Global Machine Vision Solutions for Industry 4.0 Market is expected to witness significant growth over the forecast period due to increasing adoption of AI, deep learning, and image-processing algorithms. Software solutions enable real-time defect detection, predictive maintenance, and seamless integration with Industrial IoT and automation systems. Rising demand for cloud-based platforms, analytics-driven insights, and customizable vision software is further fueling growth. Manufacturers are investing in software to optimize production workflows, enhance quality control, and reduce downtime. The segment’s expansion is also driven by digital transformation initiatives and the need for scalable, flexible, and intelligent manufacturing solutions globally.

  • PC-Based Systems Segment is Expected to Witness Significant Growth Over the Forecast Period

The PC-Based Systems segment is projected to record substantial growth, driven by its versatility, high computing power, and compatibility with advanced machine vision software. These systems facilitate real-time image processing, data analysis, and integration with robotic automation for smart factory operations. Rising adoption in sectors like automotive, electronics, and pharmaceuticals, where precision and rapid processing are critical, is contributing to expansion. Additionally, PC-based platforms support scalability, remote monitoring, and AI-enabled inspection, enabling manufacturers to improve productivity and quality control. The growing emphasis on Industry 4.0 initiatives and industrial digitization is further accelerating demand for PC-based vision systems globally.

  • Quality Assurance & Inspection Segment is Expected to Witness Significant Growth Over the Forecast Period

The Quality Assurance & Inspection segment is expected to witness significant growth due to increasing industry focus on product accuracy, defect reduction, and compliance with stringent quality standards. Machine vision systems provide automated inspection, real-time anomaly detection, and traceability across manufacturing processes, minimizing human error and reducing waste. Industries such as automotive, electronics, food and beverage, and pharmaceuticals are investing heavily in these solutions to ensure reliability and maintain customer satisfaction. Additionally, rising demand for automated inspection in high-speed production lines, coupled with AI and deep learning integration, is driving adoption, making this segment a crucial growth area in the Industry 4.0 landscape.

  • Electronics & Semiconductor Segment is Expected to Witness Significant Growth Over the Forecast Period

The Electronics & Semiconductor segment is projected to experience significant growth, driven by the increasing complexity of microchips, circuit boards, and electronic components. Machine vision solutions enable precise inspection, defect detection, and automated assembly verification, which are critical in semiconductor manufacturing. The rising adoption of Industry 4.0 technologies, including AI, robotics, and IoT, has enhanced operational efficiency and reduced errors in production processes. Growth in consumer electronics, automotive electronics, and industrial electronics is further boosting demand. Additionally, manufacturers are leveraging vision systems for wafer inspection, packaging, and quality control, driving segment expansion globally.

  • Asia Pacific Region is Expected to Witness Significant Growth Over the Forecast Period

The Asia Pacific region is expected to witness the highest growth over the forecast period due to rapid industrialization, increasing automation, and the adoption of Industry 4.0 initiatives. Countries like China, Japan, South Korea, and India are investing heavily in smart manufacturing, robotics, and AI-powered machine vision solutions. The growing electronics, automotive, and semiconductor industries in the region create strong demand for real-time inspection, defect detection, and precision manufacturing solutions. Rising government support, increasing foreign investment, and a skilled workforce further contribute to market expansion. Additionally, the region’s focus on digital transformation and smart factory implementation drives sustained growth.

Machine Vision Solutions For Industry 4.0  Market Competitive Analysis

The competitive landscape of the market is highly dynamic, with major players like Cognex Corporation, Keyence Corporation, Omron Corporation, Basler AG, and Teledyne Technologies leading innovations. Companies focus on strategic collaborations, mergers, acquisitions, and R&D investments to develop AI-integrated vision systems and expand their global footprint. Differentiation is achieved through technological advancements, custom solutions, and end-to-end integration with Industry 4.0 systems. Additionally, emerging startups are leveraging niche innovations in deep learning, 3D imaging, and cloud-based analytics, intensifying competition and driving continuous improvement across the sector.

The 20 major players for above market are:

  • Cognex Corporation (USA)
  • KEYENCE Corporation (Japan)
  • Basler AG (Germany)
  • Omron Corporation (Japan)
  • Teledyne Technologies Inc. (USA)
  • ISRA Vision AG (Germany)
  • SICK AG (Germany)
  • Sony Corporation (Japan)
  • National Instruments Corporation (USA)
  • Intel Corporation (USA)
  • Texas Instruments Inc. (USA)
  • Allied Vision Technologies GmbH (Germany)
  • Baumer Optronic AG (Switzerland)
  • JAI A/S (Denmark)
  • MVTec Software GmbH (Germany)
  • Datalogic S.p.A. (Italy)
  • ABB Ltd. (Switzerland)
  • KUKA AG (Germany)
  • Zivid AS (Norway)
  • ViTrox Corporation Berhad (Malaysia)

Recent Development

  • In July 2024, OMRON Corporation released a software update for its FH Vision System and FHV7 Smart Camera, incorporating Digimarc decoding technology. This upgrade enabled advanced digital product identification through digital watermarks, ensuring precise packaging verification at speeds exceeding 2,000 parts per minute. The integration improved detection accuracy, accelerated processing, supported flexible camera setups, offered robust redundancy, and enabled diverse inspection types, demonstrating OMRON’s commitment to innovation and providing consumer goods manufacturers with enhanced tools for quality assurance and operational efficiency.


  • In June 2024, SICK AG introduced the Inspector83x 2D vision sensor, a standalone system for automated inspection tasks such as defect detection, sorting, and OCR/OCV, capable of handling up to 15 inspections per second. The device combines AI-driven and rules-based algorithms, allowing AI training with only a few images directly on the sensor. It features up to 5 MP resolution, built-in lighting, a quad-core CPU, dual-port Ethernet, C-mount lens compatibility, and an external illumination port, and operates with SICK Nova, the company’s configurable machine vision software.


Frequently Asked Questions (FAQ) :

Q1. What the main growth driving factors for this market?

The primary driver is the accelerated global push for smart manufacturing and automation inherent in the Industry 4.0 movement. Machine vision is critical for achieving the high levels of quality control, precision, and efficiency needed in modern production lines, especially in electronics and automotive sectors. Its ability to perform real-time defect detection, inspection, and measurement faster and more accurately than humans minimizes costly errors and enhances productivity. Furthermore, the integration of Artificial Intelligence (AI) and deep learning is expanding machine vision's capability to handle complex, unstructured inspection tasks.

Q2. What are the main restraining factors for this market?

One significant restraining factor is the high initial deployment cost and complexity of advanced machine vision systems, which includes specialized cameras, processors, and sophisticated software. This substantial investment and the need for system customization for every unique application can deter smaller and medium-sized enterprises (SMEs). Additionally, there is a shortage of a highly skilled labor force trained in integrating, operating, and maintaining these complex, AI-driven systems, making widespread implementation challenging in many regions.

Q3. Which segment is expected to witness high growth ?

The AI-based Machine Vision Software segment is expected to witness the highest growth. While hardware provides the images, the software layer, powered by deep learning and AI, provides the intelligence needed to solve complex inspection and classification problems with superior accuracy and flexibility. This software intelligence allows vision systems to adapt to variations and handle unstructured data far better than traditional rule-based programming. The value derived from the system is increasingly migrating to this smart, flexible software layer, driving its market expansion.

Q4. Who are the top major players for this market?

The market is led by companies specializing in high-performance sensors, cameras, and integrated automation platforms. Top major players include Cognex Corporation (a leader in barcode reading and vision systems), Keyence Corporation (known for its wide range of automation sensors and vision tools), Teledyne Technologies Inc. (with its Teledyne DALSA imaging division), and Basler AG (a prominent industrial camera manufacturer). Industrial automation giants like Omron Corporation also hold significant market share by integrating machine vision into their comprehensive robotics and factory control solutions.

Q5. Which country is the largest player?

The Asia-Pacific (APAC) region is expected to generate the highest overall demand and is the fastest-growing market globally. This is driven by massive ongoing industrial automation efforts in manufacturing powerhouses like China, Japan, and South Korea. These economies have large, high-volume manufacturing sectors (especially in electronics and automotive) that require constant, high-speed, and precision quality control, making the adoption of machine vision solutions an immediate necessity for competitiveness and quality assurance.

Machine Vision Solutions For Industry 4.0 MARKET STUDY GLOBAL MARKET ANALYSIS, INSIGHTS AND FORECAST, 2022-2029

    1. Introduction

    • 1.1. Research Scope
    • 1.2. Market Segmentation
    • 1.3. Research Methodology
    • 1.4. Definitions and Assumptions

    2. Executive Summary

      3. Market Dynamics

      • 3.1. Market Drivers
      • 3.2. Market Restraints
      • 3.3. Market Opportunities

      4. Key Insights

      • 4.1. Key Emerging Trends – For Major Countries
      • 4.2. Latest Technological Advancement
      • 4.3. Regulatory Landscape
      • 4.4. Industry SWOT Analysis
      • 4.5. Porters Five Forces Analysis

      5. Global Machine Vision Solutions For Industry 4.0 Market Analysis (USD Billion), Insights and Forecast, 2018-2029

      • 5.1. Key Findings / Summary
      • 5.2. Market Analysis, Insights and Forecast – By Segment 1
        • 5.2.1. Sub-Segment 1
        • 5.2.2. Sub-Segment 2
      • 5.3. Market Analysis, Insights and Forecast – By Segment 2
        • 5.3.1. Sub-Segment 1
        • 5.3.2. Sub-Segment 2
        • 5.3.3. Sub-Segment 3
        • 5.3.4. Others
      • 5.4. Market Analysis, Insights and Forecast – By Segment 3
        • 5.4.1. Sub-Segment 1
        • 5.4.2. Sub-Segment 2
        • 5.4.3. Sub-Segment 3
        • 5.4.4. Others
      • 5.5. Market Analysis, Insights and Forecast – By Region
        • 5.5.1. North America
        • 5.5.2. Latin America
        • 5.5.3. Europe
        • 5.5.4. Asia Pacific
        • 5.5.5. Middle East and Africa

      6. North America Machine Vision Solutions For Industry 4.0 Market Analysis (USD Billion), Insights and Forecast, 2018-2029

      • 6.1. Key Findings / Summary
      • 6.2. Market Analysis, Insights and Forecast – By Segment 1
        • 6.2.1. Sub-Segment 1
        • 6.2.2. Sub-Segment 2
      • 6.3. Market Analysis, Insights and Forecast – By Segment 2
        • 6.3.1. Sub-Segment 1
        • 6.3.2. Sub-Segment 2
        • 6.3.3. Sub-Segment 3
        • 6.3.4. Others
      • 6.4. Market Analysis, Insights and Forecast – By Segment 3
        • 6.4.1. Sub-Segment 1
        • 6.4.2. Sub-Segment 2
        • 6.4.3. Sub-Segment 3
        • 6.4.4. Others
      • 6.5. Market Analysis, Insights and Forecast – By Country
        • 6.5.1. U.S.
        • 6.5.2. Canada

      7. Latin America Machine Vision Solutions For Industry 4.0 Market Analysis (USD Billion), Insights and Forecast, 2018-2029

      • 7.1. Key Findings / Summary
      • 7.2. Market Analysis, Insights and Forecast – By Segment 1
        • 7.2.1. Sub-Segment 1
        • 7.2.2. Sub-Segment 2
      • 7.3. Market Analysis, Insights and Forecast – By Segment 2
        • 7.3.1. Sub-Segment 1
        • 7.3.2. Sub-Segment 2
        • 7.3.3. Sub-Segment 3
        • 7.3.4. Others
      • 7.4. Market Analysis, Insights and Forecast – By Segment 3
        • 7.4.1. Sub-Segment 1
        • 7.4.2. Sub-Segment 2
        • 7.4.3. Sub-Segment 3
        • 7.4.4. Others
      • 7.5. Insights and Forecast – By Country
        • 7.5.1. Brazil
        • 7.5.2. Mexico
        • 7.5.3. Rest of Latin America

      8. Europe Machine Vision Solutions For Industry 4.0 Market Analysis (USD Billion), Insights and Forecast, 2018-2029

      • 8.1. Key Findings / Summary
      • 8.2. Market Analysis, Insights and Forecast – By Segment 1
        • 8.2.1. Sub-Segment 1
        • 8.2.2. Sub-Segment 2
      • 8.3. Market Analysis, Insights and Forecast – By Segment 2
        • 8.3.1. Sub-Segment 1
        • 8.3.2. Sub-Segment 2
        • 8.3.3. Sub-Segment 3
        • 8.3.4. Others
      • 8.4. Market Analysis, Insights and Forecast – By Segment 3
        • 8.4.1. Sub-Segment 1
        • 8.4.2. Sub-Segment 2
        • 8.4.3. Sub-Segment 3
        • 8.4.4. Others
      • 8.5. Market Analysis, Insights and Forecast – By Country
        • 8.5.1. UK
        • 8.5.2. Germany
        • 8.5.3. France
        • 8.5.4. Italy
        • 8.5.5. Spain
        • 8.5.6. Russia
        • 8.5.7. Rest of Europe

      9. Asia Pacific Machine Vision Solutions For Industry 4.0 Market Analysis (USD Billion), Insights and Forecast, 2018-2029

      • 9.1. Key Findings / Summary
      • 9.2. Market Analysis, Insights and Forecast – By Segment 1
        • 9.2.1. Sub-Segment 1
        • 9.2.2. Sub-Segment 2
      • 9.3. Market Analysis, Insights and Forecast – By Segment 2
        • 9.3.1. Sub-Segment 1
        • 9.3.2. Sub-Segment 2
        • 9.3.3. Sub-Segment 3
        • 9.3.4. Others
      • 9.4. Market Analysis, Insights and Forecast – By Segment 3
        • 9.4.1. Sub-Segment 1
        • 9.4.2. Sub-Segment 2
        • 9.4.3. Sub-Segment 3
        • 9.4.4. Others
      • 9.5. Market Analysis, Insights and Forecast – By Country
        • 9.5.1. China
        • 9.5.2. India
        • 9.5.3. Japan
        • 9.5.4. Australia
        • 9.5.5. South East Asia
        • 9.5.6. Rest of Asia Pacific

      10. Middle East & Africa Machine Vision Solutions For Industry 4.0 Market Analysis (USD Billion), Insights and Forecast, 2018-2029

      • 10.1. Key Findings / Summary
      • 10.2. Market Analysis, Insights and Forecast – By Segment 1
        • 10.2.1. Sub-Segment 1
        • 10.2.2. Sub-Segment 2
      • 10.3. Market Analysis, Insights and Forecast – By Segment 2
        • 10.3.1. Sub-Segment 1
        • 10.3.2. Sub-Segment 2
        • 10.3.3. Sub-Segment 3
        • 10.3.4. Others
      • 10.4. Market Analysis, Insights and Forecast – By Segment 3
        • 10.4.1. Sub-Segment 1
        • 10.4.2. Sub-Segment 2
        • 10.4.3. Sub-Segment 3
        • 10.4.4. Others
      • 10.5. Market Analysis, Insights and Forecast – By Country
        • 10.5.1. GCC
        • 10.5.2. South Africa
        • 10.5.3. Rest of Middle East & Africa

      11. Competitive Analysis

      • 11.1. Company Market Share Analysis, 2018
      • 11.2. Key Industry Developments
      • 11.3. Company Profile
        • 11.3.1. Company 1
          • 11.3.1.1. Business Overview
          • 11.3.1.2. Segment 1 & Service Offering
          • 11.3.1.3. Overall Revenue
          • 11.3.1.4. Geographic Presence
          • 11.3.1.5. Recent Development
        *Similar details will be provided for the following companies
        • 11.3.2. Company 2
        • 11.3.3. Company 3
        • 11.3.4. Company 4
        • 11.3.5. Company 5
        • 11.3.6. Company 6
        • 11.3.7. Company 7
        • 11.3.8. Company 8
        • 11.3.9. Company 9
        • 11.3.10. Company 10
        • 11.3.11. Company 11
        • 11.3.12. Company 12
      List of Figures

      Figure 1: Global Machine Vision Solutions For Industry 4.0 Market Revenue Breakdown (USD Billion, %) by Region, 2022 & 2029
      Figure 2: Global Machine Vision Solutions For Industry 4.0 Market Value Share (%), By Segment 1, 2022 & 2029
      Figure 3: Global Machine Vision Solutions For Industry 4.0 Market Forecast (USD Billion), by Sub-Segment 1, 2018-2029
      Figure 4: Global Machine Vision Solutions For Industry 4.0 Market Forecast (USD Billion), by Sub-Segment 2, 2018-2029
      Figure 5: Global Machine Vision Solutions For Industry 4.0 Market Value Share (%), By Segment 2, 2022 & 2029
      Figure 6: Global Machine Vision Solutions For Industry 4.0 Market Forecast (USD Billion), by Sub-Segment 1, 2018-2029
      Figure 7: Global Machine Vision Solutions For Industry 4.0 Market Forecast (USD Billion), by Sub-Segment 2, 2018-2029
      Figure 8: Global Machine Vision Solutions For Industry 4.0 Market Forecast (USD Billion), by Sub-Segment 3, 2018-2029
      Figure 9: Global Machine Vision Solutions For Industry 4.0 Market Forecast (USD Billion), by Others, 2018-2029
      Figure 10: Global Machine Vision Solutions For Industry 4.0 Market Value Share (%), By Segment 3, 2022 & 2029
      Figure 11: Global Machine Vision Solutions For Industry 4.0 Market Forecast (USD Billion), by Sub-Segment 1, 2018-2029
      Figure 12: Global Machine Vision Solutions For Industry 4.0 Market Forecast (USD Billion), by Sub-Segment 2, 2018-2029
      Figure 13: Global Machine Vision Solutions For Industry 4.0 Market Forecast (USD Billion), by Sub-Segment 3, 2018-2029
      Figure 14: Global Machine Vision Solutions For Industry 4.0 Market Forecast (USD Billion), by Others, 2018-2029
      Figure 15: Global Machine Vision Solutions For Industry 4.0 Market Value (USD Billion), by Region, 2022 & 2029
      Figure 16: North America Machine Vision Solutions For Industry 4.0 Market Value Share (%), By Segment 1, 2022 & 2029
      Figure 17: North America Machine Vision Solutions For Industry 4.0 Market Forecast (USD Billion), by Sub-Segment 1, 2018-2029
      Figure 18: North America Machine Vision Solutions For Industry 4.0 Market Forecast (USD Billion), by Sub-Segment 2, 2018-2029
      Figure 19: North America Machine Vision Solutions For Industry 4.0 Market Value Share (%), By Segment 2, 2022 & 2029
      Figure 20: North America Machine Vision Solutions For Industry 4.0 Market Forecast (USD Billion), by Sub-Segment 1, 2018-2029
      Figure 21: North America Machine Vision Solutions For Industry 4.0 Market Forecast (USD Billion), by Sub-Segment 2, 2018-2029
      Figure 22: North America Machine Vision Solutions For Industry 4.0 Market Forecast (USD Billion), by Sub-Segment 3, 2018-2029
      Figure 23: North America Machine Vision Solutions For Industry 4.0 Market Forecast (USD Billion), by Others, 2018-2029
      Figure 24: North America Machine Vision Solutions For Industry 4.0 Market Value Share (%), By Segment 3, 2022 & 2029
      Figure 25: North America Machine Vision Solutions For Industry 4.0 Market Forecast (USD Billion), by Sub-Segment 1, 2018-2029
      Figure 26: North America Machine Vision Solutions For Industry 4.0 Market Forecast (USD Billion), by Sub-Segment 2, 2018-2029
      Figure 27: North America Machine Vision Solutions For Industry 4.0 Market Forecast (USD Billion), by Sub-Segment 3, 2018-2029
      Figure 28: North America Machine Vision Solutions For Industry 4.0 Market Forecast (USD Billion), by Others, 2018-2029
      Figure 29: North America Machine Vision Solutions For Industry 4.0 Market Forecast (USD Billion), by U.S., 2018-2029
      Figure 30: North America Machine Vision Solutions For Industry 4.0 Market Forecast (USD Billion), by Canada, 2018-2029
      Figure 31: Latin America Machine Vision Solutions For Industry 4.0 Market Value Share (%), By Segment 1, 2022 & 2029
      Figure 32: Latin America Machine Vision Solutions For Industry 4.0 Market Forecast (USD Billion), by Sub-Segment 1, 2018-2029
      Figure 33: Latin America Machine Vision Solutions For Industry 4.0 Market Forecast (USD Billion), by Sub-Segment 2, 2018-2029
      Figure 34: Latin America Machine Vision Solutions For Industry 4.0 Market Value Share (%), By Segment 2, 2022 & 2029
      Figure 35: Latin America Machine Vision Solutions For Industry 4.0 Market Forecast (USD Billion), by Sub-Segment 1, 2018-2029
      Figure 36: Latin America Machine Vision Solutions For Industry 4.0 Market Forecast (USD Billion), by Sub-Segment 2, 2018-2029
      Figure 37: Latin America Machine Vision Solutions For Industry 4.0 Market Forecast (USD Billion), by Sub-Segment 3, 2018-2029
      Figure 38: Latin America Machine Vision Solutions For Industry 4.0 Market Forecast (USD Billion), by Others, 2018-2029
      Figure 39: Latin America Machine Vision Solutions For Industry 4.0 Market Value Share (%), By Segment 3, 2022 & 2029
      Figure 40: Latin America Machine Vision Solutions For Industry 4.0 Market Forecast (USD Billion), by Sub-Segment 1, 2018-2029
      Figure 41: Latin America Machine Vision Solutions For Industry 4.0 Market Forecast (USD Billion), by Sub-Segment 2, 2018-2029
      Figure 42: Latin America Machine Vision Solutions For Industry 4.0 Market Forecast (USD Billion), by Sub-Segment 3, 2018-2029
      Figure 43: Latin America Machine Vision Solutions For Industry 4.0 Market Forecast (USD Billion), by Others, 2018-2029
      Figure 44: Latin America Machine Vision Solutions For Industry 4.0 Market Forecast (USD Billion), by Brazil, 2018-2029
      Figure 45: Latin America Machine Vision Solutions For Industry 4.0 Market Forecast (USD Billion), by Mexico, 2018-2029
      Figure 46: Latin America Machine Vision Solutions For Industry 4.0 Market Forecast (USD Billion), by Rest of Latin America, 2018-2029
      Figure 47: Europe Machine Vision Solutions For Industry 4.0 Market Value Share (%), By Segment 1, 2022 & 2029
      Figure 48: Europe Machine Vision Solutions For Industry 4.0 Market Forecast (USD Billion), by Sub-Segment 1, 2018-2029
      Figure 49: Europe Machine Vision Solutions For Industry 4.0 Market Forecast (USD Billion), by Sub-Segment 2, 2018-2029
      Figure 50: Europe Machine Vision Solutions For Industry 4.0 Market Value Share (%), By Segment 2, 2022 & 2029
      Figure 51: Europe Machine Vision Solutions For Industry 4.0 Market Forecast (USD Billion), by Sub-Segment 1, 2018-2029
      Figure 52: Europe Machine Vision Solutions For Industry 4.0 Market Forecast (USD Billion), by Sub-Segment 2, 2018-2029
      Figure 53: Europe Machine Vision Solutions For Industry 4.0 Market Forecast (USD Billion), by Sub-Segment 3, 2018-2029
      Figure 54: Europe Machine Vision Solutions For Industry 4.0 Market Forecast (USD Billion), by Others, 2018-2029
      Figure 55: Europe Machine Vision Solutions For Industry 4.0 Market Value Share (%), By Segment 3, 2022 & 2029
      Figure 56: Europe Machine Vision Solutions For Industry 4.0 Market Forecast (USD Billion), by Sub-Segment 1, 2018-2029
      Figure 57: Europe Machine Vision Solutions For Industry 4.0 Market Forecast (USD Billion), by Sub-Segment 2, 2018-2029
      Figure 58: Europe Machine Vision Solutions For Industry 4.0 Market Forecast (USD Billion), by Sub-Segment 3, 2018-2029
      Figure 59: Europe Machine Vision Solutions For Industry 4.0 Market Forecast (USD Billion), by Others, 2018-2029
      Figure 60: Europe Machine Vision Solutions For Industry 4.0 Market Forecast (USD Billion), by U.K., 2018-2029
      Figure 61: Europe Machine Vision Solutions For Industry 4.0 Market Forecast (USD Billion), by Germany, 2018-2029
      Figure 62: Europe Machine Vision Solutions For Industry 4.0 Market Forecast (USD Billion), by France, 2018-2029
      Figure 63: Europe Machine Vision Solutions For Industry 4.0 Market Forecast (USD Billion), by Italy, 2018-2029
      Figure 64: Europe Machine Vision Solutions For Industry 4.0 Market Forecast (USD Billion), by Spain, 2018-2029
      Figure 65: Europe Machine Vision Solutions For Industry 4.0 Market Forecast (USD Billion), by Russia, 2018-2029
      Figure 66: Europe Machine Vision Solutions For Industry 4.0 Market Forecast (USD Billion), by Rest of Europe, 2018-2029
      Figure 67: Asia Pacific Machine Vision Solutions For Industry 4.0 Market Value Share (%), By Segment 1, 2022 & 2029
      Figure 68: Asia Pacific Machine Vision Solutions For Industry 4.0 Market Forecast (USD Billion), by Sub-Segment 1, 2018-2029
      Figure 69: Asia Pacific Machine Vision Solutions For Industry 4.0 Market Forecast (USD Billion), by Sub-Segment 2, 2018-2029
      Figure 70: Asia Pacific Machine Vision Solutions For Industry 4.0 Market Value Share (%), By Segment 2, 2022 & 2029
      Figure 71: Asia Pacific Machine Vision Solutions For Industry 4.0 Market Forecast (USD Billion), by Sub-Segment 1, 2018-2029
      Figure 72: Asia Pacific Machine Vision Solutions For Industry 4.0 Market Forecast (USD Billion), by Sub-Segment 2, 2018-2029
      Figure 73: Asia Pacific Machine Vision Solutions For Industry 4.0 Market Forecast (USD Billion), by Sub-Segment 3, 2018-2029
      Figure 74: Asia Pacific Machine Vision Solutions For Industry 4.0 Market Forecast (USD Billion), by Others, 2018-2029
      Figure 75: Asia Pacific Machine Vision Solutions For Industry 4.0 Market Value Share (%), By Segment 3, 2022 & 2029
      Figure 76: Asia Pacific Machine Vision Solutions For Industry 4.0 Market Forecast (USD Billion), by Sub-Segment 1, 2018-2029
      Figure 77: Asia Pacific Machine Vision Solutions For Industry 4.0 Market Forecast (USD Billion), by Sub-Segment 2, 2018-2029
      Figure 78: Asia Pacific Machine Vision Solutions For Industry 4.0 Market Forecast (USD Billion), by Sub-Segment 3, 2018-2029
      Figure 79: Asia Pacific Machine Vision Solutions For Industry 4.0 Market Forecast (USD Billion), by Others, 2018-2029
      Figure 80: Asia Pacific Machine Vision Solutions For Industry 4.0 Market Forecast (USD Billion), by China, 2018-2029
      Figure 81: Asia Pacific Machine Vision Solutions For Industry 4.0 Market Forecast (USD Billion), by India, 2018-2029
      Figure 82: Asia Pacific Machine Vision Solutions For Industry 4.0 Market Forecast (USD Billion), by Japan, 2018-2029
      Figure 83: Asia Pacific Machine Vision Solutions For Industry 4.0 Market Forecast (USD Billion), by Australia, 2018-2029
      Figure 84: Asia Pacific Machine Vision Solutions For Industry 4.0 Market Forecast (USD Billion), by Southeast Asia, 2018-2029
      Figure 85: Asia Pacific Machine Vision Solutions For Industry 4.0 Market Forecast (USD Billion), by Rest of Asia Pacific, 2018-2029
      Figure 86: Middle East & Africa Machine Vision Solutions For Industry 4.0 Market Value Share (%), By Segment 1, 2022 & 2029
      Figure 87: Middle East & Africa Machine Vision Solutions For Industry 4.0 Market Forecast (USD Billion), by Sub-Segment 1, 2018-2029
      Figure 88: Middle East & Africa Machine Vision Solutions For Industry 4.0 Market Forecast (USD Billion), by Sub-Segment 2, 2018-2029
      Figure 89: Middle East & Africa Machine Vision Solutions For Industry 4.0 Market Value Share (%), By Segment 2, 2022 & 2029
      Figure 90: Middle East & Africa Machine Vision Solutions For Industry 4.0 Market Forecast (USD Billion), by Sub-Segment 1, 2018-2029
      Figure 91: Middle East & Africa Machine Vision Solutions For Industry 4.0 Market Forecast (USD Billion), by Sub-Segment 2, 2018-2029
      Figure 92: Middle East & Africa Machine Vision Solutions For Industry 4.0 Market Forecast (USD Billion), by Sub-Segment 3, 2018-2029
      Figure 93: Middle East & Africa Machine Vision Solutions For Industry 4.0 Market Forecast (USD Billion), by Others, 2018-2029
      Figure 94: Middle East & Africa Machine Vision Solutions For Industry 4.0 Market Value Share (%), By Segment 3, 2022 & 2029
      Figure 95: Middle East & Africa Machine Vision Solutions For Industry 4.0 Market Forecast (USD Billion), by Sub-Segment 1, 2018-2029
      Figure 96: Middle East & Africa Machine Vision Solutions For Industry 4.0 Market Forecast (USD Billion), by Sub-Segment 2, 2018-2029
      Figure 97: Middle East & Africa Machine Vision Solutions For Industry 4.0 Market Forecast (USD Billion), by Sub-Segment 3, 2018-2029
      Figure 98: Middle East & Africa Machine Vision Solutions For Industry 4.0 Market Forecast (USD Billion), by Others, 2018-2029
      Figure 99: Middle East & Africa Machine Vision Solutions For Industry 4.0 Market Forecast (USD Billion), by GCC, 2018-2029
      Figure 100: Middle East & Africa Machine Vision Solutions For Industry 4.0 Market Forecast (USD Billion), by South Africa, 2018-2029
      Figure 101: Middle East & Africa Machine Vision Solutions For Industry 4.0 Market Forecast (USD Billion), by Rest of Middle East & Africa, 2018-2029 
      List of Tables
      Table 1: Global Machine Vision Solutions For Industry 4.0 Market Revenue (USD Billion) Forecast, by Segment 1, 2018-2029
      Table 2: Global Machine Vision Solutions For Industry 4.0 Market Revenue (USD Billion) Forecast, by Segment 2, 2018-2029
      Table 3: Global Machine Vision Solutions For Industry 4.0 Market Revenue (USD Billion) Forecast, by Segment 3, 2018-2029
      Table 4: Global Machine Vision Solutions For Industry 4.0 Market Revenue (USD Billion) Forecast, by Region, 2018-2029
      Table 5: North America Machine Vision Solutions For Industry 4.0 Market Revenue (USD Billion) Forecast, by Segment 1, 2018-2029
      Table 6: North America Machine Vision Solutions For Industry 4.0 Market Revenue (USD Billion) Forecast, by Segment 2, 2018-2029
      Table 7: North America Machine Vision Solutions For Industry 4.0 Market Revenue (USD Billion) Forecast, by Segment 3, 2018-2029
      Table 8: North America Machine Vision Solutions For Industry 4.0 Market Revenue (USD Billion) Forecast, by Country, 2018-2029
      Table 9: Europe Machine Vision Solutions For Industry 4.0 Market Revenue (USD Billion) Forecast, by Segment 1, 2018-2029
      Table 10: Europe Machine Vision Solutions For Industry 4.0 Market Revenue (USD Billion) Forecast, by Segment 2, 2018-2029
      Table 11: Europe Machine Vision Solutions For Industry 4.0 Market Revenue (USD Billion) Forecast, by Segment 3, 2018-2029
      Table 12: Europe Machine Vision Solutions For Industry 4.0 Market Revenue (USD Billion) Forecast, by Country, 2018-2029
      Table 13: Latin America Machine Vision Solutions For Industry 4.0 Market Revenue (USD Billion) Forecast, by Segment 1, 2018-2029
      Table 14: Latin America Machine Vision Solutions For Industry 4.0 Market Revenue (USD Billion) Forecast, by Segment 2, 2018-2029
      Table 15: Latin America Machine Vision Solutions For Industry 4.0 Market Revenue (USD Billion) Forecast, by Segment 3, 2018-2029
      Table 16: Latin America Machine Vision Solutions For Industry 4.0 Market Revenue (USD Billion) Forecast, by Country, 2018-2029
      Table 17: Asia Pacific Machine Vision Solutions For Industry 4.0 Market Revenue (USD Billion) Forecast, by Segment 1, 2018-2029
      Table 18: Asia Pacific Machine Vision Solutions For Industry 4.0 Market Revenue (USD Billion) Forecast, by Segment 2, 2018-2029
      Table 19: Asia Pacific Machine Vision Solutions For Industry 4.0 Market Revenue (USD Billion) Forecast, by Segment 3, 2018-2029
      Table 20: Asia Pacific Machine Vision Solutions For Industry 4.0 Market Revenue (USD Billion) Forecast, by Country, 2018-2029
      Table 21: Middle East & Africa Machine Vision Solutions For Industry 4.0 Market Revenue (USD Billion) Forecast, by Segment 1, 2018-2029
      Table 22: Middle East & Africa Machine Vision Solutions For Industry 4.0 Market Revenue (USD Billion) Forecast, by Segment 2, 2018-2029
      Table 23: Middle East & Africa Machine Vision Solutions For Industry 4.0 Market Revenue (USD Billion) Forecast, by Segment 3, 2018-2029
      Table 24: Middle East & Africa Machine Vision Solutions For Industry 4.0 Market Revenue (USD Billion) Forecast, by Country, 2018-2029
      Research Process

      Data Library Research are conducted by industry experts who offer insight on industry structure, market segmentations technology assessment and competitive landscape (CL), and penetration, as well as on emerging trends. Their analysis is based on primary interviews (~ 80%) and secondary research (~ 20%) as well as years of professional expertise in their respective industries. Adding to this, by analysing historical trends and current market positions, our analysts predict where the market will be headed for the next five years. Furthermore, the varying trends of segment & categories geographically presented are also studied and the estimated based on the primary & secondary research.

      In this particular report from the supply side Data Library Research has conducted primary surveys (interviews) with the key level executives (VP, CEO’s, Marketing Director, Business Development Manager and SOFT) of the companies that active & prominent as well as the midsized organization

      FIGURE 1: DLR RESEARH PROCESS

      research-methodology1

      Primary Research

      Extensive primary research was conducted to gain a deeper insight of the market and industry performance. The analysis is based on both primary and secondary research as well as years of professional expertise in the respective industries.

      In addition to analysing current and historical trends, our analysts predict where the market is headed over the next five years.

      It varies by segment for these categories geographically presented in the list of market tables. Speaking about this particular report we have conducted primary surveys (interviews) with the key level executives (VP, CEO’s, Marketing Director, Business Development Manager and many more) of the major players active in the market.

      Secondary Research

      Secondary research was mainly used to collect and identify information useful for the extensive, technical, market-oriented, and Friend’s study of the Global Extra Neutral Alcohol. It was also used to obtain key information about major players, market classification and segmentation according to the industry trends, geographical markets, and developments related to the market and technology perspectives. For this study, analysts have gathered information from various credible sources, such as annual reports, sec filings, journals, white papers, SOFT presentations, and company web sites.

      Market Size Estimation

      Both, top-down and bottom-up approaches were used to estimate and validate the size of the Global market and to estimate the size of various other dependent submarkets in the overall Extra Neutral Alcohol. The key players in the market were identified through secondary research and their market contributions in the respective geographies were determined through primary and secondary research.

      Forecast Model

      research-methodology2

      Happy to Assist You

      If you have a question?

      info@datalibraryresearch.com

      IND : +91 955 279 0357

      Browse Related Reports