Magnetic Image Sensing Devices Market Overview and Analysis:
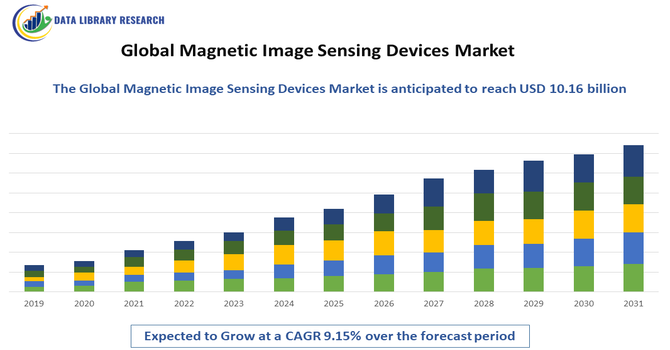
- The Global Magnetic Image Sensing Devices Market, valued at approximately USD 5.06 billion in 2025, is primarily driven by the proliferation of electric vehicles (EVs) and industrial automation. It is forecasted to grow substantially, reaching around USD 10.16 billion by 2032, reflecting a robust projected CAGR of 9.15%, 2025-2032.
Get Complete Analysis Of The Report - Download Updated Free Sample PDF
The Global Magnetic Image Sensing Devices Market is experiencing steady growth driven by the rising need for high-accuracy magnetic field detection across consumer electronics, automotive safety systems, medical imaging, and industrial automation. Increasing integration of magnetic sensing technologies in smartphones, wearables, and advanced driver-assistance systems (ADAS), along with growing adoption in robotics and smart manufacturing, is further accelerating market expansion. Continuous advancements in sensor miniaturization, improved sensitivity, and low-power designs are also contributing to stronger market demand over the forecast period.
Magnetic Image Sensing Devices Market Latest Trends:
The Global Magnetic Image Sensing Devices Market is witnessing several emerging trends, including a strong shift toward ultra-miniaturized and high-precision sensors designed for next-generation consumer electronics, wearables, and IoT devices. There is rising integration of magnetic image sensing technologies into smart automation, robotics, and electric vehicles, driven by the need for accurate position, speed, and motion detection. Advancements in sensor sensitivity, lower power consumption, and improved durability are further shaping product innovations. Additionally, increasing adoption of magnetic image sensing solutions in healthcare diagnostics, industrial automation, and non-destructive testing is broadening the technology’s application scope, supporting continuous market evolution.
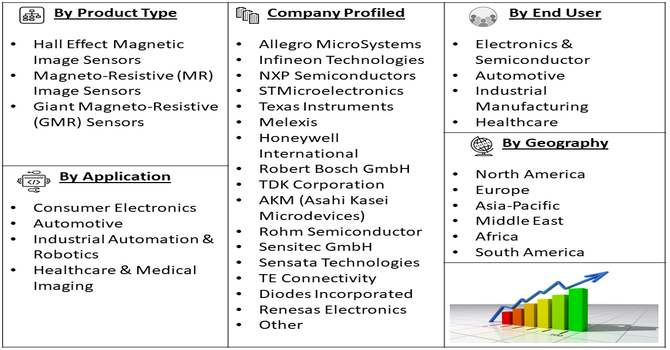
Segmentation: Global Magnetic Image Sensing Devices Market is segmented By Type (Hall Effect Magnetic Image Sensors, Magneto-Resistive (MR) Image Sensors, Giant Magneto-Resistive (GMR) Sensors), Component (Sensor Elements, Signal Conditioning Circuits, Processing Units, Packaging Modules), Application (Consumer Electronics, Automotive, Industrial Automation & Robotics, Healthcare & Medical Imaging), End-Use Industry (Electronics & Semiconductor, Automotive, Industrial Manufacturing, Healthcare), and Geography (North America, Europe, Asia-Pacific, Middle East and Africa, and South America). The report provides the value (in USD million) for the above segments.
For Detailed Market Segmentation - Get a Free Sample PDF
Market Drivers:
- Rising Demand for High-Precision Sensing in Consumer Electronics and Automotive Applications
One of the major drivers of the Global Magnetic Image Sensing Devices Market is the growing need for high-precision and reliable sensing technologies in advanced consumer electronics and automotive systems. Modern smartphones, tablets, AR/VR devices, and wearables increasingly rely on magnetic image sensing for accurate position tracking, motion detection, and orientation measurement.
In the automotive sector, the expansion of advanced driver-assistance systems (ADAS), electric vehicles (EVs), and autonomous driving technologies is significantly boosting the adoption of magnetic sensing devices for speed, angle, torque, and position measurement. Their ability to function in harsh environments, provide contactless sensing, and deliver superior accuracy makes them essential components for next-generation mobility and smart devices.
- Growing Adoption of Industrial Automation, Robotics, and Smart Manufacturing
Another key driver is the rising implementation of industrial automation and robotics across manufacturing, logistics, and process industries. Magnetic image sensing devices play a vital role in ensuring precise equipment positioning, machine health monitoring, robotic arm movement tracking, and high-accuracy control systems.
As industries shift toward Industry 4.0 and smart factory frameworks, the demand for advanced sensing technologies capable of delivering real-time, stable, and interference-free measurements is accelerating. Magnetic image sensors, with their durability, low maintenance needs, and strong performance in challenging environments such as high temperatures or electromagnetic noise, are increasingly being adopted to enhance operational efficiency, quality assurance, and safety in industrial setups.
Market Restraints:
- High Cost of Advanced Magnetic Sensing Technologies
One of the major restraints for the Global Magnetic Image Sensing Devices Market is the high cost associated with advanced sensor technologies such as TMR (Tunnel Magneto-Resistive) and GMR (Giant Magneto-Resistive) sensors. These devices require complex materials, precision fabrication processes, and advanced packaging techniques to achieve high sensitivity and reliability. As a result, their manufacturing costs remain significantly higher than traditional sensing technologies. This cost factor limits adoption among price-sensitive industries and reduces their penetration in mass-market consumer electronics, ultimately slowing overall market growth.
Socioeconomic Impact on Magnetic Image Sensing Devices Market
The global magnetic image sensing devices market positively impacts society by enabling more accurate, non-invasive diagnostics and advanced imaging in healthcare, improving early detection of neurological, cardiovascular, and other chronic diseases. Widespread use of such devices enhances accessibility to quality healthcare, especially where traditional imaging solutions are limited, reducing long-term treatment costs and improving patient outcomes. Industrial and automotive sectors also benefit through enhanced automation, safety, and device reliability, which drive productivity and economic growth. Overall, these technologies help modernize health systems and industry infrastructure worldwide.
Segmental Analysis:
- Hall Effect Magnetic Image Sensors segment is expected to witness the highest growth over the forecast period
Hall Effect Magnetic Image Sensors dominate this segment due to their wide applicability, cost-effectiveness, and strong performance in detecting position, proximity, and speed. Their extensive use in automotive systems, consumer electronics, and industrial machinery continues to drive steady demand, supported by advancements in sensor miniaturization and durability.
- Sensor Elements segment is expected to witness the highest growth over the forecast period
Sensor elements form the core of magnetic image sensing devices, and this segment shows strong growth as manufacturers increasingly focus on enhancing sensitivity, accuracy, and low-power operation. Innovations in MR and TMR sensing materials are further boosting the adoption of high-performance sensor elements in advanced electronics and automation systems.
- Automotive segment is expected to witness the highest growth over the forecast period
The automotive segment is a major growth driver, propelled by the rising implementation of magnetic sensing technologies in electric vehicles (EVs), advanced driver-assistance systems (ADAS), and autonomous driving features. Magnetic sensors support critical functions such as torque measurement, position detection, and motor control, making them essential in modern vehicle architectures.
- Electronics & Semiconductor segment is expected to witness the highest growth over the forecast period
The electronics & semiconductor industry holds a significant share as magnetic image sensing devices are increasingly integrated into smartphones, wearables, IoT devices, and consumer gadgets. Growing demand for compact, high-precision sensors that ensure enhanced performance and energy efficiency strongly supports this segment’s expansion.
- North America region is expected to witness the highest growth over the forecast period
North America is expected to witness the highest growth over the forecast period, driven by rapid technological advancements, strong adoption of high-performance sensing solutions, and increasing integration of magnetic image sensing devices in automotive safety systems, advanced consumer electronics, and industrial automation.
The presence of leading sensor manufacturers, expanding EV adoption, and rising demand for precision sensing in healthcare and robotics further strengthen the region’s growth trajectory. For instance, in June 2025, Sikorsky and CAE collaborated to deliver the CAE MAD-XR system for U.S. and Australian MH-60R SEAHAWK® helicopters, integrating passive digital magnetic anomaly detection sensors. This advanced technology enhances submarine detection capabilities, driving demand for magnetic image sensing devices in defense applications and strengthening growth in the U.S. magnetic image sensing devices market.
Similarly, in 2024, Siemens Healthineers introduced Magnetom Flow1, a 1.5 T MRI system with Dry Cool technology, drastically reducing helium usage and eliminating the quench pipe. Its AI-driven image reconstruction and high automation enhance efficiency and image quality, boosting demand for advanced magnetic image sensing devices in the U.S. healthcare sector and supporting market growth.
| Report Matrics |
Details |
| Market Size Value |
USD 10.16 billion |
| Growth Rate |
CAGR of 9.15 % |
| Forecast |
2026-2033 |
| Historical data |
2021-2024 |
| Base Year |
2025 |
| Report Coverage |
Forecasted revenue, company rating, competitive environment, growth drivers, and trends |
| Segment Coverage |
Type, Application, End-User, Geography |
| Regional Scope |
North America, Europe, Asia Pacific, Middle East |
| Customized scope |
Free customization of reports (With 3 months of analysis support) |
| To Learn More About This Report |
Request a Free Sample Copy |
Magnetic Image Sensing Devices Market Competitive Landscape:
The Global Magnetic Image Sensing Devices market is highly competitive and innovation-driven, with established semiconductor and sensor manufacturers investing heavily in R&D, miniaturization, and low-power, high-sensitivity solutions to differentiate their product portfolios. Companies compete on technology (e.g., Hall-effect vs. MR/TMR/GMR), integration (sensor + signal conditioning + processing), cost-efficiency, and partnerships with OEMs in automotive, consumer electronics, and industrial automation. Market players also pursue strategic collaborations, acquisitions, and regional expansion to secure supply chains and scale production, while smaller specialized firms focus on niche, high-performance spintronic or magnetoresistive technologies to challenge incumbents.
The major players for this market are:
- Allegro MicroSystems
- Infineon Technologies
- NXP Semiconductors
- STMicroelectronics
- Texas Instruments
- Melexis
- Honeywell International
- Robert Bosch GmbH
- TDK Corporation
- AKM (Asahi Kasei Microdevices)
- Rohm Semiconductor
- Sensitec GmbH
- Sensata Technologies
- TE Connectivity
- Diodes Incorporated
- Renesas Electronics
- NVE Corporation
- Crocus Technology
- Micronas
Recent Development
- In October 2025, Renesas Electronics launched a new family of magnet-free inductive position sensor ICs, offering high-resolution, precise, and cost-effective alternatives to traditional magnetic and optical encoders. These versatile sensors, suitable for robotics, medical, smart buildings, and motor applications, along with a web-based customization tool, are expected to accelerate adoption and drive growth in the global magnetic image sensing devices market.
- In October 2025, TDK Corporation introduced new TMR sensors for gaming applications, enhancing precision, fast response, compactness, and low power consumption in keyboards, controllers, mice, AR/VR devices, and peripherals. This expansion of high-performance, customizable sensing solutions is expected to boost adoption and contribute significantly to growth in the global magnetic image sensing devices market.
Frequently Asked Questions (FAQ) :
Q1. What are the main growth-driving factors for this market?
The biggest driver is the rapid global expansion of the automotive sector, specifically Electric Vehicles (EVs) and Advanced Driver Assistance Systems (ADAS). Magnetic sensors are essential for precise motor control, speed sensing, and battery management, alongside increasing demand in industrial automation and consumer electronics like smartphones.
Q2. What are the main restraining factors for this market?
High initial investment and operational costs pose a significant constraint, especially for developing advanced, high-precision sensors. Furthermore, intense price competition, particularly in Asia-Pacific's high-volume consumer electronics sector, pressures profit margins for manufacturers of commodity-grade sensors.
Q3. Which segment is expected to witness high growth?
The automotive segment is expected to witness the highest growth due to increasing adoption of magnetic image sensing devices for advanced driver-assistance systems, electric vehicle motor control, and in-vehicle navigation. Rising demand for vehicle safety, automation, and performance optimization is driving rapid integration of these devices across the automotive industry.
Q4. Who are the top major players for this market?
The market is led by major semiconductor and technology companies. Key global players include Infineon Technologies, TDK Corporation, NXP Semiconductors, Allegro MicroSystems, and STMicroelectronics. These firms supply the core magnetic sensing components to various end-user industries.
Q5. Which country is the largest player?
China is generally the dominant force, especially within the Asia-Pacific region, which holds the largest market share. This dominance is driven by China's colossal electronics manufacturing industry, large-scale industrial automation initiatives, and leading position in global electric vehicle production.
List of Figures
Figure 1: Global Magnetic Image Sensing Devices Market Revenue Breakdown (USD Billion, %) by Region, 2022 & 2029
Figure 2: Global Magnetic Image Sensing Devices Market Value Share (%), By Segment 1, 2022 & 2029
Figure 3: Global Magnetic Image Sensing Devices Market Forecast (USD Billion), by Sub-Segment 1, 2018-2029
Figure 4: Global Magnetic Image Sensing Devices Market Forecast (USD Billion), by Sub-Segment 2, 2018-2029
Figure 5: Global Magnetic Image Sensing Devices Market Value Share (%), By Segment 2, 2022 & 2029
Figure 6: Global Magnetic Image Sensing Devices Market Forecast (USD Billion), by Sub-Segment 1, 2018-2029
Figure 7: Global Magnetic Image Sensing Devices Market Forecast (USD Billion), by Sub-Segment 2, 2018-2029
Figure 8: Global Magnetic Image Sensing Devices Market Forecast (USD Billion), by Sub-Segment 3, 2018-2029
Figure 9: Global Magnetic Image Sensing Devices Market Forecast (USD Billion), by Others, 2018-2029
Figure 10: Global Magnetic Image Sensing Devices Market Value Share (%), By Segment 3, 2022 & 2029
Figure 11: Global Magnetic Image Sensing Devices Market Forecast (USD Billion), by Sub-Segment 1, 2018-2029
Figure 12: Global Magnetic Image Sensing Devices Market Forecast (USD Billion), by Sub-Segment 2, 2018-2029
Figure 13: Global Magnetic Image Sensing Devices Market Forecast (USD Billion), by Sub-Segment 3, 2018-2029
Figure 14: Global Magnetic Image Sensing Devices Market Forecast (USD Billion), by Others, 2018-2029
Figure 15: Global Magnetic Image Sensing Devices Market Value (USD Billion), by Region, 2022 & 2029
Figure 16: North America Magnetic Image Sensing Devices Market Value Share (%), By Segment 1, 2022 & 2029
Figure 17: North America Magnetic Image Sensing Devices Market Forecast (USD Billion), by Sub-Segment 1, 2018-2029
Figure 18: North America Magnetic Image Sensing Devices Market Forecast (USD Billion), by Sub-Segment 2, 2018-2029
Figure 19: North America Magnetic Image Sensing Devices Market Value Share (%), By Segment 2, 2022 & 2029
Figure 20: North America Magnetic Image Sensing Devices Market Forecast (USD Billion), by Sub-Segment 1, 2018-2029
Figure 21: North America Magnetic Image Sensing Devices Market Forecast (USD Billion), by Sub-Segment 2, 2018-2029
Figure 22: North America Magnetic Image Sensing Devices Market Forecast (USD Billion), by Sub-Segment 3, 2018-2029
Figure 23: North America Magnetic Image Sensing Devices Market Forecast (USD Billion), by Others, 2018-2029
Figure 24: North America Magnetic Image Sensing Devices Market Value Share (%), By Segment 3, 2022 & 2029
Figure 25: North America Magnetic Image Sensing Devices Market Forecast (USD Billion), by Sub-Segment 1, 2018-2029
Figure 26: North America Magnetic Image Sensing Devices Market Forecast (USD Billion), by Sub-Segment 2, 2018-2029
Figure 27: North America Magnetic Image Sensing Devices Market Forecast (USD Billion), by Sub-Segment 3, 2018-2029
Figure 28: North America Magnetic Image Sensing Devices Market Forecast (USD Billion), by Others, 2018-2029
Figure 29: North America Magnetic Image Sensing Devices Market Forecast (USD Billion), by U.S., 2018-2029
Figure 30: North America Magnetic Image Sensing Devices Market Forecast (USD Billion), by Canada, 2018-2029
Figure 31: Latin America Magnetic Image Sensing Devices Market Value Share (%), By Segment 1, 2022 & 2029
Figure 32: Latin America Magnetic Image Sensing Devices Market Forecast (USD Billion), by Sub-Segment 1, 2018-2029
Figure 33: Latin America Magnetic Image Sensing Devices Market Forecast (USD Billion), by Sub-Segment 2, 2018-2029
Figure 34: Latin America Magnetic Image Sensing Devices Market Value Share (%), By Segment 2, 2022 & 2029
Figure 35: Latin America Magnetic Image Sensing Devices Market Forecast (USD Billion), by Sub-Segment 1, 2018-2029
Figure 36: Latin America Magnetic Image Sensing Devices Market Forecast (USD Billion), by Sub-Segment 2, 2018-2029
Figure 37: Latin America Magnetic Image Sensing Devices Market Forecast (USD Billion), by Sub-Segment 3, 2018-2029
Figure 38: Latin America Magnetic Image Sensing Devices Market Forecast (USD Billion), by Others, 2018-2029
Figure 39: Latin America Magnetic Image Sensing Devices Market Value Share (%), By Segment 3, 2022 & 2029
Figure 40: Latin America Magnetic Image Sensing Devices Market Forecast (USD Billion), by Sub-Segment 1, 2018-2029
Figure 41: Latin America Magnetic Image Sensing Devices Market Forecast (USD Billion), by Sub-Segment 2, 2018-2029
Figure 42: Latin America Magnetic Image Sensing Devices Market Forecast (USD Billion), by Sub-Segment 3, 2018-2029
Figure 43: Latin America Magnetic Image Sensing Devices Market Forecast (USD Billion), by Others, 2018-2029
Figure 44: Latin America Magnetic Image Sensing Devices Market Forecast (USD Billion), by Brazil, 2018-2029
Figure 45: Latin America Magnetic Image Sensing Devices Market Forecast (USD Billion), by Mexico, 2018-2029
Figure 46: Latin America Magnetic Image Sensing Devices Market Forecast (USD Billion), by Rest of Latin America, 2018-2029
Figure 47: Europe Magnetic Image Sensing Devices Market Value Share (%), By Segment 1, 2022 & 2029
Figure 48: Europe Magnetic Image Sensing Devices Market Forecast (USD Billion), by Sub-Segment 1, 2018-2029
Figure 49: Europe Magnetic Image Sensing Devices Market Forecast (USD Billion), by Sub-Segment 2, 2018-2029
Figure 50: Europe Magnetic Image Sensing Devices Market Value Share (%), By Segment 2, 2022 & 2029
Figure 51: Europe Magnetic Image Sensing Devices Market Forecast (USD Billion), by Sub-Segment 1, 2018-2029
Figure 52: Europe Magnetic Image Sensing Devices Market Forecast (USD Billion), by Sub-Segment 2, 2018-2029
Figure 53: Europe Magnetic Image Sensing Devices Market Forecast (USD Billion), by Sub-Segment 3, 2018-2029
Figure 54: Europe Magnetic Image Sensing Devices Market Forecast (USD Billion), by Others, 2018-2029
Figure 55: Europe Magnetic Image Sensing Devices Market Value Share (%), By Segment 3, 2022 & 2029
Figure 56: Europe Magnetic Image Sensing Devices Market Forecast (USD Billion), by Sub-Segment 1, 2018-2029
Figure 57: Europe Magnetic Image Sensing Devices Market Forecast (USD Billion), by Sub-Segment 2, 2018-2029
Figure 58: Europe Magnetic Image Sensing Devices Market Forecast (USD Billion), by Sub-Segment 3, 2018-2029
Figure 59: Europe Magnetic Image Sensing Devices Market Forecast (USD Billion), by Others, 2018-2029
Figure 60: Europe Magnetic Image Sensing Devices Market Forecast (USD Billion), by U.K., 2018-2029
Figure 61: Europe Magnetic Image Sensing Devices Market Forecast (USD Billion), by Germany, 2018-2029
Figure 62: Europe Magnetic Image Sensing Devices Market Forecast (USD Billion), by France, 2018-2029
Figure 63: Europe Magnetic Image Sensing Devices Market Forecast (USD Billion), by Italy, 2018-2029
Figure 64: Europe Magnetic Image Sensing Devices Market Forecast (USD Billion), by Spain, 2018-2029
Figure 65: Europe Magnetic Image Sensing Devices Market Forecast (USD Billion), by Russia, 2018-2029
Figure 66: Europe Magnetic Image Sensing Devices Market Forecast (USD Billion), by Rest of Europe, 2018-2029
Figure 67: Asia Pacific Magnetic Image Sensing Devices Market Value Share (%), By Segment 1, 2022 & 2029
Figure 68: Asia Pacific Magnetic Image Sensing Devices Market Forecast (USD Billion), by Sub-Segment 1, 2018-2029
Figure 69: Asia Pacific Magnetic Image Sensing Devices Market Forecast (USD Billion), by Sub-Segment 2, 2018-2029
Figure 70: Asia Pacific Magnetic Image Sensing Devices Market Value Share (%), By Segment 2, 2022 & 2029
Figure 71: Asia Pacific Magnetic Image Sensing Devices Market Forecast (USD Billion), by Sub-Segment 1, 2018-2029
Figure 72: Asia Pacific Magnetic Image Sensing Devices Market Forecast (USD Billion), by Sub-Segment 2, 2018-2029
Figure 73: Asia Pacific Magnetic Image Sensing Devices Market Forecast (USD Billion), by Sub-Segment 3, 2018-2029
Figure 74: Asia Pacific Magnetic Image Sensing Devices Market Forecast (USD Billion), by Others, 2018-2029
Figure 75: Asia Pacific Magnetic Image Sensing Devices Market Value Share (%), By Segment 3, 2022 & 2029
Figure 76: Asia Pacific Magnetic Image Sensing Devices Market Forecast (USD Billion), by Sub-Segment 1, 2018-2029
Figure 77: Asia Pacific Magnetic Image Sensing Devices Market Forecast (USD Billion), by Sub-Segment 2, 2018-2029
Figure 78: Asia Pacific Magnetic Image Sensing Devices Market Forecast (USD Billion), by Sub-Segment 3, 2018-2029
Figure 79: Asia Pacific Magnetic Image Sensing Devices Market Forecast (USD Billion), by Others, 2018-2029
Figure 80: Asia Pacific Magnetic Image Sensing Devices Market Forecast (USD Billion), by China, 2018-2029
Figure 81: Asia Pacific Magnetic Image Sensing Devices Market Forecast (USD Billion), by India, 2018-2029
Figure 82: Asia Pacific Magnetic Image Sensing Devices Market Forecast (USD Billion), by Japan, 2018-2029
Figure 83: Asia Pacific Magnetic Image Sensing Devices Market Forecast (USD Billion), by Australia, 2018-2029
Figure 84: Asia Pacific Magnetic Image Sensing Devices Market Forecast (USD Billion), by Southeast Asia, 2018-2029
Figure 85: Asia Pacific Magnetic Image Sensing Devices Market Forecast (USD Billion), by Rest of Asia Pacific, 2018-2029
Figure 86: Middle East & Africa Magnetic Image Sensing Devices Market Value Share (%), By Segment 1, 2022 & 2029
Figure 87: Middle East & Africa Magnetic Image Sensing Devices Market Forecast (USD Billion), by Sub-Segment 1, 2018-2029
Figure 88: Middle East & Africa Magnetic Image Sensing Devices Market Forecast (USD Billion), by Sub-Segment 2, 2018-2029
Figure 89: Middle East & Africa Magnetic Image Sensing Devices Market Value Share (%), By Segment 2, 2022 & 2029
Figure 90: Middle East & Africa Magnetic Image Sensing Devices Market Forecast (USD Billion), by Sub-Segment 1, 2018-2029
Figure 91: Middle East & Africa Magnetic Image Sensing Devices Market Forecast (USD Billion), by Sub-Segment 2, 2018-2029
Figure 92: Middle East & Africa Magnetic Image Sensing Devices Market Forecast (USD Billion), by Sub-Segment 3, 2018-2029
Figure 93: Middle East & Africa Magnetic Image Sensing Devices Market Forecast (USD Billion), by Others, 2018-2029
Figure 94: Middle East & Africa Magnetic Image Sensing Devices Market Value Share (%), By Segment 3, 2022 & 2029
Figure 95: Middle East & Africa Magnetic Image Sensing Devices Market Forecast (USD Billion), by Sub-Segment 1, 2018-2029
Figure 96: Middle East & Africa Magnetic Image Sensing Devices Market Forecast (USD Billion), by Sub-Segment 2, 2018-2029
Figure 97: Middle East & Africa Magnetic Image Sensing Devices Market Forecast (USD Billion), by Sub-Segment 3, 2018-2029
Figure 98: Middle East & Africa Magnetic Image Sensing Devices Market Forecast (USD Billion), by Others, 2018-2029
Figure 99: Middle East & Africa Magnetic Image Sensing Devices Market Forecast (USD Billion), by GCC, 2018-2029
Figure 100: Middle East & Africa Magnetic Image Sensing Devices Market Forecast (USD Billion), by South Africa, 2018-2029
Figure 101: Middle East & Africa Magnetic Image Sensing Devices Market Forecast (USD Billion), by Rest of Middle East & Africa, 2018-2029
List of Tables
Table 1: Global Magnetic Image Sensing Devices Market Revenue (USD Billion) Forecast, by Segment 1, 2018-2029
Table 2: Global Magnetic Image Sensing Devices Market Revenue (USD Billion) Forecast, by Segment 2, 2018-2029
Table 3: Global Magnetic Image Sensing Devices Market Revenue (USD Billion) Forecast, by Segment 3, 2018-2029
Table 4: Global Magnetic Image Sensing Devices Market Revenue (USD Billion) Forecast, by Region, 2018-2029
Table 5: North America Magnetic Image Sensing Devices Market Revenue (USD Billion) Forecast, by Segment 1, 2018-2029
Table 6: North America Magnetic Image Sensing Devices Market Revenue (USD Billion) Forecast, by Segment 2, 2018-2029
Table 7: North America Magnetic Image Sensing Devices Market Revenue (USD Billion) Forecast, by Segment 3, 2018-2029
Table 8: North America Magnetic Image Sensing Devices Market Revenue (USD Billion) Forecast, by Country, 2018-2029
Table 9: Europe Magnetic Image Sensing Devices Market Revenue (USD Billion) Forecast, by Segment 1, 2018-2029
Table 10: Europe Magnetic Image Sensing Devices Market Revenue (USD Billion) Forecast, by Segment 2, 2018-2029
Table 11: Europe Magnetic Image Sensing Devices Market Revenue (USD Billion) Forecast, by Segment 3, 2018-2029
Table 12: Europe Magnetic Image Sensing Devices Market Revenue (USD Billion) Forecast, by Country, 2018-2029
Table 13: Latin America Magnetic Image Sensing Devices Market Revenue (USD Billion) Forecast, by Segment 1, 2018-2029
Table 14: Latin America Magnetic Image Sensing Devices Market Revenue (USD Billion) Forecast, by Segment 2, 2018-2029
Table 15: Latin America Magnetic Image Sensing Devices Market Revenue (USD Billion) Forecast, by Segment 3, 2018-2029
Table 16: Latin America Magnetic Image Sensing Devices Market Revenue (USD Billion) Forecast, by Country, 2018-2029
Table 17: Asia Pacific Magnetic Image Sensing Devices Market Revenue (USD Billion) Forecast, by Segment 1, 2018-2029
Table 18: Asia Pacific Magnetic Image Sensing Devices Market Revenue (USD Billion) Forecast, by Segment 2, 2018-2029
Table 19: Asia Pacific Magnetic Image Sensing Devices Market Revenue (USD Billion) Forecast, by Segment 3, 2018-2029
Table 20: Asia Pacific Magnetic Image Sensing Devices Market Revenue (USD Billion) Forecast, by Country, 2018-2029
Table 21: Middle East & Africa Magnetic Image Sensing Devices Market Revenue (USD Billion) Forecast, by Segment 1, 2018-2029
Table 22: Middle East & Africa Magnetic Image Sensing Devices Market Revenue (USD Billion) Forecast, by Segment 2, 2018-2029
Table 23: Middle East & Africa Magnetic Image Sensing Devices Market Revenue (USD Billion) Forecast, by Segment 3, 2018-2029
Table 24: Middle East & Africa Magnetic Image Sensing Devices Market Revenue (USD Billion) Forecast, by Country, 2018-2029
Research Process
Data Library Research are conducted by industry experts who offer insight on
industry structure, market segmentations technology assessment and competitive landscape (CL), and penetration, as well as on emerging trends. Their analysis is based on primary interviews (~ 80%) and secondary research (~ 20%) as well as years of professional expertise in their respective industries. Adding to this, by analysing historical trends and current market positions, our analysts predict where the market will be headed for the next five years. Furthermore, the varying trends of segment & categories geographically presented are also studied and the estimated based on the primary & secondary research.
In this particular report from the supply side Data Library Research has conducted primary surveys (interviews) with the key level executives (VP, CEO’s, Marketing Director, Business Development Manager
and SOFT) of the companies that active & prominent as well as the midsized organization
FIGURE 1: DLR RESEARH PROCESS
![research-methodology1]()
Primary Research
Extensive primary research was conducted to gain a deeper insight of the market and industry performance. The analysis is based on both primary and secondary research as well as years of professional expertise in the respective industries.
In addition to analysing current and historical trends, our analysts predict where the market is headed over the next five years.
It varies by segment for these categories geographically presented in the list of market tables. Speaking about this particular report we have conducted primary surveys (interviews) with the key level executives (VP, CEO’s, Marketing Director, Business Development Manager and many more) of the major players active in the market.
Secondary Research
Secondary research was mainly used to collect and identify information useful for the extensive, technical, market-oriented, and Friend’s study of the Global Extra Neutral Alcohol. It was also used to obtain key information about major players, market classification and segmentation according to the industry trends, geographical markets, and developments related to the market and technology perspectives. For this study, analysts have gathered information from various credible sources, such as annual reports, sec filings, journals, white papers, SOFT presentations, and company web sites.
Market Size Estimation
Both, top-down and bottom-up approaches were used to estimate and validate the size of the Global market and to estimate the size of various other dependent submarkets in the overall Extra Neutral Alcohol. The key players in the market were identified through secondary research and their market contributions in the respective geographies were determined through primary and secondary research.
Forecast Model
![research-methodology2]()