Get Complete Analysis Of The Report - Download Updated Free Sample PDF
The Global Manned Submersible Vehicle Market encompasses the design, manufacture, and deployment of underwater vehicles capable of carrying human occupants for deep-sea exploration, research, and industrial applications. These vehicles are widely used in scientific research, marine biology, oil and gas exploration, defense, and tourism. Growth is driven by increasing investment in oceanographic research, rising demand for deep-sea resource exploration, and technological advancements in pressure-resistant materials, navigation systems, and life-support mechanisms.
The global manned submersible vehicle market is driven by advancements in deep-sea technology, materials, and navigation systems. Recent trends include the development of hybrid submersibles, ultra-deep diving vehicles, and modular designs to support longer missions with enhanced safety. Growing interest in deep-sea exploration for natural resources, scientific research, and marine tourism is accelerating demand. Integration of advanced sonar, robotics, and AI-assisted navigation improves operational efficiency and reduces human risk.
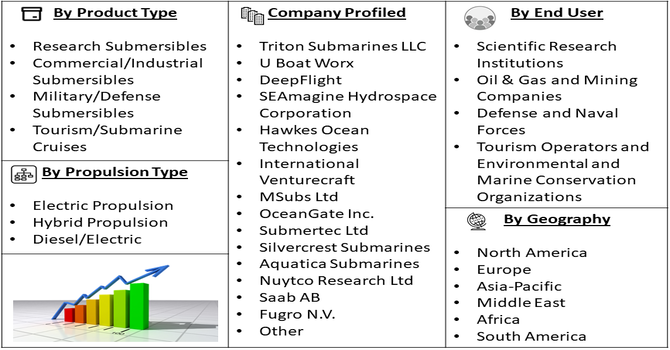
Segmentation: The Global Manned Submersible Vehicle Market is segmented by Type (Research Submersibles, Commercial/Industrial Submersibles, Military/Defense Submersibles and Tourism/Submarine Cruises), Depth Capability (Shallow Water Submersibles (up to 500 meters), Mid-Depth Submersibles (500–2,000 meters), Deep Water Submersibles (2,000–6,000 meters) and Ultra-Deep Submersibles (6,000+ meters)), Propulsion Type (Electric Propulsion, Hybrid Propulsion and Diesel/Electric), End User (Scientific Research Institutions, Oil & Gas and Mining Companies, Defense and Naval Forces, Tourism Operators and Environmental and Marine Conservation Organizations), and Geography (North America, Europe, Asia-Pacific, Middle East and Africa, and South America). The report provides the value (in USD million) for the above segments.
For Detailed Market Segmentation - Get a Free Sample PDF
Market Drivers:
The global manned submersible vehicle market is driven by increasing demand for deep-sea exploration in scientific research, marine biology, resource extraction, and environmental monitoring. Governments, research institutions, and private companies are investing heavily in understanding ocean ecosystems, mapping the seabed, and discovering natural resources such as oil, gas, and minerals. Rising interest in marine conservation and climate change studies also fuels demand for advanced submersibles capable of reaching extreme depths. Additionally, expanding commercial applications, including deep-sea tourism and underwater filming, support market growth. The continuous push for new discoveries and operational capabilities ensures strong adoption of manned submersible vehicles worldwide.
Advancements in materials, propulsion systems, life-support technologies, and navigation systems are driving the growth of the global manned submersible vehicle market. Innovations in pressure-resistant hulls, energy-efficient propulsion, and AI-assisted navigation enhance safety, operational depth, and mission duration.
In September 2025, Babcock International and HII signed a memorandum to integrate REMUS UUVs with Babcock’s submarine Weapon Handling and Launch Systems. This collaboration advanced the global manned submersible vehicle market by enhancing autonomous underwater vehicle deployment capabilities, strengthening allied navies’ undersea operations, and driving innovation in submarine technology. Hybrid submersibles and modular designs allow greater flexibility for scientific, industrial, and tourism applications. Integration of high-resolution imaging, sonar, and robotic arms expands research and operational capabilities. Partnerships between technology companies, research institutions, and defense organizations accelerate development of cutting-edge submersibles.
Market Restraints:
High costs and operational complexity remain significant restraints for the manned submersible vehicle market. Designing, manufacturing, and maintaining crewed submersibles requires substantial capital investment due to specialized materials, advanced propulsion, and life-support systems. Operational expenses, including skilled personnel, maintenance, and mission logistics, further increase costs. Regulatory approvals, safety compliance, and training requirements also limit accessibility, particularly for smaller research institutions or commercial operators. These economic and technical barriers restrict widespread adoption, especially in developing regions. Until costs decrease and operational efficiency improves, market expansion is constrained despite growing interest in deep-sea exploration and marine research applications globally.
Manned submersible vehicles have substantial socioeconomic implications by enabling exploration of oceans for scientific, industrial, and recreational purposes. They facilitate marine resource discovery, contributing to energy and mineral industries, and enhance understanding of ocean ecosystems for environmental conservation. Scientific breakthroughs in deep-sea biology, geology, and climate studies support global knowledge and policy development. The market also creates high-skill employment opportunities in engineering, research, and operations. Expanding marine tourism and commercial expeditions generate revenue and economic growth.
Segmental Analysis:
The military and defense submersibles segment is expected to witness the highest growth over the forecast period due to rising investments in naval defense, underwater surveillance, and strategic maritime operations. Nations are increasingly deploying crewed submersibles for intelligence gathering, mine detection, special operations, and underwater threat assessment. Technological advancements in stealth, navigation, and life-support systems enhance operational efficiency and mission safety. Geopolitical tensions and the need to secure territorial waters have accelerated adoption by defense forces worldwide. Continuous R&D in autonomous integration, advanced sensors, and propulsion systems further positions military submersibles as a major growth driver in the global market.
The deep water submersibles segment, capable of operating between 2,000 and 6,000 meters, is projected to witness the highest growth due to increasing demand for exploration of mid- to ultra-deep ocean environments. These vehicles are essential for scientific research, resource mapping, and environmental monitoring in regions previously inaccessible. Rising investments in oil, gas, and mineral exploration, as well as marine biodiversity studies, drive adoption. Technological advancements in pressure-resistant hulls, energy-efficient propulsion, and advanced navigation systems enable safer, longer missions. Their versatility in industrial, research, and tourism applications positions deep water submersibles as a rapidly growing market segment globally.
The electric propulsion segment is expected to witness the highest growth over the forecast period due to its efficiency, low environmental impact, and suitability for long-duration underwater missions. Electric systems provide silent operation, critical for scientific, defense, and commercial applications, while reducing energy consumption compared to traditional diesel or hybrid systems. Advancements in battery technology, energy storage, and regenerative power systems have extended mission duration and operational depth. Increasing demand for sustainable and reliable propulsion systems in research, industrial, and tourism submersibles drives market adoption. Electric propulsion is becoming a preferred choice for modern manned submersible vehicles worldwide.
The oil, gas, and mining segment is expected to witness the highest growth over the forecast period due to expanding offshore resource exploration and extraction activities. Manned submersibles assist in seabed mapping, pipeline inspection, drilling support, and mineral resource surveys, reducing operational risks and improving efficiency. Rising global energy demand and technological innovations in deep-sea exploration accelerate adoption. Submersibles equipped with advanced imaging, robotic arms, and pressure-resistant systems enable safer, precise operations in challenging underwater environments. These capabilities make submersibles indispensable for industrial operations, positioning oil, gas, and mining companies as key drivers in the global market.
North America is expected to witness the highest growth over the forecast period due to advanced technological capabilities, strong defense investments, and growing scientific research initiatives. The U.S. and Canada have well-established marine research institutions, defense agencies, and private sector companies actively deploying manned submersibles for exploration, resource mapping, and strategic operations. For instance, in 2025, Lockheed Martin partnered with Submergence Group and Germanischer Lloyd to develop and classify the S301i and S302 dry manned submersibles. These advanced vehicles enhanced North America’s market by offering superior mission readiness and safety for Special Forces, driving innovation and adoption of next-generation underwater military technologies.
High adoption of cutting-edge propulsion, AI-assisted navigation, and safety systems accelerates market growth. Additionally, increasing investments in marine tourism, offshore oil and gas, and environmental monitoring further boost demand. North America’s robust infrastructure, R&D focus, and early adoption of advanced submersibles make it the fastest-growing regional market.
| Report Matrics | Details |
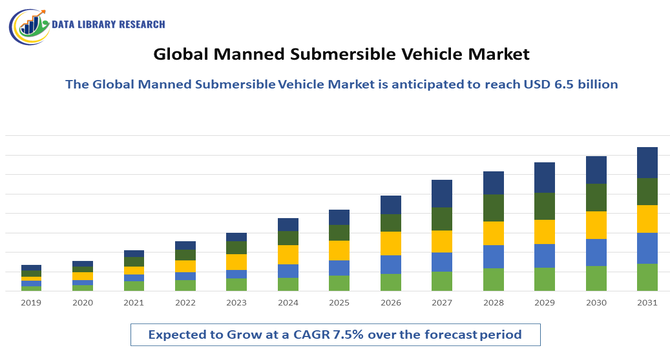
| Market Size Value | USD 2.76 billion |
| Growth Rate | CAGR of 7.5% |
| Forecast | 2026-2033 |
| Historical data | 2021-2024 |
| Base Year | 2025 |
| Report Coverage | Forecasted revenue, company rating, competitive environment, growth drivers, and trends |
| Segment Coverage | Type, Application, End-User, Geography |
| Regional Scope | North America, Europe, Asia Pacific, Middle East |
| Customized scope | Free customization of reports (With 3 months Analysis Support ) |
| To Learn More About This Report | Request a Free Sample Copy |
The manned submersible vehicle market is highly competitive, comprising specialized engineering firms, marine technology companies, and defense contractors. Leading players focus on innovation in hull design, propulsion, life-support systems, and deep-sea safety technologies. Collaborations with research institutions and government agencies drive R&D, while mergers and strategic partnerships enhance global reach. Barriers to entry are high due to technological complexity, regulatory requirements, and capital intensity. Market competition emphasizes differentiation through operational depth, endurance, safety features, and customization for scientific, industrial, or tourism applications. Companies delivering reliable, technologically advanced, and cost-effective submersibles gain competitive advantage in the expanding global market.
The major players for above market are:
Recent Development
Q1. What are the main growth-driving factors for this market?
Growth is primarily driven by expanding deep-sea exploration for oil, gas, and rare minerals. Increasing investments in marine tourism and scientific research for climate studies also propel demand. Furthermore, naval modernization programs worldwide are integrating advanced submersibles for search, rescue, and underwater surveillance to enhance national security and offshore capabilities.
Q2. What are the main restraining factors for this market?
The market faces high initial capital investment and substantial operational costs. Stringent safety regulations and the technical challenges of extreme pressure environments limit the number of certified manufacturers. Additionally, the rapid development of Unmanned Underwater Vehicles (UUVs) and ROVs offers a cheaper, lower-risk alternative for many deep-sea industrial tasks.
Q3. Which segment is expected to witness high growth?
The Deep Submergence Vehicles (DSV) segment is poised for high growth due to a surge in ultra-deep-sea exploration and high-end adventure tourism. As technology allows for deeper descents with better life-support systems, both government research bodies and private explorers are investing heavily in vessels capable of reaching trench depths.
Q4. Who are the top major players for this market?
Leading players include Triton Submarines, U-Boat Worx, and OceanGate (private sector), alongside defense-oriented firms like Lockheed Martin, General Dynamics Electric Boat, and Huntington Ingalls Industries. These companies dominate through innovations in acrylic hull technology, battery endurance, and specialized military applications for underwater infiltration and rescue missions.
Q5. Which country is the largest player?
The United States stands as the largest player in this market. Its dominance is supported by the world’s most advanced naval infrastructure, significant funding for oceanographic research via NOAA, and a thriving private sector for luxury submersibles. Robust technological ecosystems and high defense spending ensure its continued global leadership position.
Data Library Research are conducted by industry experts who offer insight on industry structure, market segmentations technology assessment and competitive landscape (CL), and penetration, as well as on emerging trends. Their analysis is based on primary interviews (~ 80%) and secondary research (~ 20%) as well as years of professional expertise in their respective industries. Adding to this, by analysing historical trends and current market positions, our analysts predict where the market will be headed for the next five years. Furthermore, the varying trends of segment & categories geographically presented are also studied and the estimated based on the primary & secondary research.
In this particular report from the supply side Data Library Research has conducted primary surveys (interviews) with the key level executives (VP, CEO’s, Marketing Director, Business Development Manager and SOFT) of the companies that active & prominent as well as the midsized organization
FIGURE 1: DLR RESEARH PROCESS
Extensive primary research was conducted to gain a deeper insight of the market and industry performance. The analysis is based on both primary and secondary research as well as years of professional expertise in the respective industries.
In addition to analysing current and historical trends, our analysts predict where the market is headed over the next five years.
It varies by segment for these categories geographically presented in the list of market tables. Speaking about this particular report we have conducted primary surveys (interviews) with the key level executives (VP, CEO’s, Marketing Director, Business Development Manager and many more) of the major players active in the market.
Secondary ResearchSecondary research was mainly used to collect and identify information useful for the extensive, technical, market-oriented, and Friend’s study of the Global Extra Neutral Alcohol. It was also used to obtain key information about major players, market classification and segmentation according to the industry trends, geographical markets, and developments related to the market and technology perspectives. For this study, analysts have gathered information from various credible sources, such as annual reports, sec filings, journals, white papers, SOFT presentations, and company web sites.
Market Size EstimationBoth, top-down and bottom-up approaches were used to estimate and validate the size of the Global market and to estimate the size of various other dependent submarkets in the overall Extra Neutral Alcohol. The key players in the market were identified through secondary research and their market contributions in the respective geographies were determined through primary and secondary research.
Forecast Model