Medical Gas Parts Cleaning Services Market Overview and Analysis
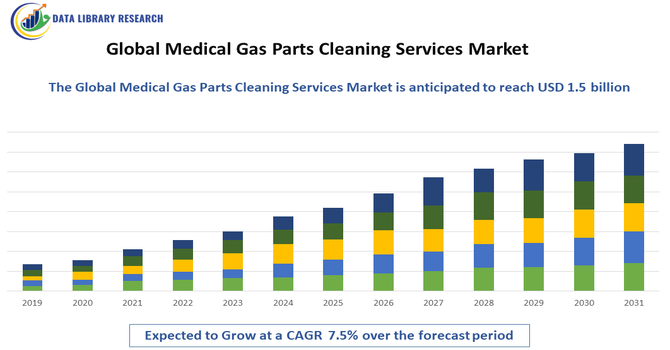
- The Global Medical Gas Parts Cleaning Services Market, estimated at around $1.5 billion, is poised for significant growth due to increasing regulatory requirements and strict hygiene standards. The market is projected to expand at a robust Compound Annual Growth Rate (CAGR) of approximately 7.5% over the forecast period.
Get Complete Analysis Of The Report - Download Updated Free Sample PDF
Growth in the Global Medical Gas Parts Cleaning Services Market is primarily driven by the rising demand for contamination-free, high-purity medical gas systems across hospitals, laboratories, and pharmaceutical facilities. As medical gas pipelines, valves, regulators, and fittings must meet strict cleanliness standards to prevent particulate, hydrocarbon, and microbial contamination, healthcare facilities increasingly rely on specialized cleaning service providers. Additionally, the rise in pharmaceutical manufacturing and cleanroom environments boosts market growth by emphasizing the importance of validated, compliant cleaning processes.
Medical Gas Parts Cleaning Services Market Latest Trends
The trends in the Global Medical Gas Parts Cleaning Services Market reflect a strong focus on technological innovation and quality compliance to meet the stringent demands of modern healthcare. Providers are increasingly adopting advanced and automated cleaning technologies, such as high-efficiency ultrasonic systems and robotics, which enhance precision, reduce turnaround times, and minimize human error in cleaning intricate gas system components. There is also a growing emphasis on data-driven process optimization and regulatory compliance, with integration of analytics and digital traceability to ensure adherence to cleanliness standards and bolster safety in medical gas delivery. Additionally, the shift toward eco-friendly cleaning agents and sustainable practices is gaining traction, aligning service offerings with broader environmental and health priorities in healthcare facilities.
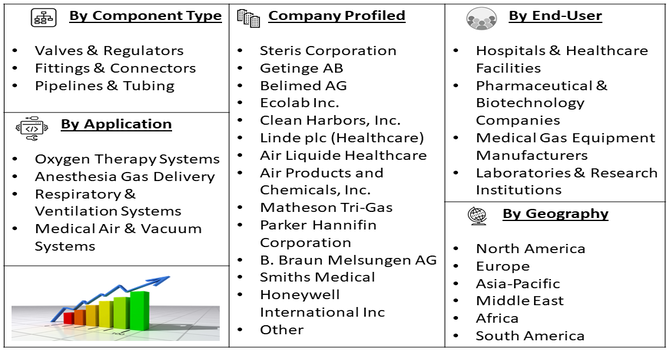
Segmentation: Global Medical Gas Parts Cleaning Services Market is segmented By Cleaning Method (Ultrasonic Cleaning, Hydrocarbon Cleaning, Aqueous Cleaning), Component Type (Valves & Regulators, Fittings & Connectors, Pipelines & Tubing), Service Type (Pre-Installation Cleaning, Maintenance & Re-Cleaning Services, Compliance & Certification Services), End-User (Hospitals & Healthcare Facilities, Pharmaceutical & Biotechnology Companies, Medical Gas Equipment Manufacturers, Laboratories & Research Institutions), Application (Oxygen Therapy Systems, Anesthesia Gas Delivery, Respiratory & Ventilation Systems, Medical Air & Vacuum Systems), and Geography (North America, Europe, Asia-Pacific, Middle East and Africa, and South America). The report provides the value (in USD million) for the above segments.
For Detailed Market Segmentation - Get a Free Sample PDF
Market Drivers:
- Strict Regulatory Standards and Growing Emphasis on Patient Safety
A major driver for this market is the growing enforcement of strict regulatory guidelines governing the cleanliness and safety of medical gas systems. Agencies such as NFPA, FDA, ISO, and CGA mandate that pipelines, valves, fittings, regulators, and other critical components must be free from hydrocarbons, particulates, microbial contaminants, and moisture to prevent blockages, system failures, or infections. For instance, In September 2021, the International Standards Organization (ISO) Technical Committee 194 updated ISO 10993-7, setting stricter limits for Ethylene Chlorohydrin (ECH) and residual ethylene oxide (EtO) in individually EtO-sterilized medical devices. These tightened regulatory standards are expected to constrain market growth in the near term by increasing compliance requirements for medical device cleaning and sterilization services. This push for compliance drives hospitals, laboratories, and pharmaceutical companies to partner with specialized cleaning providers capable of meeting rigorous cleanliness specifications and documentation requirements.
- Expansion of Healthcare Infrastructure and Increasing Use of Medical Gas Systems
Rapid growth in healthcare infrastructure—especially in emerging markets—is significantly increasing the installation, maintenance, and upgrading of medical gas pipeline systems. With the expanding use of oxygen therapy, anesthesia delivery, respiratory care equipment, and critical-care gas systems, there is a higher volume of components requiring specialized cleaning both before installation and during regular maintenance cycles. The rise in chronic respiratory diseases, aging populations, and demand for intensive care services also contribute to increased consumption of medical gases.
Market Restraints:
- High Cost of Specialized Cleaning Processes and Equipment
A key restraint for the market is the high cost associated with advanced medical gas parts cleaning processes, which require specialized equipment such as high-purity ultrasonic cleaners, vapor degreasers, oxygen-compatible cleaning systems, and precision contamination-testing instruments. These technologies demand continuous calibration, high-quality consumables, and skilled technicians trained in handling sensitive gas components. Additionally, compliance with stringent standards (NFPA, CGA, ISO, FDA) requires extensive documentation, validation, and quality management systems—all of which increase operational expenses. These high costs make it difficult for smaller healthcare facilities, laboratories, and regional service providers to adopt advanced cleaning capabilities, thereby limiting market penetration and slowing growth in price-sensitive regions.
Socioeconomic Impact on Medical Gas Parts Cleaning Services Market
The Global Medical Gas Parts Cleaning Services Market is experiencing robust growth, driven by increasing demand for safe and contamination-free medical gas systems in healthcare facilities. Proper cleaning and sterilization of components such as valves, regulators, and piping are critical to prevent infections and ensure compliance with stringent regulatory standards. Rising investments in hospitals, surgical centers, and home healthcare infrastructure are fueling the need for specialized cleaning services. Advanced technologies, including automated cleaning systems and eco-friendly solvents, enhance efficiency and reliability. Additionally, growing awareness of patient safety and quality assurance in medical gas delivery is boosting adoption, positioning the market for sustained expansion globally.
Segmental Analysis:
- Ultrasonic Cleaning segment is expected to witness the highest growth over the forecast period
Ultrasonic cleaning is one of the most widely used methods due to its ability to remove particulates, hydrocarbons, oils, and other contaminants from complex, hard-to-reach internal surfaces of medical gas components. Its high precision, consistency, and compatibility with oxygen-clean systems make it essential for valves, regulators, and tubing used in critical-care gas delivery. The increasing need for validated, high-purity cleaning processes continues to drive strong demand for ultrasonic cleaning technology.
- Valves & Regulators segment is expected to witness the highest growth over the forecast period
Valves and regulators form the core functional elements of medical gas systems, requiring strict cleanliness to ensure proper gas flow and prevent contamination-related malfunctions. These components are highly sensitive to particulates and hydrocarbons, making professional cleaning and certification essential before installation. As hospitals expand oxygen therapy and anesthesia gas infrastructure, the demand for cleaning services for valves and regulators grows significantly.
- Pre-Installation Cleaning segment is expected to witness the highest growth over the forecast period
Pre-installation cleaning services dominate due to the requirement for all gas system parts—especially for oxygen and anesthesia gas lines—to be thoroughly cleaned before being installed in healthcare settings. Ensuring that pipelines, connectors, and valves are contaminant-free helps prevent equipment failures and safety hazards. The increasing trend toward new hospital construction and gas system upgrades continues to drive this segment’s growth.
- Hospitals & Healthcare Facilities segment is expected to witness the highest growth over the forecast period
Hospitals remain the largest end-user segment as they rely heavily on medical gases for oxygen therapy, anesthesia delivery, ventilators, and emergency care. The need to maintain contamination-free gas delivery systems—coupled with strict compliance standards and risk of hospital-acquired infections—drives hospitals to seek professional cleaning services. Growth in ICU capacity, respiratory care units, and surgical facilities further accelerates demand from this segment.
- Oxygen Therapy Systems segment is expected to witness the highest growth over the forecast period
Oxygen therapy systems account for a significant share due to their extensive use in emergency care, intensive care units, chronic respiratory disease management, and post-operative recovery. Since oxygen is highly reactive, even trace hydrocarbons or particulates can pose severe safety risks. This makes certified cleaning of oxygen-compatible parts essential, driving strong demand in this application segment globally.
- North America segment is expected to witness the highest growth over the forecast period
North America leads the market due to its advanced healthcare infrastructure, strict regulatory standards, and high adoption of certified medical gas cleaning practices. The region’s strong presence of specialized service providers, increasing hospital upgrades, and widespread use of oxygen and anesthesia gas systems further support market dominance.
Continuous modernization of healthcare facilities ensures sustained growth in the region. For instance, in March 2024, the FDA inspected a U.S. medical gas manufacturer in Pennsylvania and identified major GMP violations, including lack of identity testing, incomplete release testing, improper equipment calibration, and inaccurate documentation. These deficiencies highlighted critical safety and compliance gaps, emphasizing the need for stringent cleaning and sterilization of medical gas parts. Consequently, demand for certified medical gas parts cleaning services in the U.S. increased to ensure regulatory compliance and patient safety.
Additionally, rising awareness of patient safety and stringent compliance requirements in North America are driving hospitals and clinics to adopt pre-installation and routine medical gas parts cleaning services. Technological advancements in cleaning equipment, coupled with skilled service providers, further reinforce the region’s leadership, ensuring consistent demand and steady expansion of the market.
| Report Matrics |
Details |
| Market Size Value |
USD 1.5 billion |
| Growth Rate |
CAGR of 7.5 % |
| Forecast |
2026-2033 |
| Historical data |
2021-2024 |
| Base Year |
2025 |
| Report Coverage |
Forecasted revenue, company rating, competitive environment, growth drivers, and trends |
| Segment Coverage |
Type, Application, End-User, Geography |
| Regional Scope |
North America, Europe, Asia Pacific, Middle East |
| Customized scope |
Free customization of reports (With 3 months of analysis support) |
| To Learn More About This Report |
Request a Free Sample Copy |
Medical Gas Parts Cleaning Services Market Competitive Landscape:
The competitive landscape of the Global Medical Gas Parts Cleaning Services market is dominated by a mix of specialized cleaning houses, medical gas equipment manufacturers, global gas suppliers, and large industrial cleaning/sterilization firms. Key competition factors include compliance with medical cleanliness standards (NFPA, CGA, ISO), validated oxygen-clean processes, traceability and documentation, geographic service coverage near hospital clusters, and value-added offerings such as contamination testing and on-site maintenance. Providers differentiate through certifications (ISO 13485, ISO 14001), automation and validated cleaning lines, partnerships with OEMs and installers, and the ability to service both new installations and ongoing preventative maintenance contracts.
Key Players:
- Steris Corporation
- Getinge AB
- Belimed AG
- Ecolab Inc.
- Clean Harbors, Inc.
- Linde plc (Healthcare)
- Air Liquide Healthcare
- Air Products and Chemicals, Inc.
- Matheson Tri-Gas
- Parker Hannifin Corporation
- B. Braun Melsungen AG
- Smiths Medical
- Honeywell International Inc.
- Swagelok Company
- Concoa (Consolidated Controls Company)
- Watts Water Technologies
- IMI Precision Engineering
- Burkert Fluid Control Systems
- MedGas Solutions Ltd.
- Cleanroom Services Group
Recent News
- In January 2024, KYZEN announced its participation in MD&M West 2024, scheduled at the Anaheim Convention Center, Anaheim, CA, from February 6–8, 2024. At Booth 3085, KYZEN’s team showcased its innovative, eco-friendly cleaning solutions, highlighting METALNOX M6093 and M6386, two high-performance products designed specifically for effective medical device cleaning.
- In October 2023, The FDA granted 510(k) clearance to the Bonhawa High Flow Oxygen Therapy system, approving its use for patients with respiratory insufficiency, as announced in a company press release. This clearance enables the device to be marketed in the U.S., offering an advanced solution for delivering high-flow oxygen therapy to support patient respiratory care.
Frequently Asked Questions (FAQ) :
Q1. What are the main growth-driving factors for this market?
The market is primarily driven by the rising global prevalence of chronic respiratory diseases and the rapidly expanding aging population, which necessitates greater use of medical oxygen. Additionally, stricter government safety regulations for medical equipment and post-pandemic efforts to upgrade hospital infrastructure worldwide further increase the demand for certified cleaning and maintenance services.
Q2. What are the main restraining factors for this market?
The main constraints include the high initial setup costs for hospitals to install and integrate advanced medical gas delivery infrastructure. Furthermore, strict regulatory compliance with complex national and international standards (like FDA and ISO) for gas purity and equipment sterilization requires constant investment, which can increase operational costs for service providers.
Q3. Which segment is expected to witness high growth?
The Pre-Installation Cleaning segment is expected to witness the highest growth over the forecast period due to increasing emphasis on contaminant-free medical gas systems. Ensuring components are properly cleaned before installation minimizes infection risks, enhances patient safety, and complies with stringent healthcare regulations, driving widespread adoption of these specialized cleaning services.
Q4. Who are the top major players for this market?
The market is led by major industrial gas companies that offer comprehensive supply and equipment services globally, including Linde Plc, Air Liquide, and Air Products & Chemicals. These companies dominate by managing the entire medical gas supply chain, including the specialized cleaning, testing, and maintenance of all associated components.
Q5. Which country is the largest player?
North America, particularly the United States, holds the largest market share due to its well-established, high-spending healthcare infrastructure and strong focus on technological advancement in medical devices. However, the Asia Pacific region, driven by countries like China and India, is expected to be the fastest-growing market due to rapid hospital modernization.
List of Figures
Figure 1: Global Medical Gas Parts Cleaning Services Market Revenue Breakdown (USD Billion, %) by Region, 2022 & 2029
Figure 2: Global Medical Gas Parts Cleaning Services Market Value Share (%), By Segment 1, 2022 & 2029
Figure 3: Global Medical Gas Parts Cleaning Services Market Forecast (USD Billion), by Sub-Segment 1, 2018-2029
Figure 4: Global Medical Gas Parts Cleaning Services Market Forecast (USD Billion), by Sub-Segment 2, 2018-2029
Figure 5: Global Medical Gas Parts Cleaning Services Market Value Share (%), By Segment 2, 2022 & 2029
Figure 6: Global Medical Gas Parts Cleaning Services Market Forecast (USD Billion), by Sub-Segment 1, 2018-2029
Figure 7: Global Medical Gas Parts Cleaning Services Market Forecast (USD Billion), by Sub-Segment 2, 2018-2029
Figure 8: Global Medical Gas Parts Cleaning Services Market Forecast (USD Billion), by Sub-Segment 3, 2018-2029
Figure 9: Global Medical Gas Parts Cleaning Services Market Forecast (USD Billion), by Others, 2018-2029
Figure 10: Global Medical Gas Parts Cleaning Services Market Value Share (%), By Segment 3, 2022 & 2029
Figure 11: Global Medical Gas Parts Cleaning Services Market Forecast (USD Billion), by Sub-Segment 1, 2018-2029
Figure 12: Global Medical Gas Parts Cleaning Services Market Forecast (USD Billion), by Sub-Segment 2, 2018-2029
Figure 13: Global Medical Gas Parts Cleaning Services Market Forecast (USD Billion), by Sub-Segment 3, 2018-2029
Figure 14: Global Medical Gas Parts Cleaning Services Market Forecast (USD Billion), by Others, 2018-2029
Figure 15: Global Medical Gas Parts Cleaning Services Market Value (USD Billion), by Region, 2022 & 2029
Figure 16: North America Medical Gas Parts Cleaning Services Market Value Share (%), By Segment 1, 2022 & 2029
Figure 17: North America Medical Gas Parts Cleaning Services Market Forecast (USD Billion), by Sub-Segment 1, 2018-2029
Figure 18: North America Medical Gas Parts Cleaning Services Market Forecast (USD Billion), by Sub-Segment 2, 2018-2029
Figure 19: North America Medical Gas Parts Cleaning Services Market Value Share (%), By Segment 2, 2022 & 2029
Figure 20: North America Medical Gas Parts Cleaning Services Market Forecast (USD Billion), by Sub-Segment 1, 2018-2029
Figure 21: North America Medical Gas Parts Cleaning Services Market Forecast (USD Billion), by Sub-Segment 2, 2018-2029
Figure 22: North America Medical Gas Parts Cleaning Services Market Forecast (USD Billion), by Sub-Segment 3, 2018-2029
Figure 23: North America Medical Gas Parts Cleaning Services Market Forecast (USD Billion), by Others, 2018-2029
Figure 24: North America Medical Gas Parts Cleaning Services Market Value Share (%), By Segment 3, 2022 & 2029
Figure 25: North America Medical Gas Parts Cleaning Services Market Forecast (USD Billion), by Sub-Segment 1, 2018-2029
Figure 26: North America Medical Gas Parts Cleaning Services Market Forecast (USD Billion), by Sub-Segment 2, 2018-2029
Figure 27: North America Medical Gas Parts Cleaning Services Market Forecast (USD Billion), by Sub-Segment 3, 2018-2029
Figure 28: North America Medical Gas Parts Cleaning Services Market Forecast (USD Billion), by Others, 2018-2029
Figure 29: North America Medical Gas Parts Cleaning Services Market Forecast (USD Billion), by U.S., 2018-2029
Figure 30: North America Medical Gas Parts Cleaning Services Market Forecast (USD Billion), by Canada, 2018-2029
Figure 31: Latin America Medical Gas Parts Cleaning Services Market Value Share (%), By Segment 1, 2022 & 2029
Figure 32: Latin America Medical Gas Parts Cleaning Services Market Forecast (USD Billion), by Sub-Segment 1, 2018-2029
Figure 33: Latin America Medical Gas Parts Cleaning Services Market Forecast (USD Billion), by Sub-Segment 2, 2018-2029
Figure 34: Latin America Medical Gas Parts Cleaning Services Market Value Share (%), By Segment 2, 2022 & 2029
Figure 35: Latin America Medical Gas Parts Cleaning Services Market Forecast (USD Billion), by Sub-Segment 1, 2018-2029
Figure 36: Latin America Medical Gas Parts Cleaning Services Market Forecast (USD Billion), by Sub-Segment 2, 2018-2029
Figure 37: Latin America Medical Gas Parts Cleaning Services Market Forecast (USD Billion), by Sub-Segment 3, 2018-2029
Figure 38: Latin America Medical Gas Parts Cleaning Services Market Forecast (USD Billion), by Others, 2018-2029
Figure 39: Latin America Medical Gas Parts Cleaning Services Market Value Share (%), By Segment 3, 2022 & 2029
Figure 40: Latin America Medical Gas Parts Cleaning Services Market Forecast (USD Billion), by Sub-Segment 1, 2018-2029
Figure 41: Latin America Medical Gas Parts Cleaning Services Market Forecast (USD Billion), by Sub-Segment 2, 2018-2029
Figure 42: Latin America Medical Gas Parts Cleaning Services Market Forecast (USD Billion), by Sub-Segment 3, 2018-2029
Figure 43: Latin America Medical Gas Parts Cleaning Services Market Forecast (USD Billion), by Others, 2018-2029
Figure 44: Latin America Medical Gas Parts Cleaning Services Market Forecast (USD Billion), by Brazil, 2018-2029
Figure 45: Latin America Medical Gas Parts Cleaning Services Market Forecast (USD Billion), by Mexico, 2018-2029
Figure 46: Latin America Medical Gas Parts Cleaning Services Market Forecast (USD Billion), by Rest of Latin America, 2018-2029
Figure 47: Europe Medical Gas Parts Cleaning Services Market Value Share (%), By Segment 1, 2022 & 2029
Figure 48: Europe Medical Gas Parts Cleaning Services Market Forecast (USD Billion), by Sub-Segment 1, 2018-2029
Figure 49: Europe Medical Gas Parts Cleaning Services Market Forecast (USD Billion), by Sub-Segment 2, 2018-2029
Figure 50: Europe Medical Gas Parts Cleaning Services Market Value Share (%), By Segment 2, 2022 & 2029
Figure 51: Europe Medical Gas Parts Cleaning Services Market Forecast (USD Billion), by Sub-Segment 1, 2018-2029
Figure 52: Europe Medical Gas Parts Cleaning Services Market Forecast (USD Billion), by Sub-Segment 2, 2018-2029
Figure 53: Europe Medical Gas Parts Cleaning Services Market Forecast (USD Billion), by Sub-Segment 3, 2018-2029
Figure 54: Europe Medical Gas Parts Cleaning Services Market Forecast (USD Billion), by Others, 2018-2029
Figure 55: Europe Medical Gas Parts Cleaning Services Market Value Share (%), By Segment 3, 2022 & 2029
Figure 56: Europe Medical Gas Parts Cleaning Services Market Forecast (USD Billion), by Sub-Segment 1, 2018-2029
Figure 57: Europe Medical Gas Parts Cleaning Services Market Forecast (USD Billion), by Sub-Segment 2, 2018-2029
Figure 58: Europe Medical Gas Parts Cleaning Services Market Forecast (USD Billion), by Sub-Segment 3, 2018-2029
Figure 59: Europe Medical Gas Parts Cleaning Services Market Forecast (USD Billion), by Others, 2018-2029
Figure 60: Europe Medical Gas Parts Cleaning Services Market Forecast (USD Billion), by U.K., 2018-2029
Figure 61: Europe Medical Gas Parts Cleaning Services Market Forecast (USD Billion), by Germany, 2018-2029
Figure 62: Europe Medical Gas Parts Cleaning Services Market Forecast (USD Billion), by France, 2018-2029
Figure 63: Europe Medical Gas Parts Cleaning Services Market Forecast (USD Billion), by Italy, 2018-2029
Figure 64: Europe Medical Gas Parts Cleaning Services Market Forecast (USD Billion), by Spain, 2018-2029
Figure 65: Europe Medical Gas Parts Cleaning Services Market Forecast (USD Billion), by Russia, 2018-2029
Figure 66: Europe Medical Gas Parts Cleaning Services Market Forecast (USD Billion), by Rest of Europe, 2018-2029
Figure 67: Asia Pacific Medical Gas Parts Cleaning Services Market Value Share (%), By Segment 1, 2022 & 2029
Figure 68: Asia Pacific Medical Gas Parts Cleaning Services Market Forecast (USD Billion), by Sub-Segment 1, 2018-2029
Figure 69: Asia Pacific Medical Gas Parts Cleaning Services Market Forecast (USD Billion), by Sub-Segment 2, 2018-2029
Figure 70: Asia Pacific Medical Gas Parts Cleaning Services Market Value Share (%), By Segment 2, 2022 & 2029
Figure 71: Asia Pacific Medical Gas Parts Cleaning Services Market Forecast (USD Billion), by Sub-Segment 1, 2018-2029
Figure 72: Asia Pacific Medical Gas Parts Cleaning Services Market Forecast (USD Billion), by Sub-Segment 2, 2018-2029
Figure 73: Asia Pacific Medical Gas Parts Cleaning Services Market Forecast (USD Billion), by Sub-Segment 3, 2018-2029
Figure 74: Asia Pacific Medical Gas Parts Cleaning Services Market Forecast (USD Billion), by Others, 2018-2029
Figure 75: Asia Pacific Medical Gas Parts Cleaning Services Market Value Share (%), By Segment 3, 2022 & 2029
Figure 76: Asia Pacific Medical Gas Parts Cleaning Services Market Forecast (USD Billion), by Sub-Segment 1, 2018-2029
Figure 77: Asia Pacific Medical Gas Parts Cleaning Services Market Forecast (USD Billion), by Sub-Segment 2, 2018-2029
Figure 78: Asia Pacific Medical Gas Parts Cleaning Services Market Forecast (USD Billion), by Sub-Segment 3, 2018-2029
Figure 79: Asia Pacific Medical Gas Parts Cleaning Services Market Forecast (USD Billion), by Others, 2018-2029
Figure 80: Asia Pacific Medical Gas Parts Cleaning Services Market Forecast (USD Billion), by China, 2018-2029
Figure 81: Asia Pacific Medical Gas Parts Cleaning Services Market Forecast (USD Billion), by India, 2018-2029
Figure 82: Asia Pacific Medical Gas Parts Cleaning Services Market Forecast (USD Billion), by Japan, 2018-2029
Figure 83: Asia Pacific Medical Gas Parts Cleaning Services Market Forecast (USD Billion), by Australia, 2018-2029
Figure 84: Asia Pacific Medical Gas Parts Cleaning Services Market Forecast (USD Billion), by Southeast Asia, 2018-2029
Figure 85: Asia Pacific Medical Gas Parts Cleaning Services Market Forecast (USD Billion), by Rest of Asia Pacific, 2018-2029
Figure 86: Middle East & Africa Medical Gas Parts Cleaning Services Market Value Share (%), By Segment 1, 2022 & 2029
Figure 87: Middle East & Africa Medical Gas Parts Cleaning Services Market Forecast (USD Billion), by Sub-Segment 1, 2018-2029
Figure 88: Middle East & Africa Medical Gas Parts Cleaning Services Market Forecast (USD Billion), by Sub-Segment 2, 2018-2029
Figure 89: Middle East & Africa Medical Gas Parts Cleaning Services Market Value Share (%), By Segment 2, 2022 & 2029
Figure 90: Middle East & Africa Medical Gas Parts Cleaning Services Market Forecast (USD Billion), by Sub-Segment 1, 2018-2029
Figure 91: Middle East & Africa Medical Gas Parts Cleaning Services Market Forecast (USD Billion), by Sub-Segment 2, 2018-2029
Figure 92: Middle East & Africa Medical Gas Parts Cleaning Services Market Forecast (USD Billion), by Sub-Segment 3, 2018-2029
Figure 93: Middle East & Africa Medical Gas Parts Cleaning Services Market Forecast (USD Billion), by Others, 2018-2029
Figure 94: Middle East & Africa Medical Gas Parts Cleaning Services Market Value Share (%), By Segment 3, 2022 & 2029
Figure 95: Middle East & Africa Medical Gas Parts Cleaning Services Market Forecast (USD Billion), by Sub-Segment 1, 2018-2029
Figure 96: Middle East & Africa Medical Gas Parts Cleaning Services Market Forecast (USD Billion), by Sub-Segment 2, 2018-2029
Figure 97: Middle East & Africa Medical Gas Parts Cleaning Services Market Forecast (USD Billion), by Sub-Segment 3, 2018-2029
Figure 98: Middle East & Africa Medical Gas Parts Cleaning Services Market Forecast (USD Billion), by Others, 2018-2029
Figure 99: Middle East & Africa Medical Gas Parts Cleaning Services Market Forecast (USD Billion), by GCC, 2018-2029
Figure 100: Middle East & Africa Medical Gas Parts Cleaning Services Market Forecast (USD Billion), by South Africa, 2018-2029
Figure 101: Middle East & Africa Medical Gas Parts Cleaning Services Market Forecast (USD Billion), by Rest of Middle East & Africa, 2018-2029
List of Tables
Table 1: Global Medical Gas Parts Cleaning Services Market Revenue (USD Billion) Forecast, by Segment 1, 2018-2029
Table 2: Global Medical Gas Parts Cleaning Services Market Revenue (USD Billion) Forecast, by Segment 2, 2018-2029
Table 3: Global Medical Gas Parts Cleaning Services Market Revenue (USD Billion) Forecast, by Segment 3, 2018-2029
Table 4: Global Medical Gas Parts Cleaning Services Market Revenue (USD Billion) Forecast, by Region, 2018-2029
Table 5: North America Medical Gas Parts Cleaning Services Market Revenue (USD Billion) Forecast, by Segment 1, 2018-2029
Table 6: North America Medical Gas Parts Cleaning Services Market Revenue (USD Billion) Forecast, by Segment 2, 2018-2029
Table 7: North America Medical Gas Parts Cleaning Services Market Revenue (USD Billion) Forecast, by Segment 3, 2018-2029
Table 8: North America Medical Gas Parts Cleaning Services Market Revenue (USD Billion) Forecast, by Country, 2018-2029
Table 9: Europe Medical Gas Parts Cleaning Services Market Revenue (USD Billion) Forecast, by Segment 1, 2018-2029
Table 10: Europe Medical Gas Parts Cleaning Services Market Revenue (USD Billion) Forecast, by Segment 2, 2018-2029
Table 11: Europe Medical Gas Parts Cleaning Services Market Revenue (USD Billion) Forecast, by Segment 3, 2018-2029
Table 12: Europe Medical Gas Parts Cleaning Services Market Revenue (USD Billion) Forecast, by Country, 2018-2029
Table 13: Latin America Medical Gas Parts Cleaning Services Market Revenue (USD Billion) Forecast, by Segment 1, 2018-2029
Table 14: Latin America Medical Gas Parts Cleaning Services Market Revenue (USD Billion) Forecast, by Segment 2, 2018-2029
Table 15: Latin America Medical Gas Parts Cleaning Services Market Revenue (USD Billion) Forecast, by Segment 3, 2018-2029
Table 16: Latin America Medical Gas Parts Cleaning Services Market Revenue (USD Billion) Forecast, by Country, 2018-2029
Table 17: Asia Pacific Medical Gas Parts Cleaning Services Market Revenue (USD Billion) Forecast, by Segment 1, 2018-2029
Table 18: Asia Pacific Medical Gas Parts Cleaning Services Market Revenue (USD Billion) Forecast, by Segment 2, 2018-2029
Table 19: Asia Pacific Medical Gas Parts Cleaning Services Market Revenue (USD Billion) Forecast, by Segment 3, 2018-2029
Table 20: Asia Pacific Medical Gas Parts Cleaning Services Market Revenue (USD Billion) Forecast, by Country, 2018-2029
Table 21: Middle East & Africa Medical Gas Parts Cleaning Services Market Revenue (USD Billion) Forecast, by Segment 1, 2018-2029
Table 22: Middle East & Africa Medical Gas Parts Cleaning Services Market Revenue (USD Billion) Forecast, by Segment 2, 2018-2029
Table 23: Middle East & Africa Medical Gas Parts Cleaning Services Market Revenue (USD Billion) Forecast, by Segment 3, 2018-2029
Table 24: Middle East & Africa Medical Gas Parts Cleaning Services Market Revenue (USD Billion) Forecast, by Country, 2018-2029
Research Process
Data Library Research are conducted by industry experts who offer insight on
industry structure, market segmentations technology assessment and competitive landscape (CL), and penetration, as well as on emerging trends. Their analysis is based on primary interviews (~ 80%) and secondary research (~ 20%) as well as years of professional expertise in their respective industries. Adding to this, by analysing historical trends and current market positions, our analysts predict where the market will be headed for the next five years. Furthermore, the varying trends of segment & categories geographically presented are also studied and the estimated based on the primary & secondary research.
In this particular report from the supply side Data Library Research has conducted primary surveys (interviews) with the key level executives (VP, CEO’s, Marketing Director, Business Development Manager
and SOFT) of the companies that active & prominent as well as the midsized organization
FIGURE 1: DLR RESEARH PROCESS
![research-methodology1]()
Primary Research
Extensive primary research was conducted to gain a deeper insight of the market and industry performance. The analysis is based on both primary and secondary research as well as years of professional expertise in the respective industries.
In addition to analysing current and historical trends, our analysts predict where the market is headed over the next five years.
It varies by segment for these categories geographically presented in the list of market tables. Speaking about this particular report we have conducted primary surveys (interviews) with the key level executives (VP, CEO’s, Marketing Director, Business Development Manager and many more) of the major players active in the market.
Secondary Research
Secondary research was mainly used to collect and identify information useful for the extensive, technical, market-oriented, and Friend’s study of the Global Extra Neutral Alcohol. It was also used to obtain key information about major players, market classification and segmentation according to the industry trends, geographical markets, and developments related to the market and technology perspectives. For this study, analysts have gathered information from various credible sources, such as annual reports, sec filings, journals, white papers, SOFT presentations, and company web sites.
Market Size Estimation
Both, top-down and bottom-up approaches were used to estimate and validate the size of the Global market and to estimate the size of various other dependent submarkets in the overall Extra Neutral Alcohol. The key players in the market were identified through secondary research and their market contributions in the respective geographies were determined through primary and secondary research.
Forecast Model
![research-methodology2]()