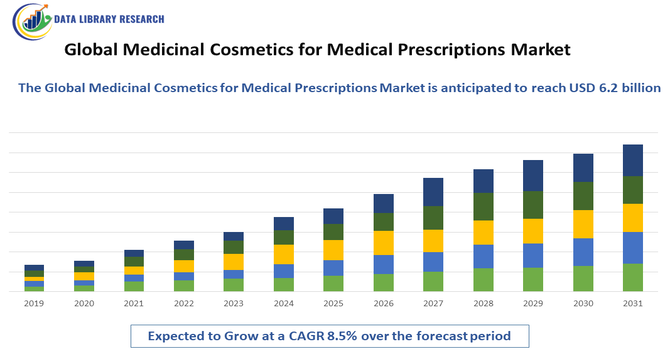
Medicinal Cosmetics for Medical Prescriptions Market Overview and Analysis:
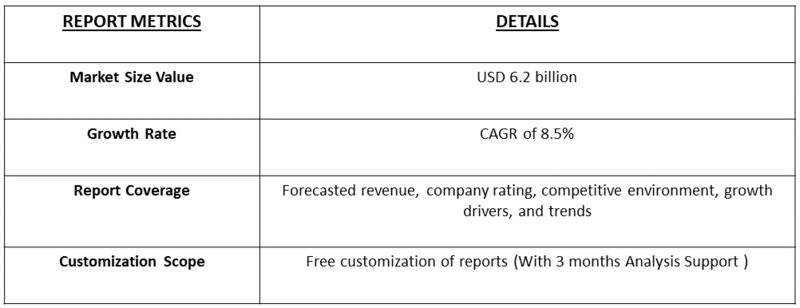
- The Market size was valued at USD 3.8 billion in 2025 and is projected to reach USD 6.2 billion by 2032, growing with a CAGR of from 2025-2032.
Get Complete Analysis Of The Report - Download Updated Free Sample PDF
The Global Medicinal Cosmetics for Medical Prescriptions Market refers to the industry focused on pharmaceutical-grade cosmetic products prescribed by healthcare professionals to treat skin conditions or enhance skin health. These products combine therapeutic benefits with cosmetic appeal, addressing issues like acne, pigmentation, and aging, driven by increasing awareness, medical guidance, and demand for targeted skincare solutions.
The growth of the global medicinal cosmetics for medical prescriptions market is driven by rising consumer awareness of skin health and the demand for products that combine therapeutic and aesthetic benefits. Increasing prevalence of skin disorders such as acne, hyperpigmentation, and aging-related concerns has boosted reliance on physician-prescribed formulations.
Medicinal Cosmetics for Medical Prescriptions Market Latest Trends
The global medicinal cosmetics market is increasingly shifting toward personalized, dermatology-driven skincare, with formulations tailored to individual skin types, genetic profiles, and lifestyle needs, often prescribed by physicians rather than sold over the counter. Advances in biotechnology, including nano-encapsulation, peptide-based actives, and stem-cell or growth-factor-derived ingredients, have improved the efficacy and safety of medicinal cosmetics.
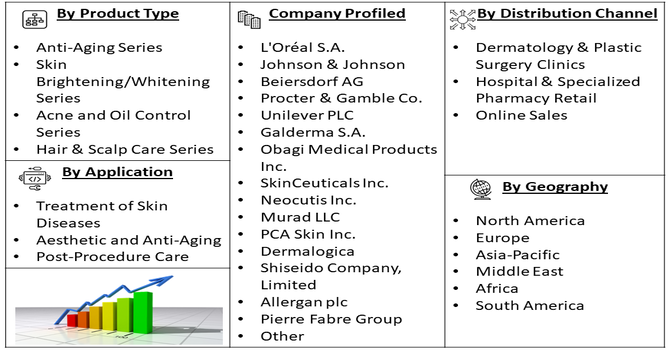
Segmentation: The Medicinal Cosmetics Market is segmented by Product Type (Anti-Aging Series, Skin Brightening/Whitening Series, Acne and Oil Control Series, and Hair & Scalp Care Series), Application (Treatment of Skin Diseases, Aesthetic and Anti-Aging, and Post-Procedure Care), Distribution Channel (Dermatology & Plastic Surgery Clinics, Hospital & Specialized Pharmacy Retail, and Online Sales), and Geography (North America, Europe, Asia-Pacific, Middle East and Africa, and South America). The report provides the value (in USD million) for the above segments.
For Detailed Market Segmentation - Get a Free Sample PDF
Market Drivers:
- Rising Skin Health Awareness
The market is driven by growing consumer awareness of skin health and the preference for clinically validated solutions over conventional cosmetics. Increasing incidence of skin disorders such as acne, hyperpigmentation, and aging-related concerns has prompted consumers to seek products prescribed by healthcare professionals. For instance, in 2025, MDPI, reported that rising global acne prevalence, estimated at 9.4% overall and more recent studies suggesting 20.5% of the global population, significantly influenced the medicinal cosmetics and medical prescriptions market. Particularly high rates of over 50% among adolescents and young adults drove demand for prescription-grade skincare. Increasing acne, hyperpigmentation, and aging-related concerns prompted dermatologists to recommend targeted medicinal cosmetics, accelerating adoption and market growth worldwide.
The combination of therapeutic efficacy and cosmetic benefits ensures long-term skin health, making medicinal cosmetics highly appealing. Rising social media influence, dermatology consultations, and educational campaigns on preventive skincare have further fueled demand, encouraging physicians and dermatologists to recommend medicinal cosmetics to a broader patient base worldwide.
- Advancements in Dermatological Research and Innovation
Technological and scientific advancements in dermatology have significantly boosted the medicinal cosmetics market. Innovations such as peptide-based formulations, nano-encapsulation, stem-cell derivatives, and growth-factor-enriched products enhance both safety and effectiveness. For instance, in October 2025, Niner Pharma significantly impacted the global medicinal cosmetics and medical prescriptions market by expanding its R&D portfolio to develop 125 new peptide-based molecules for wellness and cosmetic applications. This innovation highlighted the potential of peptide-driven formulations to deliver targeted, clinically validated skincare solutions, accelerating adoption of advanced prescription-grade medicinal cosmetics and reinforcing the role of biotechnology in the industry.
Prescription-grade formulations provide targeted solutions for specific skin conditions, improving treatment outcomes and patient satisfaction. Integration with tele-dermatology and digital health platforms enables personalized recommendations and better adherence to treatment plans. Continuous R&D investment by pharmaceutical and cosmetic companies ensures a steady pipeline of novel products, driving adoption among healthcare professionals and patients seeking effective, scientifically-backed skincare solutions globally.
Market Restraints:
- High Cost and Limited Accessibility
A major restraint for the market is the high cost of medicinal cosmetics compared to conventional skincare products. Prescription-grade formulations often require physician consultation, adding to the overall expense and making them less accessible in developing regions or among price-sensitive consumers. Additionally, complex regulatory approvals and compliance with strict clinical standards can delay product launches and limit availability. High production costs for innovative ingredients and technologies, coupled with limited distribution channels, restrict widespread adoption. These financial and logistical barriers slow market penetration, particularly in emerging economies, and may discourage potential users from choosing medicinal cosmetics over more affordable over-the-counter alternatives.
Socioeconomic Impact on Medicinal Cosmetics for Medical Prescriptions Market
The growth of the medicinal cosmetics market positively impacts public health by providing more effective treatments for skin conditions such as acne, eczema, pigmentation, and aging-related concerns. Rising pollution, stress, and lifestyle changes have increased the prevalence of skin disorders, driving demand for physician-prescribed, clinically tested products. Additionally, increasing disposable incomes and heightened consumer awareness about long-term skin health have expanded market penetration across both developed and emerging economies. This shift toward preventive and therapeutic skincare not only improves individual wellbeing but also supports the healthcare system by reducing reliance on over-the-counter remedies and enhancing patient outcomes through medically supervised cosmetic interventions.
Segmental Analysis:
- Anti-Aging Series segment is expected to witness highest growth over the forecast period
The anti-aging series segment is expected to witness the highest growth due to increasing consumer demand for products that address wrinkles, fine lines, pigmentation, and skin elasticity. Rising awareness of aging-related skin concerns, coupled with higher disposable incomes and the desire for youthful appearance, drives adoption. Physicians and dermatologists increasingly recommend clinically validated anti-aging formulations containing peptides, retinoids, growth factors, and antioxidants, ensuring both efficacy and safety. Technological advancements in ingredient delivery, such as nano-encapsulation and controlled-release systems, further enhance performance, encouraging long-term usage. The segment’s focus on preventive and restorative skincare continues to fuel its rapid growth globally.
- Skin Treatment Diseases segment is expected to witness highest growth over the forecast period
The skin treatment diseases segment is projected to grow significantly due to the rising prevalence of dermatological conditions such as acne, eczema, psoriasis, hyperpigmentation, and rosacea. Prescription-grade medicinal cosmetics provide targeted therapeutic benefits alongside cosmetic improvement, making them highly sought after by patients and recommended by dermatologists. Increasing pollution, stress, lifestyle changes, and aging populations contribute to higher skin disorder incidence, boosting demand. The integration of innovative bioactive ingredients and personalized treatment plans enhances treatment efficacy. This segment’s growth is further supported by digital health consultations and tele-dermatology, enabling patients worldwide to access clinically backed skincare solutions efficiently.
- Dermatology & Plastic Surgery Clinics segment is expected to witness highest growth over the forecast period
The dermatology and plastic surgery clinics segment is expected to witness the highest growth as these facilities increasingly integrate medicinal cosmetics into patient care. Physicians prescribe targeted formulations for post-procedure care, skin rejuvenation, and chronic dermatological conditions. The rise in cosmetic procedures, aesthetic treatments, and preventive skincare regimens drives the adoption of clinically validated, prescription-based products. Clinics leverage these products to improve treatment outcomes and patient satisfaction, enhancing reputation and service offerings. High patient awareness and demand for safe, effective, and personalized skincare solutions make this segment a key contributor to the overall market growth globally.
- North America Region segment is expected to witness highest growth over the forecast period
North America is expected to witness the highest growth due to strong healthcare infrastructure, advanced dermatology practices, and high consumer awareness of skincare and aesthetic treatments. The region has widespread adoption of prescription-grade medicinal cosmetics for anti-aging, pigmentation, and chronic skin conditions. For instance, in January 2025, Allergan Aesthetics, an AbbVie company, strengthened the U.S. medicinal cosmetics for medical prescriptions market by launching its AA Signature Program at IMCAS World Congress 2024. Through live demonstrations, expert presentations, and interactive sessions, the initiative enhanced physician engagement, showcased innovative aesthetic treatments, and reinforced Allergan’s leadership, driving adoption of advanced prescription-grade cosmetic solutions across the U.S. market.
The Trading Economics, reported that rising disposable personal income in the U.S., which reached 23,033.50 USD billion in August 2025, positively impacted the medicinal cosmetics for medical prescriptions market. Higher consumer spending power enabled increased investment in prescription-grade skincare and aesthetic treatments, driving demand for premium, clinically validated products. This trend accelerated adoption of advanced medicinal cosmetics among health- and appearance-conscious U.S. consumers.
Tele-dermatology, digital health platforms, and integration of innovative active ingredients such as peptides and growth factors further accelerate adoption. Regulatory frameworks supporting safe and clinically validated products, combined with rising demand for personalized skincare solutions, reinforce North America’s position as the leading market globally.
To Learn More About This Report - Request a Free Sample Copy
Medicinal Cosmetics for Medical Prescriptions Market Competitive Landscape
The medicinal cosmetics market is highly competitive, featuring a mix of established pharmaceutical and dermatology-cosmetic giants alongside innovative biotech and niche players. Large companies leverage their research and development capabilities, clinical validation, and global distribution networks to maintain market leadership. Smaller or newer firms compete through innovation, offering novel active ingredients, customized formulations, and sustainable, clean-beauty positioning. Market differentiation relies heavily on product efficacy, physician endorsement, and the ability to meet evolving consumer demands for personalization, safety, and clinical results.
The major players for above market are:
- L'Oréal S.A.
- Johnson & Johnson
- Beiersdorf AG
- Procter & Gamble Co.
- Unilever PLC
- Galderma S.A.
- Obagi Medical Products Inc.
- SkinCeuticals Inc.
- Neocutis Inc.
- Murad LLC
- PCA Skin Inc.
- Dermalogica
- Shiseido Company, Limited
- Allergan plc
- Pierre Fabre Group
- AmorePacific Corporation
- Coty Inc.
- Avon Products, Inc.
- Revlon, Inc.
- Kao Corporation
Recent Development
- In September 2025, Thermage, developed by Bausch Health’s Solta Medical, significantly influenced the global medicinal cosmetics for medical prescriptions market by achieving 5 million treatments. Its non-surgical skin-tightening and smoothing technology showcased the growing demand for clinically backed, minimally invasive aesthetic solutions. This milestone reinforced the integration of advanced therapeutic technologies within prescription-driven skincare and cosmetic treatments worldwide.
- In July 2025, Cosmus Skincare made a notable impact on the global medicinal cosmetics for medical prescriptions market by introducing innovative, physiology-driven formulations that combined traditional ingredients with modern science. Its targeted solutions for diverse skin concerns demonstrated the potential of research-based, clinically informed skincare, inspiring broader adoption of prescription-grade, results-oriented products in both emerging and established markets worldwide.
Frequently Asked Questions (FAQ) :
Q1. What are the main growth-driving factors for this market?
The key growth drivers are the rising prevalence of chronic skin conditions like acne, eczema, and aging-related issues, which require treatment beyond basic cosmetic care. Increased consumer awareness about preventive and functional skincare is also driving demand for clinically tested, physician-prescribed products with high concentrations of active ingredients.
Q2. What are the main restraining factors for this market?
The high cost of research and development, coupled with stringent regulatory frameworks for product safety and medical claims, significantly restrains the market. Additionally, the high price points for premium, prescribed cosmeceuticals can limit adoption among the general population compared to cheaper, over-the-counter alternatives.
Q3. Which segment is expected to witness high growth?
The Anti-Aging and Skin-Repairing Series segment is expected to witness particularly high growth. This is driven by the global aging population and a strong consumer focus on appearance, leading to massive demand for prescription-grade products that offer visible, clinical results in treating wrinkles, fine lines, and sun damage.
Q4. Who are the top major players for this market?
Major players include large pharmaceutical and global cosmetics giants who invest heavily in R&D to bridge the gap between medicine and beauty. Companies like L'Oréal S.A., Johnson & Johnson, Shiseido, and Procter & Gamble are key competitors, often operating specialized divisions focused on developing and marketing physician-endorsed formulations.
Q5. Which country is the largest player?
The United States (North America) generally remains the single largest market in terms of value, driven by high consumer spending, a sophisticated healthcare system, and a culture that rapidly adopts new, expensive specialty treatments. However, the Asia Pacific region is the fastest growing, due to strong demand from countries like China and South Korea.
List of Figures
Figure 1: Global Medicinal Cosmetics for Medical Prescriptions Market Revenue Breakdown (USD Billion, %) by Region, 2022 & 2029
Figure 2: Global Medicinal Cosmetics for Medical Prescriptions Market Value Share (%), By Segment 1, 2022 & 2029
Figure 3: Global Medicinal Cosmetics for Medical Prescriptions Market Forecast (USD Billion), by Sub-Segment 1, 2018-2029
Figure 4: Global Medicinal Cosmetics for Medical Prescriptions Market Forecast (USD Billion), by Sub-Segment 2, 2018-2029
Figure 5: Global Medicinal Cosmetics for Medical Prescriptions Market Value Share (%), By Segment 2, 2022 & 2029
Figure 6: Global Medicinal Cosmetics for Medical Prescriptions Market Forecast (USD Billion), by Sub-Segment 1, 2018-2029
Figure 7: Global Medicinal Cosmetics for Medical Prescriptions Market Forecast (USD Billion), by Sub-Segment 2, 2018-2029
Figure 8: Global Medicinal Cosmetics for Medical Prescriptions Market Forecast (USD Billion), by Sub-Segment 3, 2018-2029
Figure 9: Global Medicinal Cosmetics for Medical Prescriptions Market Forecast (USD Billion), by Others, 2018-2029
Figure 10: Global Medicinal Cosmetics for Medical Prescriptions Market Value Share (%), By Segment 3, 2022 & 2029
Figure 11: Global Medicinal Cosmetics for Medical Prescriptions Market Forecast (USD Billion), by Sub-Segment 1, 2018-2029
Figure 12: Global Medicinal Cosmetics for Medical Prescriptions Market Forecast (USD Billion), by Sub-Segment 2, 2018-2029
Figure 13: Global Medicinal Cosmetics for Medical Prescriptions Market Forecast (USD Billion), by Sub-Segment 3, 2018-2029
Figure 14: Global Medicinal Cosmetics for Medical Prescriptions Market Forecast (USD Billion), by Others, 2018-2029
Figure 15: Global Medicinal Cosmetics for Medical Prescriptions Market Value (USD Billion), by Region, 2022 & 2029
Figure 16: North America Medicinal Cosmetics for Medical Prescriptions Market Value Share (%), By Segment 1, 2022 & 2029
Figure 17: North America Medicinal Cosmetics for Medical Prescriptions Market Forecast (USD Billion), by Sub-Segment 1, 2018-2029
Figure 18: North America Medicinal Cosmetics for Medical Prescriptions Market Forecast (USD Billion), by Sub-Segment 2, 2018-2029
Figure 19: North America Medicinal Cosmetics for Medical Prescriptions Market Value Share (%), By Segment 2, 2022 & 2029
Figure 20: North America Medicinal Cosmetics for Medical Prescriptions Market Forecast (USD Billion), by Sub-Segment 1, 2018-2029
Figure 21: North America Medicinal Cosmetics for Medical Prescriptions Market Forecast (USD Billion), by Sub-Segment 2, 2018-2029
Figure 22: North America Medicinal Cosmetics for Medical Prescriptions Market Forecast (USD Billion), by Sub-Segment 3, 2018-2029
Figure 23: North America Medicinal Cosmetics for Medical Prescriptions Market Forecast (USD Billion), by Others, 2018-2029
Figure 24: North America Medicinal Cosmetics for Medical Prescriptions Market Value Share (%), By Segment 3, 2022 & 2029
Figure 25: North America Medicinal Cosmetics for Medical Prescriptions Market Forecast (USD Billion), by Sub-Segment 1, 2018-2029
Figure 26: North America Medicinal Cosmetics for Medical Prescriptions Market Forecast (USD Billion), by Sub-Segment 2, 2018-2029
Figure 27: North America Medicinal Cosmetics for Medical Prescriptions Market Forecast (USD Billion), by Sub-Segment 3, 2018-2029
Figure 28: North America Medicinal Cosmetics for Medical Prescriptions Market Forecast (USD Billion), by Others, 2018-2029
Figure 29: North America Medicinal Cosmetics for Medical Prescriptions Market Forecast (USD Billion), by U.S., 2018-2029
Figure 30: North America Medicinal Cosmetics for Medical Prescriptions Market Forecast (USD Billion), by Canada, 2018-2029
Figure 31: Latin America Medicinal Cosmetics for Medical Prescriptions Market Value Share (%), By Segment 1, 2022 & 2029
Figure 32: Latin America Medicinal Cosmetics for Medical Prescriptions Market Forecast (USD Billion), by Sub-Segment 1, 2018-2029
Figure 33: Latin America Medicinal Cosmetics for Medical Prescriptions Market Forecast (USD Billion), by Sub-Segment 2, 2018-2029
Figure 34: Latin America Medicinal Cosmetics for Medical Prescriptions Market Value Share (%), By Segment 2, 2022 & 2029
Figure 35: Latin America Medicinal Cosmetics for Medical Prescriptions Market Forecast (USD Billion), by Sub-Segment 1, 2018-2029
Figure 36: Latin America Medicinal Cosmetics for Medical Prescriptions Market Forecast (USD Billion), by Sub-Segment 2, 2018-2029
Figure 37: Latin America Medicinal Cosmetics for Medical Prescriptions Market Forecast (USD Billion), by Sub-Segment 3, 2018-2029
Figure 38: Latin America Medicinal Cosmetics for Medical Prescriptions Market Forecast (USD Billion), by Others, 2018-2029
Figure 39: Latin America Medicinal Cosmetics for Medical Prescriptions Market Value Share (%), By Segment 3, 2022 & 2029
Figure 40: Latin America Medicinal Cosmetics for Medical Prescriptions Market Forecast (USD Billion), by Sub-Segment 1, 2018-2029
Figure 41: Latin America Medicinal Cosmetics for Medical Prescriptions Market Forecast (USD Billion), by Sub-Segment 2, 2018-2029
Figure 42: Latin America Medicinal Cosmetics for Medical Prescriptions Market Forecast (USD Billion), by Sub-Segment 3, 2018-2029
Figure 43: Latin America Medicinal Cosmetics for Medical Prescriptions Market Forecast (USD Billion), by Others, 2018-2029
Figure 44: Latin America Medicinal Cosmetics for Medical Prescriptions Market Forecast (USD Billion), by Brazil, 2018-2029
Figure 45: Latin America Medicinal Cosmetics for Medical Prescriptions Market Forecast (USD Billion), by Mexico, 2018-2029
Figure 46: Latin America Medicinal Cosmetics for Medical Prescriptions Market Forecast (USD Billion), by Rest of Latin America, 2018-2029
Figure 47: Europe Medicinal Cosmetics for Medical Prescriptions Market Value Share (%), By Segment 1, 2022 & 2029
Figure 48: Europe Medicinal Cosmetics for Medical Prescriptions Market Forecast (USD Billion), by Sub-Segment 1, 2018-2029
Figure 49: Europe Medicinal Cosmetics for Medical Prescriptions Market Forecast (USD Billion), by Sub-Segment 2, 2018-2029
Figure 50: Europe Medicinal Cosmetics for Medical Prescriptions Market Value Share (%), By Segment 2, 2022 & 2029
Figure 51: Europe Medicinal Cosmetics for Medical Prescriptions Market Forecast (USD Billion), by Sub-Segment 1, 2018-2029
Figure 52: Europe Medicinal Cosmetics for Medical Prescriptions Market Forecast (USD Billion), by Sub-Segment 2, 2018-2029
Figure 53: Europe Medicinal Cosmetics for Medical Prescriptions Market Forecast (USD Billion), by Sub-Segment 3, 2018-2029
Figure 54: Europe Medicinal Cosmetics for Medical Prescriptions Market Forecast (USD Billion), by Others, 2018-2029
Figure 55: Europe Medicinal Cosmetics for Medical Prescriptions Market Value Share (%), By Segment 3, 2022 & 2029
Figure 56: Europe Medicinal Cosmetics for Medical Prescriptions Market Forecast (USD Billion), by Sub-Segment 1, 2018-2029
Figure 57: Europe Medicinal Cosmetics for Medical Prescriptions Market Forecast (USD Billion), by Sub-Segment 2, 2018-2029
Figure 58: Europe Medicinal Cosmetics for Medical Prescriptions Market Forecast (USD Billion), by Sub-Segment 3, 2018-2029
Figure 59: Europe Medicinal Cosmetics for Medical Prescriptions Market Forecast (USD Billion), by Others, 2018-2029
Figure 60: Europe Medicinal Cosmetics for Medical Prescriptions Market Forecast (USD Billion), by U.K., 2018-2029
Figure 61: Europe Medicinal Cosmetics for Medical Prescriptions Market Forecast (USD Billion), by Germany, 2018-2029
Figure 62: Europe Medicinal Cosmetics for Medical Prescriptions Market Forecast (USD Billion), by France, 2018-2029
Figure 63: Europe Medicinal Cosmetics for Medical Prescriptions Market Forecast (USD Billion), by Italy, 2018-2029
Figure 64: Europe Medicinal Cosmetics for Medical Prescriptions Market Forecast (USD Billion), by Spain, 2018-2029
Figure 65: Europe Medicinal Cosmetics for Medical Prescriptions Market Forecast (USD Billion), by Russia, 2018-2029
Figure 66: Europe Medicinal Cosmetics for Medical Prescriptions Market Forecast (USD Billion), by Rest of Europe, 2018-2029
Figure 67: Asia Pacific Medicinal Cosmetics for Medical Prescriptions Market Value Share (%), By Segment 1, 2022 & 2029
Figure 68: Asia Pacific Medicinal Cosmetics for Medical Prescriptions Market Forecast (USD Billion), by Sub-Segment 1, 2018-2029
Figure 69: Asia Pacific Medicinal Cosmetics for Medical Prescriptions Market Forecast (USD Billion), by Sub-Segment 2, 2018-2029
Figure 70: Asia Pacific Medicinal Cosmetics for Medical Prescriptions Market Value Share (%), By Segment 2, 2022 & 2029
Figure 71: Asia Pacific Medicinal Cosmetics for Medical Prescriptions Market Forecast (USD Billion), by Sub-Segment 1, 2018-2029
Figure 72: Asia Pacific Medicinal Cosmetics for Medical Prescriptions Market Forecast (USD Billion), by Sub-Segment 2, 2018-2029
Figure 73: Asia Pacific Medicinal Cosmetics for Medical Prescriptions Market Forecast (USD Billion), by Sub-Segment 3, 2018-2029
Figure 74: Asia Pacific Medicinal Cosmetics for Medical Prescriptions Market Forecast (USD Billion), by Others, 2018-2029
Figure 75: Asia Pacific Medicinal Cosmetics for Medical Prescriptions Market Value Share (%), By Segment 3, 2022 & 2029
Figure 76: Asia Pacific Medicinal Cosmetics for Medical Prescriptions Market Forecast (USD Billion), by Sub-Segment 1, 2018-2029
Figure 77: Asia Pacific Medicinal Cosmetics for Medical Prescriptions Market Forecast (USD Billion), by Sub-Segment 2, 2018-2029
Figure 78: Asia Pacific Medicinal Cosmetics for Medical Prescriptions Market Forecast (USD Billion), by Sub-Segment 3, 2018-2029
Figure 79: Asia Pacific Medicinal Cosmetics for Medical Prescriptions Market Forecast (USD Billion), by Others, 2018-2029
Figure 80: Asia Pacific Medicinal Cosmetics for Medical Prescriptions Market Forecast (USD Billion), by China, 2018-2029
Figure 81: Asia Pacific Medicinal Cosmetics for Medical Prescriptions Market Forecast (USD Billion), by India, 2018-2029
Figure 82: Asia Pacific Medicinal Cosmetics for Medical Prescriptions Market Forecast (USD Billion), by Japan, 2018-2029
Figure 83: Asia Pacific Medicinal Cosmetics for Medical Prescriptions Market Forecast (USD Billion), by Australia, 2018-2029
Figure 84: Asia Pacific Medicinal Cosmetics for Medical Prescriptions Market Forecast (USD Billion), by Southeast Asia, 2018-2029
Figure 85: Asia Pacific Medicinal Cosmetics for Medical Prescriptions Market Forecast (USD Billion), by Rest of Asia Pacific, 2018-2029
Figure 86: Middle East & Africa Medicinal Cosmetics for Medical Prescriptions Market Value Share (%), By Segment 1, 2022 & 2029
Figure 87: Middle East & Africa Medicinal Cosmetics for Medical Prescriptions Market Forecast (USD Billion), by Sub-Segment 1, 2018-2029
Figure 88: Middle East & Africa Medicinal Cosmetics for Medical Prescriptions Market Forecast (USD Billion), by Sub-Segment 2, 2018-2029
Figure 89: Middle East & Africa Medicinal Cosmetics for Medical Prescriptions Market Value Share (%), By Segment 2, 2022 & 2029
Figure 90: Middle East & Africa Medicinal Cosmetics for Medical Prescriptions Market Forecast (USD Billion), by Sub-Segment 1, 2018-2029
Figure 91: Middle East & Africa Medicinal Cosmetics for Medical Prescriptions Market Forecast (USD Billion), by Sub-Segment 2, 2018-2029
Figure 92: Middle East & Africa Medicinal Cosmetics for Medical Prescriptions Market Forecast (USD Billion), by Sub-Segment 3, 2018-2029
Figure 93: Middle East & Africa Medicinal Cosmetics for Medical Prescriptions Market Forecast (USD Billion), by Others, 2018-2029
Figure 94: Middle East & Africa Medicinal Cosmetics for Medical Prescriptions Market Value Share (%), By Segment 3, 2022 & 2029
Figure 95: Middle East & Africa Medicinal Cosmetics for Medical Prescriptions Market Forecast (USD Billion), by Sub-Segment 1, 2018-2029
Figure 96: Middle East & Africa Medicinal Cosmetics for Medical Prescriptions Market Forecast (USD Billion), by Sub-Segment 2, 2018-2029
Figure 97: Middle East & Africa Medicinal Cosmetics for Medical Prescriptions Market Forecast (USD Billion), by Sub-Segment 3, 2018-2029
Figure 98: Middle East & Africa Medicinal Cosmetics for Medical Prescriptions Market Forecast (USD Billion), by Others, 2018-2029
Figure 99: Middle East & Africa Medicinal Cosmetics for Medical Prescriptions Market Forecast (USD Billion), by GCC, 2018-2029
Figure 100: Middle East & Africa Medicinal Cosmetics for Medical Prescriptions Market Forecast (USD Billion), by South Africa, 2018-2029
Figure 101: Middle East & Africa Medicinal Cosmetics for Medical Prescriptions Market Forecast (USD Billion), by Rest of Middle East & Africa, 2018-2029
List of Tables
Table 1: Global Medicinal Cosmetics for Medical Prescriptions Market Revenue (USD Billion) Forecast, by Segment 1, 2018-2029
Table 2: Global Medicinal Cosmetics for Medical Prescriptions Market Revenue (USD Billion) Forecast, by Segment 2, 2018-2029
Table 3: Global Medicinal Cosmetics for Medical Prescriptions Market Revenue (USD Billion) Forecast, by Segment 3, 2018-2029
Table 4: Global Medicinal Cosmetics for Medical Prescriptions Market Revenue (USD Billion) Forecast, by Region, 2018-2029
Table 5: North America Medicinal Cosmetics for Medical Prescriptions Market Revenue (USD Billion) Forecast, by Segment 1, 2018-2029
Table 6: North America Medicinal Cosmetics for Medical Prescriptions Market Revenue (USD Billion) Forecast, by Segment 2, 2018-2029
Table 7: North America Medicinal Cosmetics for Medical Prescriptions Market Revenue (USD Billion) Forecast, by Segment 3, 2018-2029
Table 8: North America Medicinal Cosmetics for Medical Prescriptions Market Revenue (USD Billion) Forecast, by Country, 2018-2029
Table 9: Europe Medicinal Cosmetics for Medical Prescriptions Market Revenue (USD Billion) Forecast, by Segment 1, 2018-2029
Table 10: Europe Medicinal Cosmetics for Medical Prescriptions Market Revenue (USD Billion) Forecast, by Segment 2, 2018-2029
Table 11: Europe Medicinal Cosmetics for Medical Prescriptions Market Revenue (USD Billion) Forecast, by Segment 3, 2018-2029
Table 12: Europe Medicinal Cosmetics for Medical Prescriptions Market Revenue (USD Billion) Forecast, by Country, 2018-2029
Table 13: Latin America Medicinal Cosmetics for Medical Prescriptions Market Revenue (USD Billion) Forecast, by Segment 1, 2018-2029
Table 14: Latin America Medicinal Cosmetics for Medical Prescriptions Market Revenue (USD Billion) Forecast, by Segment 2, 2018-2029
Table 15: Latin America Medicinal Cosmetics for Medical Prescriptions Market Revenue (USD Billion) Forecast, by Segment 3, 2018-2029
Table 16: Latin America Medicinal Cosmetics for Medical Prescriptions Market Revenue (USD Billion) Forecast, by Country, 2018-2029
Table 17: Asia Pacific Medicinal Cosmetics for Medical Prescriptions Market Revenue (USD Billion) Forecast, by Segment 1, 2018-2029
Table 18: Asia Pacific Medicinal Cosmetics for Medical Prescriptions Market Revenue (USD Billion) Forecast, by Segment 2, 2018-2029
Table 19: Asia Pacific Medicinal Cosmetics for Medical Prescriptions Market Revenue (USD Billion) Forecast, by Segment 3, 2018-2029
Table 20: Asia Pacific Medicinal Cosmetics for Medical Prescriptions Market Revenue (USD Billion) Forecast, by Country, 2018-2029
Table 21: Middle East & Africa Medicinal Cosmetics for Medical Prescriptions Market Revenue (USD Billion) Forecast, by Segment 1, 2018-2029
Table 22: Middle East & Africa Medicinal Cosmetics for Medical Prescriptions Market Revenue (USD Billion) Forecast, by Segment 2, 2018-2029
Table 23: Middle East & Africa Medicinal Cosmetics for Medical Prescriptions Market Revenue (USD Billion) Forecast, by Segment 3, 2018-2029
Table 24: Middle East & Africa Medicinal Cosmetics for Medical Prescriptions Market Revenue (USD Billion) Forecast, by Country, 2018-2029
Research Process
Data Library Research are conducted by industry experts who offer insight on
industry structure, market segmentations technology assessment and competitive landscape (CL), and penetration, as well as on emerging trends. Their analysis is based on primary interviews (~ 80%) and secondary research (~ 20%) as well as years of professional expertise in their respective industries. Adding to this, by analysing historical trends and current market positions, our analysts predict where the market will be headed for the next five years. Furthermore, the varying trends of segment & categories geographically presented are also studied and the estimated based on the primary & secondary research.
In this particular report from the supply side Data Library Research has conducted primary surveys (interviews) with the key level executives (VP, CEO’s, Marketing Director, Business Development Manager
and SOFT) of the companies that active & prominent as well as the midsized organization
FIGURE 1: DLR RESEARH PROCESS
![research-methodology1]()
Primary Research
Extensive primary research was conducted to gain a deeper insight of the market and industry performance. The analysis is based on both primary and secondary research as well as years of professional expertise in the respective industries.
In addition to analysing current and historical trends, our analysts predict where the market is headed over the next five years.
It varies by segment for these categories geographically presented in the list of market tables. Speaking about this particular report we have conducted primary surveys (interviews) with the key level executives (VP, CEO’s, Marketing Director, Business Development Manager and many more) of the major players active in the market.
Secondary Research
Secondary research was mainly used to collect and identify information useful for the extensive, technical, market-oriented, and Friend’s study of the Global Extra Neutral Alcohol. It was also used to obtain key information about major players, market classification and segmentation according to the industry trends, geographical markets, and developments related to the market and technology perspectives. For this study, analysts have gathered information from various credible sources, such as annual reports, sec filings, journals, white papers, SOFT presentations, and company web sites.
Market Size Estimation
Both, top-down and bottom-up approaches were used to estimate and validate the size of the Global market and to estimate the size of various other dependent submarkets in the overall Extra Neutral Alcohol. The key players in the market were identified through secondary research and their market contributions in the respective geographies were determined through primary and secondary research.
Forecast Model
![research-methodology2]()