Military Wearable Sensors Market Overview
Wearable sensors are smart electronic devices worn as accessories or implants on the body that have a variety of characteristics and functions. Wearable sensors are part of the Internet of Things (IoT), which includes software sensors, electronics, and connectivity that enable items to exchange data with the help of an operator, a manufacturer, and other connected devices. The global Military Wearable Sensors market is projected to grow at a considerable rate in the forthcoming period.
The development of better, smaller, and cheaper sensors is expected to drive demand for military wearable sensors in the forecast period. Increasing attention on the development of biosensors to monitor a warrior's mental health is likely to be one of the key driving factors for the growth of the military wearable sensors market in the forecast period. The market is also expected to be boost by an increase in the need for military wearable sensors to monitor soldiers' psychological health. These gadgets can communicate with other devices and transfer data with high precision and efficiency. Furthermore, over the forecast period, the military wearable sensors market is expected to benefit from the integration of IoT and AR technologies.
| Report Metric |
Details |
| Market size available for years |
2023–2030 |
| Base year considered |
2023 |
| Forecast period |
2024–2030 |
| Forecast unit |
Value (USD Million) |
| Segments covered |
Product Type, and Region |
| Regions covered |
North America (the U.S. and Canada), Europe (UK, Germany, France, Italy, Spain, Russia, Rest of Europe), Asia-Pacific (China, India, Japan, Australia, South East Asia, Rest of Asia Pacific), Latin America and the Middle East and Africa (Brazil, Saudi Arabia, UAE, Rest of LAMEA) |
| Companies covered |
Ledios, Boeing, Safran Group, TT Electronics, Lockheed Martin, Rheinmetall, Innova Design Solutions, Arralis, Q-Track. |
Covid-19 Impact on Military Wearable Sensors Market
As the COVID-19 pandemic continuing its effect around the world, many defense and aerospace companies are facing its impact during this time around the world. For instance, commercial aviation companies in the U.S., France, Germany, and Canada are facing disruption in the production process and reduced demand as workforces staying at home, passengers stop traveling, and delay in delivery of new aircraft. Analysts expecting a drop from 3,000 to 4,000 aircraft during the pandemic period. On the defense side, contractors operating in the sector are in a better position, hence the impact of the pandemic is likely low in the short to mid-term. However, low demand due to budget constraints affecting the production as in aircraft manufacturing.
Military Wearable Sensors Market Segment Overview
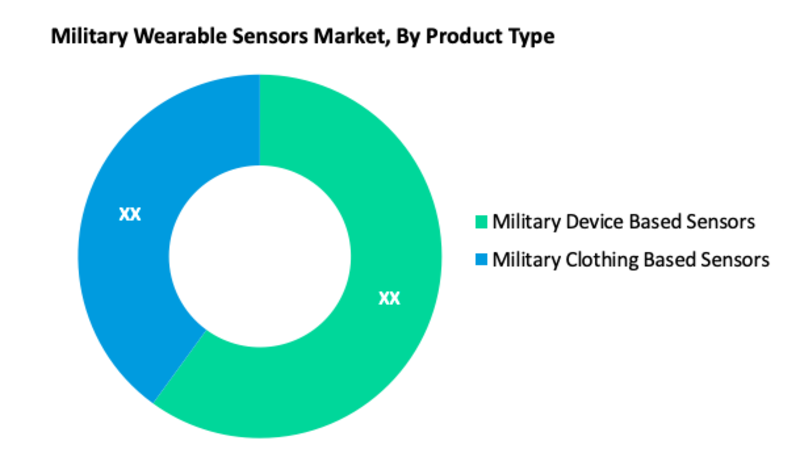
Based on Product Type, the Military Device Based Sensors segment grasps the largest share in the global Military Wearable Sensors market, and the segment is expected to retain its position over the forecast period. Military Device Based Sensors include key chains, goggles, watches, and health tracking enabled wristbands. These devices contain global positioning systems to display and track the position of personnel and physical structures on the field. Additionally, the military-based devices aid to track the actual time data of soldiers in case of situational consciousness.
Military Wearable Sensors Market, By Product Type
· Military Device Based Sensors
· Military Clothing Based Sensors
Military Wearable Sensors Market Regional Overview
Region-Wise, North America held the largest share in the global Military Wearable Sensors market and is expected to retain its dominance over the forecast period. An increase in demand from this region to expand military modernization efforts is anticipated to propel the demand for military wearable sensors over the forecast period. Further, substantial investment for the development and monitoring of soldier health to develop the data security of military platforms is projected to drive the market in this region. Likewise, Europe is expected to be one of the most prominent markets in military wearable sensors due to the massive spending on defense in this region. Again, Asia Pacific is expected to emerge as a significant region in the military wearable sensors market owing to the adoption of IoT technologies for the advancement of its defense industry.
Military Wearable Sensors Market, By Geography
· North America (US & Canada)
· Europe (UK, Germany, France, Italy, Spain, Russia & Rest of Europe)
· Asia-Pacific (Japan, China, India, Australia, & South Korea, & Rest of Asia-Pacific)
· LAMEA (Brazil, Saudi Arabia, UAE & Rest of LAMEA)
Military Wearable Sensors Market, Key Players
· Ledios
· Boeing
· Safran Group
· TT Electronics
· Lockheed Martin
· Rheinmetall
· Innova Design Solutions
· Arralis
· Q-Track
Frequently Asked Questions (FAQ) :
Q1. What are the driving factors for the Military Wearable Sensors market?
Increasing attention on the development of biosensors to monitor a warrior's mental health and the need for military wearable sensors to monitor soldiers' psychological health are some key factors that boost the growth of the Military Wearable Sensors market.
Q2. Which Segments are covered in the Military Wearable Sensors market report?
Product Type, and Region, these segments are covered in the Military Wearable Sensors market report.
Q3. Which are the Product Type segment in the Military Wearable Sensors market?
Military Device Based Sensors, Military Clothing Based Sensors are the Product Type segment in the Military Wearable Sensors market.
Q4. Which segment is projected to hold the largest share in the Military Wearable Sensors Market?
The Military Device Based Sensors segment is projected to hold the largest share in the Military Wearable Sensors Market.
Q5. Which are the prominent players in the Military Wearable Sensors Market?
Ledios, Boeing, Safran Group, TT Electronics, Lockheed Martin, Rheinmetall, Innova Design Solutions, Arralis, Q-Track. are some key players in the Military Wearable Sensors Market.
List of Figures
Figure 1: Global Military Wearable Sensors Market Revenue Breakdown (USD Billion, %) by Region, 2019 & 2027
Figure 2: Global Market Value Share (%), By Segment 1, 2019 & 2027
Figure 3: Global Market Forecast (USD Billion), by Sub-Segment 1, 2016-2027
Figure 4: Global Market Forecast (USD Billion), by Sub-Segment 2, 2016-2027
Figure 5: Global Market Value Share (%), By Segment 2, 2019 & 2027
Figure 6: Global Market Forecast (USD Billion), by Sub-Segment 1, 2016-2027
Figure 7: Global Market Forecast (USD Billion), by Sub-Segment 2, 2016-2027
Figure 8: Global Market Forecast (USD Billion), by Sub-Segment 3, 2016-2027
Figure 9: Global Military Wearable Sensors Market Forecast (USD Billion), by Others, 2016-2027
Figure 10: Global Market Value Share (%), By Segment 3, 2019 & 2027
Figure 11: Global Market Forecast (USD Billion), by Sub-Segment 1, 2016-2027
Figure 12: Global Market Forecast (USD Billion), by Sub-Segment 2, 2016-2027
Figure 13: Global Market Forecast (USD Billion), by Sub-Segment 3, 2016-2027
Figure 14: Global Market Forecast (USD Billion), by Others, 2016-2027
Figure 15: Global Market Value (USD Billion), by Region, 2019 & 2027
Figure 16: North America Military Wearable Sensors Market Value Share (%), By Segment 1, 2019 & 2027
Figure 17: North America Market Forecast (USD Billion), by Sub-Segment 1, 2016-2027
Figure 18: North America Market Forecast (USD Billion), by Sub-Segment 2, 2016-2027
Figure 19: North America Market Value Share (%), By Segment 2, 2019 & 2027
Figure 20: North America Market Forecast (USD Billion), by Sub-Segment 1, 2016-2027
Figure 21: North America Market Forecast (USD Billion), by Sub-Segment 2, 2016-2027
Figure 22: North America Market Forecast (USD Billion), by Sub-Segment 3, 2016-2027
Figure 23: North America Market Forecast (USD Billion), by Others, 2016-2027
Figure 24: North America Market Value Share (%), By Segment 3, 2019 & 2027
Figure 25: North America Market Forecast (USD Billion), by Sub-Segment 1, 2016-2027
Figure 26: North America Market Forecast (USD Billion), by Sub-Segment 2, 2016-2027
Figure 27: North America Market Forecast (USD Billion), by Sub-Segment 3, 2016-2027
Figure 28: North America Market Forecast (USD Billion), by Others, 2016-2027
Figure 29: North America Market Forecast (USD Billion), by U.S., 2016-2027
Figure 30: North America Market Forecast (USD Billion), by Canada, 2016-2027
Figure 31: Latin America Military Wearable Sensors Market Value Share (%), By Segment 1, 2019 & 2027
Figure 32: Latin America Market Forecast (USD Billion), by Sub-Segment 1, 2016-2027
Figure 33: Latin America Market Forecast (USD Billion), by Sub-Segment 2, 2016-2027
Figure 34: Latin America Market Value Share (%), By Segment 2, 2019 & 2027
Figure 35: Latin America Market Forecast (USD Billion), by Sub-Segment 1, 2016-2027
Figure 36: Latin America Market Forecast (USD Billion), by Sub-Segment 2, 2016-2027
Figure 37: Latin America Market Forecast (USD Billion), by Sub-Segment 3, 2016-2027
Figure 38: Latin America Market Forecast (USD Billion), by Others, 2016-2027
Figure 39: Latin America Market Value Share (%), By Segment 3, 2019 & 2027
Figure 40: Latin America Market Forecast (USD Billion), by Sub-Segment 1, 2016-2027
Figure 41: Latin America Market Forecast (USD Billion), by Sub-Segment 2, 2016-2027
Figure 42: Latin America Market Forecast (USD Billion), by Sub-Segment 3, 2016-2027
Figure 43: Latin America Market Forecast (USD Billion), by Others, 2016-2027
Figure 44: Latin America Market Forecast (USD Billion), by Brazil, 2016-2027
Figure 45: Latin America Market Forecast (USD Billion), by Mexico, 2016-2027
Figure 46: Latin America Market Forecast (USD Billion), by Rest of Latin America, 2016-2027
Figure 47: Europe Military Wearable Sensors Market Value Share (%), By Segment 1, 2019 & 2027
Figure 48: Europe Market Forecast (USD Billion), by Sub-Segment 1, 2016-2027
Figure 49: Europe Market Forecast (USD Billion), by Sub-Segment 2, 2016-2027
Figure 50: Europe Market Value Share (%), By Segment 2, 2019 & 2027
Figure 51: Europe Market Forecast (USD Billion), by Sub-Segment 1, 2016-2027
Figure 52: Europe Market Forecast (USD Billion), by Sub-Segment 2, 2016-2027
Figure 53: Europe Market Forecast (USD Billion), by Sub-Segment 3, 2016-2027
Figure 54: Europe Market Forecast (USD Billion), by Others, 2016-2027
Figure 55: Europe Market Value Share (%), By Segment 3, 2019 & 2027
Figure 56: Europe Market Forecast (USD Billion), by Sub-Segment 1, 2016-2027
Figure 57: Europe Market Forecast (USD Billion), by Sub-Segment 2, 2016-2027
Figure 58: Europe Market Forecast (USD Billion), by Sub-Segment 3, 2016-2027
Figure 59: Europe Market Forecast (USD Billion), by Others, 2016-2027
Figure 60: Europe Market Forecast (USD Billion), by U.K., 2016-2027
Figure 61: Europe Market Forecast (USD Billion), by Germany, 2016-2027
Figure 62: Europe Market Forecast (USD Billion), by France, 2016-2027
Figure 63: Europe Market Forecast (USD Billion), by Italy, 2016-2027
Figure 64: Europe Market Forecast (USD Billion), by Spain, 2016-2027
Figure 65: Europe Market Forecast (USD Billion), by Russia, 2016-2027
Figure 66: Europe Market Forecast (USD Billion), by Rest of Europe, 2016-2027
Figure 67: Asia Pacific Military Wearable Sensors Market Value Share (%), By Segment 1, 2019 & 2027
Figure 68: Asia Pacific Market Forecast (USD Billion), by Sub-Segment 1, 2016-2027
Figure 69: Asia Pacific Market Forecast (USD Billion), by Sub-Segment 2, 2016-2027
Figure 70: Asia Pacific Market Value Share (%), By Segment 2, 2019 & 2027
Figure 71: Asia Pacific Market Forecast (USD Billion), by Sub-Segment 1, 2016-2027
Figure 72: Asia Pacific Market Forecast (USD Billion), by Sub-Segment 2, 2016-2027
Figure 73: Asia Pacific Market Forecast (USD Billion), by Sub-Segment 3, 2016-2027
Figure 74: Asia Pacific Market Forecast (USD Billion), by Others, 2016-2027
Figure 75: Asia Pacific Market Value Share (%), By Segment 3, 2019 & 2027
Figure 76: Asia Pacific Market Forecast (USD Billion), by Sub-Segment 1, 2016-2027
Figure 77: Asia Pacific Market Forecast (USD Billion), by Sub-Segment 2, 2016-2027
Figure 78: Asia Pacific Market Forecast (USD Billion), by Sub-Segment 3, 2016-2027
Figure 79: Asia Pacific Market Forecast (USD Billion), by Others, 2016-2027
Figure 80: Asia Pacific Market Forecast (USD Billion), by China, 2016-2027
Figure 81: Asia Pacific Market Forecast (USD Billion), by India, 2016-2027
Figure 82: Asia Pacific Market Forecast (USD Billion), by Japan, 2016-2027
Figure 83: Asia Pacific Market Forecast (USD Billion), by Australia, 2016-2027
Figure 84: Asia Pacific Market Forecast (USD Billion), by Southeast Asia, 2016-2027
Figure 85: Asia Pacific Market Forecast (USD Billion), by Rest of Asia Pacific, 2016-2027
Figure 86: Middle East & Africa Military Wearable Sensors Market Value Share (%), By Segment 1, 2019 & 2027
Figure 87: Middle East & Africa Market Forecast (USD Billion), by Sub-Segment 1, 2016-2027
Figure 88: Middle East & Africa Market Forecast (USD Billion), by Sub-Segment 2, 2016-2027
Figure 89: Middle East & Africa Market Value Share (%), By Segment 2, 2019 & 2027
Figure 90: Middle East & Africa Market Forecast (USD Billion), by Sub-Segment 1, 2016-2027
Figure 91: Middle East & Africa Market Forecast (USD Billion), by Sub-Segment 2, 2016-2027
Figure 92: Middle East & Africa Market Forecast (USD Billion), by Sub-Segment 3, 2016-2027
Figure 93: Middle East & Africa Military Wearable Sensors Market Forecast (USD Billion), by Others, 2016-2027
Figure 94: Middle East & Africa Market Value Share (%), By Segment 3, 2019 & 2027
Figure 95: Middle East & Africa Market Forecast (USD Billion), by Sub-Segment 1, 2016-2027
Figure 96: Middle East & Africa Market Forecast (USD Billion), by Sub-Segment 2, 2016-2027
Figure 97: Middle East & Africa Market Forecast (USD Billion), by Sub-Segment 3, 2016-2027
Figure 98: Middle East & Africa Market Forecast (USD Billion), by Others, 2016-2027
Figure 99: Middle East & Africa Market Forecast (USD Billion), by GCC, 2016-2027
Figure 100: Middle East & Africa Market Forecast (USD Billion), by South Africa, 2016-2027
Figure 101: Middle East & Africa Market Forecast (USD Billion), by Rest of Middle East & Africa, 2016-2027
List of Tables
Table 1: Global Military Wearable Sensors Market Revenue (USD Billion) Forecast, by Segment 1, 2016-2027
Table 2: Global Market Revenue (USD Billion) Forecast, by Segment 2, 2016-2027
Table 3: Global Market Revenue (USD Billion) Forecast, by Segment 3, 2016-2027
Table 4: Global Market Revenue (USD Billion) Forecast, by Region, 2016-2027
Table 5: North America Military Wearable Sensors Market Revenue (USD Billion) Forecast, by Segment 1, 2016-2027
Table 6: North America Market Revenue (USD Billion) Forecast, by Segment 2, 2016-2027
Table 7: North America Market Revenue (USD Billion) Forecast, by Segment 3, 2016-2027
Table 8: North America Market Revenue (USD Billion) Forecast, by Country, 2016-2027
Table 9: Europe Military Wearable Sensors Market Revenue (USD Billion) Forecast, by Segment 1, 2016-2027
Table 10: Europe Market Revenue (USD Billion) Forecast, by Segment 2, 2016-2027
Table 11: Europe Market Revenue (USD Billion) Forecast, by Segment 3, 2016-2027
Table 12: Europe Market Revenue (USD Billion) Forecast, by Country, 2016-2027
Table 13: Latin America Military Wearable Sensors Market Revenue (USD Billion) Forecast, by Segment 1, 2016-2027
Table 14: Latin America Market Revenue (USD Billion) Forecast, by Segment 2, 2016-2027
Table 15: Latin America Market Revenue (USD Billion) Forecast, by Segment 3, 2016-2027
Table 16: Latin America Market Revenue (USD Billion) Forecast, by Country, 2016-2027
Table 17: Asia Pacific Military Wearable Sensors Market Revenue (USD Billion) Forecast, by Segment 1, 2016-2027
Table 18: Asia Pacific Market Revenue (USD Billion) Forecast, by Segment 2, 2016-2027
Table 19: Asia Pacific Market Revenue (USD Billion) Forecast, by Segment 3, 2016-2027
Table 20: Asia Pacific Market Revenue (USD Billion) Forecast, by Country, 2016-2027
Table 21: Middle East & Africa Military Wearable Sensors Market Revenue (USD Billion) Forecast, by Segment 1, 2016-2027
Table 22: Middle East & Africa Market Revenue (USD Billion) Forecast, by Segment 2, 2016-2027
Table 23: Middle East & Africa Market Revenue (USD Billion) Forecast, by Segment 3, 2016-2027
Table 24: Middle East & Africa Market Revenue (USD Billion) Forecast, by Country, 2016-2027
Research Process
Data Library Research are conducted by industry experts who offer insight on
industry structure, market segmentations technology assessment and competitive landscape (CL), and penetration, as well as on emerging trends. Their analysis is based on primary interviews (~ 80%) and secondary research (~ 20%) as well as years of professional expertise in their respective industries. Adding to this, by analysing historical trends and current market positions, our analysts predict where the market will be headed for the next five years. Furthermore, the varying trends of segment & categories geographically presented are also studied and the estimated based on the primary & secondary research.
In this particular report from the supply side Data Library Research has conducted primary surveys (interviews) with the key level executives (VP, CEO’s, Marketing Director, Business Development Manager
and SOFT) of the companies that active & prominent as well as the midsized organization
FIGURE 1: DLR RESEARH PROCESS
![research-methodology1]()
Primary Research
Extensive primary research was conducted to gain a deeper insight of the market and industry performance. The analysis is based on both primary and secondary research as well as years of professional expertise in the respective industries.
In addition to analysing current and historical trends, our analysts predict where the market is headed over the next five years.
It varies by segment for these categories geographically presented in the list of market tables. Speaking about this particular report we have conducted primary surveys (interviews) with the key level executives (VP, CEO’s, Marketing Director, Business Development Manager and many more) of the major players active in the market.
Secondary Research
Secondary research was mainly used to collect and identify information useful for the extensive, technical, market-oriented, and Friend’s study of the Global Extra Neutral Alcohol. It was also used to obtain key information about major players, market classification and segmentation according to the industry trends, geographical markets, and developments related to the market and technology perspectives. For this study, analysts have gathered information from various credible sources, such as annual reports, sec filings, journals, white papers, SOFT presentations, and company web sites.
Market Size Estimation
Both, top-down and bottom-up approaches were used to estimate and validate the size of the Global market and to estimate the size of various other dependent submarkets in the overall Extra Neutral Alcohol. The key players in the market were identified through secondary research and their market contributions in the respective geographies were determined through primary and secondary research.
Forecast Model
![research-methodology2]()