Mobile Oil Change Services Market Overview and Analysis

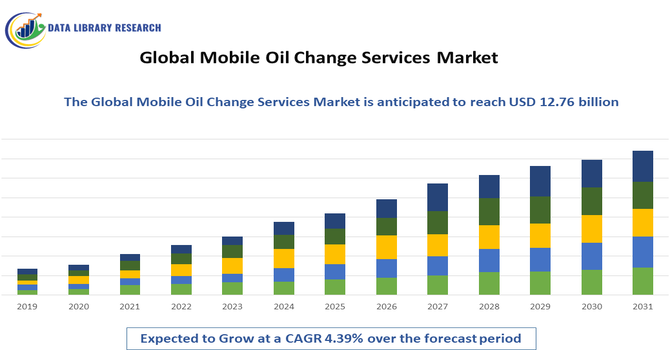
The Global Mobile Oil Change Services Market size was estimated at USD 8.21 billion in 2026 and is expected to grow at a CAGR of 4.39% from 2026 to 2033, reaching USD 12.76 billion in 2033.

The Global Mobile Oil Change Services Market refers to the industry segment that provides on-site or on-demand oil change and basic vehicle maintenance services at a customer’s location, such as homes, workplaces, or fleet facilities. This market includes independent service providers, franchised operations, and app-based platforms that dispatch technicians with tools and supplies. Unlike traditional garages, mobile services emphasize convenience, time saving, and tailored scheduling. Growth is fueled by rising vehicle ownership, busy lifestyles, and digital booking. Service types typically range from standard oil and filter changes to additional inspections, promoting preventive vehicle care without the need to visit a physical service center.

Mobile Oil Change Services Market Latest Trends

The Global Mobile Oil Change Services Market is shaped by trends toward digitalization, subscription-based maintenance, and eco-friendly practices. Consumers increasingly use mobile apps to schedule services, receive real-time tracking, and access automated reminders, driving seamless user experiences. Subscription models offering regular maintenance at set fees are gaining traction, especially among fleet owners seeking predictable costs. There’s also a growing emphasis on sustainable oil disposal and recycling, with providers adopting greener lubricants and waste management practices. Integration with connected vehicle data for predictive maintenance and partnerships with ride-hailing and delivery fleets further define the market’s shift toward convenience, technology, and sustainability.

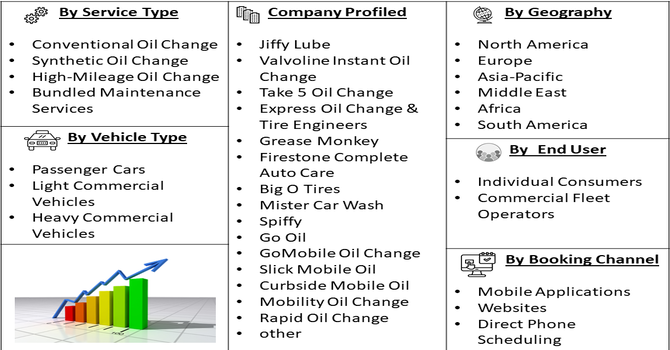
Segmentation: The Global Mobile Oil Change Services Market is segmented by Service Type (Conventional Oil Change, Synthetic Oil Change, High-Mileage Oil Change, and Bundled Maintenance Services), Vehicle Type (Passenger Cars, Light Commercial Vehicles, and Heavy Commercial Vehicles), End User (Individual Consumers and Commercial Fleet Operators), Booking Channel (Mobile Applications, Websites, and Direct Phone Scheduling), and Geography (North America, Europe, Asia-Pacific, Middle East and Africa, and South America). The report provides the value (in USD million) for the above segments.

Market Drivers:

  • Convenience and time savings for customers

Major driver of the Global Mobile Oil Change Services Market is convenience and time savings for customers. In today’s fast-paced world, many vehicle owners lack time to visit traditional service centers during work hours or weekends. Mobile services eliminate travel, waiting, and scheduling hassles by coming directly to the customer’s preferred location. Smartphone apps and online booking tools further simplify the process, allowing bookings in minutes with real-time scheduling updates. This appeals especially to busy professionals, families, and fleet managers seeking efficient, predictable maintenance. As consumers increasingly prioritize services that save time and effort, demand for mobile oil changes continues to grow rapidly worldwide.

  • Increase in vehicle ownership and fleet operations

Another key driver is the increase in vehicle ownership and fleet operations globally. As more people and businesses acquire cars, trucks, and commercial fleets, the demand for regular maintenance begins to rise. For instance, In January 2025, Amerit Fleet Solutions partnered with New Mountain Capital to speed up geographic expansion by adding field technicians and mobile service units, strengthening its nationwide service footprint. This expansion supported the rise in fleet operations by increasing mobile maintenance capacity and coverage. It strengthened service accessibility for growing vehicle fleets, boosting demand and market growth in the Global Mobile Oil Change Services Market through improved convenience and faster response times.

Mobile oil change providers offer scalable solutions, servicing multiple vehicles at centralized locations without disrupting operations. In emerging markets with growing middle classes, car ownership rates are climbing, further expanding the customer base. This escalating need for accessible, reliable maintenance fuels market growth and attracts new service providers and investors.

Market Restraints:

  • Limited awareness and consumer trust in mobile service

A significant restraint on market growth is limited awareness and consumer trust in mobile service quality. Many vehicle owners remain accustomed to established brick-and-mortar garages and dealerships, often perceiving them as more reliable or professional. Concerns about consistent service quality, technician qualifications, warranties, and vehicle safety can deter potential users. In regions with low digital penetration or weak brand reputation for mobile providers, customers may lack awareness that such services exist or how they operate. Overcoming these trust barriers requires education, transparent pricing, strong customer reviews, and standardized training—efforts that take time and investment, slowing initial market expansion.

Socioeconomic Impact on Mobile Oil Change Services Market

The socioeconomic impact of the Global Mobile Oil Change Services Market extends to employment, consumer behavior, and local economies. By creating jobs for mobile technicians, dispatchers, and digital platform workers, the market supports workforce diversification and flexible work arrangements. It makes vehicle maintenance more accessible to underserved or rural communities, potentially enhancing road safety and vehicle longevity. The convenience economy also shifts consumer expectations toward on-demand services, influencing spending patterns. However, there may be competitive pressure on traditional service centers, requiring them to innovate or specialize. Overall, this market fosters service-sector growth, tech adoption, and increased economic activity tied to vehicle maintenance.

Segmental Analysis:

  • Conventional Oil Change segment is expected to witness highest growth over the forecast period

The conventional oil change segment is expected to witness the highest growth over the forecast period due to its cost-effectiveness and widespread compatibility with older and mid-range vehicles. Many vehicle owners, particularly in price-sensitive markets, prefer conventional oil because it meets basic engine protection needs at a lower service cost. Mobile service providers increasingly promote conventional oil changes to attract first-time users and budget-conscious customers. In addition, conventional oil is commonly used for high-frequency maintenance cycles, especially for vehicles with shorter oil change intervals. This steady demand, combined with easy availability and faster service delivery, supports strong growth for this segment globally.

  • Heavy Commercial Vehicles segment is expected to witness highest growth over the forecast period

The heavy commercial vehicles segment is expected to witness the highest growth over the forecast period due to rising logistics, construction, and industrial transportation activities worldwide. Trucks, buses, and heavy-duty vehicles require frequent oil changes to ensure engine reliability and minimize costly downtime. Mobile oil change services offer a practical solution by servicing these vehicles directly at depots, job sites, or parking yards. This reduces operational disruptions and improves fleet efficiency. Growing investments in infrastructure development and e-commerce logistics further increase heavy vehicle usage, driving demand for on-site maintenance solutions and accelerating growth in this segment.

  • Commercial Fleet Operators segment is expected to witness highest growth over the forecast period

The commercial fleet operators segment is expected to witness the highest growth over the forecast period as businesses prioritize efficiency, cost control, and vehicle uptime. Fleet operators managing delivery vans, taxis, ride-hailing vehicles, and service trucks benefit significantly from mobile oil change services that reduce off-road time. Scheduled, on-site maintenance enables better planning and lowers labor and fuel costs associated with traveling to service centers. Additionally, subscription-based service models and bulk pricing offered by mobile providers appeal to fleet managers seeking predictable expenses. The expansion of last-mile delivery and shared mobility services further strengthens demand in this segment.

  • Mobile Applications segment is expected to witness highest growth over the forecast period

The growth of mobile applications is a key driving factor for the Global Mobile Oil Change Services Market, as apps simplify booking, scheduling, and service tracking for customers. Mobile applications enable users to select service types, choose preferred time slots, receive real-time technician updates, and make cashless payments, enhancing convenience and transparency. Push notifications and maintenance reminders encourage timely oil changes, increasing repeat usage. For service providers, apps support route optimization, customer data management, and subscription offerings, improving operational efficiency. Rising smartphone penetration, increased comfort with app-based services, and demand for on-demand automotive care continue to accelerate market growth through mobile applications.

  • North American Region is expected to witness highest growth over the forecast period

The North American region is expected to witness the highest growth over the forecast period due to high vehicle ownership, strong adoption of on-demand services, and advanced digital infrastructure. Consumers in the region increasingly value convenience and time-saving solutions, making mobile oil change services highly attractive.

In Janaury 2024, Ryder acquired Pit Stop Fleet Service, integrating its mobile-repair software and technician team into Ryder’s service network to enhance mobile fleet maintenance capabilities. The acquisition improved fleet maintenance efficiency and service scalability, aligning with rising vehicle ownership and fleet expansion. It reinforced mobile service adoption among commercial operators, contributing to growth in the US’s Mobile Oil Change Services Market by offering stronger digital scheduling and on-site repair support.

The presence of established automotive service brands, tech-enabled startups, and large commercial fleets further supports market expansion. In addition, the growth of e-commerce, ride-hailing, and delivery services increases demand for efficient fleet maintenance. Favorable consumer awareness, higher disposable incomes, and widespread smartphone usage collectively contribute to North America’s strong growth outlook.

Mobile Oil Change Services Market Competitive Landscape

The competitive landscape of the Global Mobile Oil Change Services Market is varied, with independent operators, regional service providers, franchised brands, and tech-driven platforms vying for market share. Larger franchise networks and well-funded app-based companies often differentiate through advanced booking systems, subscription packages, and branded quality assurance. Smaller local providers compete on personalized service, price, and community reputation. Strategic partnerships with fleet operators, insurance companies, and automotive manufacturers are common. Competitive dynamics also emphasize differentiators like environmentally friendly oil disposal, bundled maintenance offerings, and loyalty programs. As the market matures, consolidation, alliances, and innovation are expected to shape competitive positioning worldwide.

The major players for above market are:

  • Jiffy Lube
  • Valvoline Instant Oil Change
  • Take 5 Oil Change
  • Express Oil Change & Tire Engineers
  • Grease Monkey
  • Firestone Complete Auto Care
  • Big O Tires
  • Mister Car Wash
  • Spiffy
  • Go Oil
  • GoMobile Oil Change
  • Slick Mobile Oil
  • Curbside Mobile Oil
  • Mobility Oil Change
  • Rapid Oil Change
  • LubeZone
  • On The Go Mobile Oil
  • MOCO Express
  • Oil Change Pros

Recent Development

  • In December 2025, ExxonMobil updated its Corporate Plan through 2030, strengthening earnings, cash flow, and operational efficiency through lower costs and a profitable business mix. This progress supported lubricant innovation, supply stability, and sustainability goals, positively impacting the Global Mobile Oil Change Services Market by reinforcing product reliability, service scalability, and long-term confidence among mobile service providers.


  • In October 2023, Mobil 1 entered a long-term agreement with Steer to enhance digital marketing and customer engagement for automotive services. This collaboration strengthened service visibility, improved customer communication, and supported workshop efficiency, positively influencing the Global Mobile Oil Change Services Market by accelerating technology adoption and elevating customer experience standards across mobile and on-demand oil change operations.


Frequently Asked Questions (FAQ) :

Q1. What are the main growth-driving factors for this market?

The primary driver is the increasing consumer demand for convenience and time-saving solutions. Busy professionals prefer services that come to their home or workplace. Additionally, the growth of corporate fleet management and on-demand economy services has pushed businesses to adopt mobile maintenance to minimize vehicle downtime and operational disruptions.

Q2. What are the main restraining factors for this market?

High operational costs, including specialized service vehicles and travel expenses, can limit profit margins. Environmental regulations regarding the handling and disposal of waste oil in residential areas also pose challenges. Furthermore, some consumers remain skeptical about the quality of equipment used in mobile setups compared to traditional brick-and-mortar service centers.

Q3. Which segment is expected to witness high growth?

The fleet service segment is expected to witness the highest growth. Delivery companies, ride-sharing platforms, and logistics firms are increasingly outsourcing maintenance to mobile providers to keep their vehicles on the road. This B2B model offers predictable revenue streams and higher volume compared to individual, one-off residential service calls.

Q4. Who are the top major players for this market?

Prominent players include Spiffy, Curbee, Firestone Direct (owned by Bridgestone), and Jiffy Lube, which has expanded into mobile offerings. Other emerging startups like YourMechanic and Yoshi also hold significant shares. These companies compete through advanced scheduling apps, eco-friendly oil disposal techniques, and comprehensive multi-point inspection service bundles.

Q5. Which country is the largest player?

The United States is the largest player in this market. Its dominance is fueled by a high rate of vehicle ownership, a culture that prioritizes convenience-based services, and a mature gig economy. Major metropolitan areas in the U.S. provide the density required for mobile service providers to operate efficiently and profitably.

Mobile Oil Change Services MARKET STUDY GLOBAL MARKET ANALYSIS, INSIGHTS AND FORECAST, 2022-2029

    1. Introduction

    • 1.1. Research Scope
    • 1.2. Market Segmentation
    • 1.3. Research Methodology
    • 1.4. Definitions and Assumptions

    2. Executive Summary

      3. Market Dynamics

      • 3.1. Market Drivers
      • 3.2. Market Restraints
      • 3.3. Market Opportunities

      4. Key Insights

      • 4.1. Key Emerging Trends – For Major Countries
      • 4.2. Latest Technological Advancement
      • 4.3. Regulatory Landscape
      • 4.4. Industry SWOT Analysis
      • 4.5. Porters Five Forces Analysis

      5. Global Mobile Oil Change Services Market Analysis (USD Billion), Insights and Forecast, 2018-2029

      • 5.1. Key Findings / Summary
      • 5.2. Market Analysis, Insights and Forecast – By Segment 1
        • 5.2.1. Sub-Segment 1
        • 5.2.2. Sub-Segment 2
      • 5.3. Market Analysis, Insights and Forecast – By Segment 2
        • 5.3.1. Sub-Segment 1
        • 5.3.2. Sub-Segment 2
        • 5.3.3. Sub-Segment 3
        • 5.3.4. Others
      • 5.4. Market Analysis, Insights and Forecast – By Segment 3
        • 5.4.1. Sub-Segment 1
        • 5.4.2. Sub-Segment 2
        • 5.4.3. Sub-Segment 3
        • 5.4.4. Others
      • 5.5. Market Analysis, Insights and Forecast – By Region
        • 5.5.1. North America
        • 5.5.2. Latin America
        • 5.5.3. Europe
        • 5.5.4. Asia Pacific
        • 5.5.5. Middle East and Africa

      6. North America Mobile Oil Change Services Market Analysis (USD Billion), Insights and Forecast, 2018-2029

      • 6.1. Key Findings / Summary
      • 6.2. Market Analysis, Insights and Forecast – By Segment 1
        • 6.2.1. Sub-Segment 1
        • 6.2.2. Sub-Segment 2
      • 6.3. Market Analysis, Insights and Forecast – By Segment 2
        • 6.3.1. Sub-Segment 1
        • 6.3.2. Sub-Segment 2
        • 6.3.3. Sub-Segment 3
        • 6.3.4. Others
      • 6.4. Market Analysis, Insights and Forecast – By Segment 3
        • 6.4.1. Sub-Segment 1
        • 6.4.2. Sub-Segment 2
        • 6.4.3. Sub-Segment 3
        • 6.4.4. Others
      • 6.5. Market Analysis, Insights and Forecast – By Country
        • 6.5.1. U.S.
        • 6.5.2. Canada

      7. Latin America Mobile Oil Change Services Market Analysis (USD Billion), Insights and Forecast, 2018-2029

      • 7.1. Key Findings / Summary
      • 7.2. Market Analysis, Insights and Forecast – By Segment 1
        • 7.2.1. Sub-Segment 1
        • 7.2.2. Sub-Segment 2
      • 7.3. Market Analysis, Insights and Forecast – By Segment 2
        • 7.3.1. Sub-Segment 1
        • 7.3.2. Sub-Segment 2
        • 7.3.3. Sub-Segment 3
        • 7.3.4. Others
      • 7.4. Market Analysis, Insights and Forecast – By Segment 3
        • 7.4.1. Sub-Segment 1
        • 7.4.2. Sub-Segment 2
        • 7.4.3. Sub-Segment 3
        • 7.4.4. Others
      • 7.5. Insights and Forecast – By Country
        • 7.5.1. Brazil
        • 7.5.2. Mexico
        • 7.5.3. Rest of Latin America

      8. Europe Mobile Oil Change Services Market Analysis (USD Billion), Insights and Forecast, 2018-2029

      • 8.1. Key Findings / Summary
      • 8.2. Market Analysis, Insights and Forecast – By Segment 1
        • 8.2.1. Sub-Segment 1
        • 8.2.2. Sub-Segment 2
      • 8.3. Market Analysis, Insights and Forecast – By Segment 2
        • 8.3.1. Sub-Segment 1
        • 8.3.2. Sub-Segment 2
        • 8.3.3. Sub-Segment 3
        • 8.3.4. Others
      • 8.4. Market Analysis, Insights and Forecast – By Segment 3
        • 8.4.1. Sub-Segment 1
        • 8.4.2. Sub-Segment 2
        • 8.4.3. Sub-Segment 3
        • 8.4.4. Others
      • 8.5. Market Analysis, Insights and Forecast – By Country
        • 8.5.1. UK
        • 8.5.2. Germany
        • 8.5.3. France
        • 8.5.4. Italy
        • 8.5.5. Spain
        • 8.5.6. Russia
        • 8.5.7. Rest of Europe

      9. Asia Pacific Mobile Oil Change Services Market Analysis (USD Billion), Insights and Forecast, 2018-2029

      • 9.1. Key Findings / Summary
      • 9.2. Market Analysis, Insights and Forecast – By Segment 1
        • 9.2.1. Sub-Segment 1
        • 9.2.2. Sub-Segment 2
      • 9.3. Market Analysis, Insights and Forecast – By Segment 2
        • 9.3.1. Sub-Segment 1
        • 9.3.2. Sub-Segment 2
        • 9.3.3. Sub-Segment 3
        • 9.3.4. Others
      • 9.4. Market Analysis, Insights and Forecast – By Segment 3
        • 9.4.1. Sub-Segment 1
        • 9.4.2. Sub-Segment 2
        • 9.4.3. Sub-Segment 3
        • 9.4.4. Others
      • 9.5. Market Analysis, Insights and Forecast – By Country
        • 9.5.1. China
        • 9.5.2. India
        • 9.5.3. Japan
        • 9.5.4. Australia
        • 9.5.5. South East Asia
        • 9.5.6. Rest of Asia Pacific

      10. Middle East & Africa Mobile Oil Change Services Market Analysis (USD Billion), Insights and Forecast, 2018-2029

      • 10.1. Key Findings / Summary
      • 10.2. Market Analysis, Insights and Forecast – By Segment 1
        • 10.2.1. Sub-Segment 1
        • 10.2.2. Sub-Segment 2
      • 10.3. Market Analysis, Insights and Forecast – By Segment 2
        • 10.3.1. Sub-Segment 1
        • 10.3.2. Sub-Segment 2
        • 10.3.3. Sub-Segment 3
        • 10.3.4. Others
      • 10.4. Market Analysis, Insights and Forecast – By Segment 3
        • 10.4.1. Sub-Segment 1
        • 10.4.2. Sub-Segment 2
        • 10.4.3. Sub-Segment 3
        • 10.4.4. Others
      • 10.5. Market Analysis, Insights and Forecast – By Country
        • 10.5.1. GCC
        • 10.5.2. South Africa
        • 10.5.3. Rest of Middle East & Africa

      11. Competitive Analysis

      • 11.1. Company Market Share Analysis, 2018
      • 11.2. Key Industry Developments
      • 11.3. Company Profile
        • 11.3.1. Company 1
          • 11.3.1.1. Business Overview
          • 11.3.1.2. Segment 1 & Service Offering
          • 11.3.1.3. Overall Revenue
          • 11.3.1.4. Geographic Presence
          • 11.3.1.5. Recent Development
        *Similar details will be provided for the following companies
        • 11.3.2. Company 2
        • 11.3.3. Company 3
        • 11.3.4. Company 4
        • 11.3.5. Company 5
        • 11.3.6. Company 6
        • 11.3.7. Company 7
        • 11.3.8. Company 8
        • 11.3.9. Company 9
        • 11.3.10. Company 10
        • 11.3.11. Company 11
        • 11.3.12. Company 12
      List of Figures

      Figure 1: Global Mobile Oil Change Services Market Revenue Breakdown (USD Billion, %) by Region, 2022 & 2029
      Figure 2: Global Mobile Oil Change Services Market Value Share (%), By Segment 1, 2022 & 2029
      Figure 3: Global Mobile Oil Change Services Market Forecast (USD Billion), by Sub-Segment 1, 2018-2029
      Figure 4: Global Mobile Oil Change Services Market Forecast (USD Billion), by Sub-Segment 2, 2018-2029
      Figure 5: Global Mobile Oil Change Services Market Value Share (%), By Segment 2, 2022 & 2029
      Figure 6: Global Mobile Oil Change Services Market Forecast (USD Billion), by Sub-Segment 1, 2018-2029
      Figure 7: Global Mobile Oil Change Services Market Forecast (USD Billion), by Sub-Segment 2, 2018-2029
      Figure 8: Global Mobile Oil Change Services Market Forecast (USD Billion), by Sub-Segment 3, 2018-2029
      Figure 9: Global Mobile Oil Change Services Market Forecast (USD Billion), by Others, 2018-2029
      Figure 10: Global Mobile Oil Change Services Market Value Share (%), By Segment 3, 2022 & 2029
      Figure 11: Global Mobile Oil Change Services Market Forecast (USD Billion), by Sub-Segment 1, 2018-2029
      Figure 12: Global Mobile Oil Change Services Market Forecast (USD Billion), by Sub-Segment 2, 2018-2029
      Figure 13: Global Mobile Oil Change Services Market Forecast (USD Billion), by Sub-Segment 3, 2018-2029
      Figure 14: Global Mobile Oil Change Services Market Forecast (USD Billion), by Others, 2018-2029
      Figure 15: Global Mobile Oil Change Services Market Value (USD Billion), by Region, 2022 & 2029
      Figure 16: North America Mobile Oil Change Services Market Value Share (%), By Segment 1, 2022 & 2029
      Figure 17: North America Mobile Oil Change Services Market Forecast (USD Billion), by Sub-Segment 1, 2018-2029
      Figure 18: North America Mobile Oil Change Services Market Forecast (USD Billion), by Sub-Segment 2, 2018-2029
      Figure 19: North America Mobile Oil Change Services Market Value Share (%), By Segment 2, 2022 & 2029
      Figure 20: North America Mobile Oil Change Services Market Forecast (USD Billion), by Sub-Segment 1, 2018-2029
      Figure 21: North America Mobile Oil Change Services Market Forecast (USD Billion), by Sub-Segment 2, 2018-2029
      Figure 22: North America Mobile Oil Change Services Market Forecast (USD Billion), by Sub-Segment 3, 2018-2029
      Figure 23: North America Mobile Oil Change Services Market Forecast (USD Billion), by Others, 2018-2029
      Figure 24: North America Mobile Oil Change Services Market Value Share (%), By Segment 3, 2022 & 2029
      Figure 25: North America Mobile Oil Change Services Market Forecast (USD Billion), by Sub-Segment 1, 2018-2029
      Figure 26: North America Mobile Oil Change Services Market Forecast (USD Billion), by Sub-Segment 2, 2018-2029
      Figure 27: North America Mobile Oil Change Services Market Forecast (USD Billion), by Sub-Segment 3, 2018-2029
      Figure 28: North America Mobile Oil Change Services Market Forecast (USD Billion), by Others, 2018-2029
      Figure 29: North America Mobile Oil Change Services Market Forecast (USD Billion), by U.S., 2018-2029
      Figure 30: North America Mobile Oil Change Services Market Forecast (USD Billion), by Canada, 2018-2029
      Figure 31: Latin America Mobile Oil Change Services Market Value Share (%), By Segment 1, 2022 & 2029
      Figure 32: Latin America Mobile Oil Change Services Market Forecast (USD Billion), by Sub-Segment 1, 2018-2029
      Figure 33: Latin America Mobile Oil Change Services Market Forecast (USD Billion), by Sub-Segment 2, 2018-2029
      Figure 34: Latin America Mobile Oil Change Services Market Value Share (%), By Segment 2, 2022 & 2029
      Figure 35: Latin America Mobile Oil Change Services Market Forecast (USD Billion), by Sub-Segment 1, 2018-2029
      Figure 36: Latin America Mobile Oil Change Services Market Forecast (USD Billion), by Sub-Segment 2, 2018-2029
      Figure 37: Latin America Mobile Oil Change Services Market Forecast (USD Billion), by Sub-Segment 3, 2018-2029
      Figure 38: Latin America Mobile Oil Change Services Market Forecast (USD Billion), by Others, 2018-2029
      Figure 39: Latin America Mobile Oil Change Services Market Value Share (%), By Segment 3, 2022 & 2029
      Figure 40: Latin America Mobile Oil Change Services Market Forecast (USD Billion), by Sub-Segment 1, 2018-2029
      Figure 41: Latin America Mobile Oil Change Services Market Forecast (USD Billion), by Sub-Segment 2, 2018-2029
      Figure 42: Latin America Mobile Oil Change Services Market Forecast (USD Billion), by Sub-Segment 3, 2018-2029
      Figure 43: Latin America Mobile Oil Change Services Market Forecast (USD Billion), by Others, 2018-2029
      Figure 44: Latin America Mobile Oil Change Services Market Forecast (USD Billion), by Brazil, 2018-2029
      Figure 45: Latin America Mobile Oil Change Services Market Forecast (USD Billion), by Mexico, 2018-2029
      Figure 46: Latin America Mobile Oil Change Services Market Forecast (USD Billion), by Rest of Latin America, 2018-2029
      Figure 47: Europe Mobile Oil Change Services Market Value Share (%), By Segment 1, 2022 & 2029
      Figure 48: Europe Mobile Oil Change Services Market Forecast (USD Billion), by Sub-Segment 1, 2018-2029
      Figure 49: Europe Mobile Oil Change Services Market Forecast (USD Billion), by Sub-Segment 2, 2018-2029
      Figure 50: Europe Mobile Oil Change Services Market Value Share (%), By Segment 2, 2022 & 2029
      Figure 51: Europe Mobile Oil Change Services Market Forecast (USD Billion), by Sub-Segment 1, 2018-2029
      Figure 52: Europe Mobile Oil Change Services Market Forecast (USD Billion), by Sub-Segment 2, 2018-2029
      Figure 53: Europe Mobile Oil Change Services Market Forecast (USD Billion), by Sub-Segment 3, 2018-2029
      Figure 54: Europe Mobile Oil Change Services Market Forecast (USD Billion), by Others, 2018-2029
      Figure 55: Europe Mobile Oil Change Services Market Value Share (%), By Segment 3, 2022 & 2029
      Figure 56: Europe Mobile Oil Change Services Market Forecast (USD Billion), by Sub-Segment 1, 2018-2029
      Figure 57: Europe Mobile Oil Change Services Market Forecast (USD Billion), by Sub-Segment 2, 2018-2029
      Figure 58: Europe Mobile Oil Change Services Market Forecast (USD Billion), by Sub-Segment 3, 2018-2029
      Figure 59: Europe Mobile Oil Change Services Market Forecast (USD Billion), by Others, 2018-2029
      Figure 60: Europe Mobile Oil Change Services Market Forecast (USD Billion), by U.K., 2018-2029
      Figure 61: Europe Mobile Oil Change Services Market Forecast (USD Billion), by Germany, 2018-2029
      Figure 62: Europe Mobile Oil Change Services Market Forecast (USD Billion), by France, 2018-2029
      Figure 63: Europe Mobile Oil Change Services Market Forecast (USD Billion), by Italy, 2018-2029
      Figure 64: Europe Mobile Oil Change Services Market Forecast (USD Billion), by Spain, 2018-2029
      Figure 65: Europe Mobile Oil Change Services Market Forecast (USD Billion), by Russia, 2018-2029
      Figure 66: Europe Mobile Oil Change Services Market Forecast (USD Billion), by Rest of Europe, 2018-2029
      Figure 67: Asia Pacific Mobile Oil Change Services Market Value Share (%), By Segment 1, 2022 & 2029
      Figure 68: Asia Pacific Mobile Oil Change Services Market Forecast (USD Billion), by Sub-Segment 1, 2018-2029
      Figure 69: Asia Pacific Mobile Oil Change Services Market Forecast (USD Billion), by Sub-Segment 2, 2018-2029
      Figure 70: Asia Pacific Mobile Oil Change Services Market Value Share (%), By Segment 2, 2022 & 2029
      Figure 71: Asia Pacific Mobile Oil Change Services Market Forecast (USD Billion), by Sub-Segment 1, 2018-2029
      Figure 72: Asia Pacific Mobile Oil Change Services Market Forecast (USD Billion), by Sub-Segment 2, 2018-2029
      Figure 73: Asia Pacific Mobile Oil Change Services Market Forecast (USD Billion), by Sub-Segment 3, 2018-2029
      Figure 74: Asia Pacific Mobile Oil Change Services Market Forecast (USD Billion), by Others, 2018-2029
      Figure 75: Asia Pacific Mobile Oil Change Services Market Value Share (%), By Segment 3, 2022 & 2029
      Figure 76: Asia Pacific Mobile Oil Change Services Market Forecast (USD Billion), by Sub-Segment 1, 2018-2029
      Figure 77: Asia Pacific Mobile Oil Change Services Market Forecast (USD Billion), by Sub-Segment 2, 2018-2029
      Figure 78: Asia Pacific Mobile Oil Change Services Market Forecast (USD Billion), by Sub-Segment 3, 2018-2029
      Figure 79: Asia Pacific Mobile Oil Change Services Market Forecast (USD Billion), by Others, 2018-2029
      Figure 80: Asia Pacific Mobile Oil Change Services Market Forecast (USD Billion), by China, 2018-2029
      Figure 81: Asia Pacific Mobile Oil Change Services Market Forecast (USD Billion), by India, 2018-2029
      Figure 82: Asia Pacific Mobile Oil Change Services Market Forecast (USD Billion), by Japan, 2018-2029
      Figure 83: Asia Pacific Mobile Oil Change Services Market Forecast (USD Billion), by Australia, 2018-2029
      Figure 84: Asia Pacific Mobile Oil Change Services Market Forecast (USD Billion), by Southeast Asia, 2018-2029
      Figure 85: Asia Pacific Mobile Oil Change Services Market Forecast (USD Billion), by Rest of Asia Pacific, 2018-2029
      Figure 86: Middle East & Africa Mobile Oil Change Services Market Value Share (%), By Segment 1, 2022 & 2029
      Figure 87: Middle East & Africa Mobile Oil Change Services Market Forecast (USD Billion), by Sub-Segment 1, 2018-2029
      Figure 88: Middle East & Africa Mobile Oil Change Services Market Forecast (USD Billion), by Sub-Segment 2, 2018-2029
      Figure 89: Middle East & Africa Mobile Oil Change Services Market Value Share (%), By Segment 2, 2022 & 2029
      Figure 90: Middle East & Africa Mobile Oil Change Services Market Forecast (USD Billion), by Sub-Segment 1, 2018-2029
      Figure 91: Middle East & Africa Mobile Oil Change Services Market Forecast (USD Billion), by Sub-Segment 2, 2018-2029
      Figure 92: Middle East & Africa Mobile Oil Change Services Market Forecast (USD Billion), by Sub-Segment 3, 2018-2029
      Figure 93: Middle East & Africa Mobile Oil Change Services Market Forecast (USD Billion), by Others, 2018-2029
      Figure 94: Middle East & Africa Mobile Oil Change Services Market Value Share (%), By Segment 3, 2022 & 2029
      Figure 95: Middle East & Africa Mobile Oil Change Services Market Forecast (USD Billion), by Sub-Segment 1, 2018-2029
      Figure 96: Middle East & Africa Mobile Oil Change Services Market Forecast (USD Billion), by Sub-Segment 2, 2018-2029
      Figure 97: Middle East & Africa Mobile Oil Change Services Market Forecast (USD Billion), by Sub-Segment 3, 2018-2029
      Figure 98: Middle East & Africa Mobile Oil Change Services Market Forecast (USD Billion), by Others, 2018-2029
      Figure 99: Middle East & Africa Mobile Oil Change Services Market Forecast (USD Billion), by GCC, 2018-2029
      Figure 100: Middle East & Africa Mobile Oil Change Services Market Forecast (USD Billion), by South Africa, 2018-2029
      Figure 101: Middle East & Africa Mobile Oil Change Services Market Forecast (USD Billion), by Rest of Middle East & Africa, 2018-2029 
      List of Tables
      Table 1: Global Mobile Oil Change Services Market Revenue (USD Billion) Forecast, by Segment 1, 2018-2029
      Table 2: Global Mobile Oil Change Services Market Revenue (USD Billion) Forecast, by Segment 2, 2018-2029
      Table 3: Global Mobile Oil Change Services Market Revenue (USD Billion) Forecast, by Segment 3, 2018-2029
      Table 4: Global Mobile Oil Change Services Market Revenue (USD Billion) Forecast, by Region, 2018-2029
      Table 5: North America Mobile Oil Change Services Market Revenue (USD Billion) Forecast, by Segment 1, 2018-2029
      Table 6: North America Mobile Oil Change Services Market Revenue (USD Billion) Forecast, by Segment 2, 2018-2029
      Table 7: North America Mobile Oil Change Services Market Revenue (USD Billion) Forecast, by Segment 3, 2018-2029
      Table 8: North America Mobile Oil Change Services Market Revenue (USD Billion) Forecast, by Country, 2018-2029
      Table 9: Europe Mobile Oil Change Services Market Revenue (USD Billion) Forecast, by Segment 1, 2018-2029
      Table 10: Europe Mobile Oil Change Services Market Revenue (USD Billion) Forecast, by Segment 2, 2018-2029
      Table 11: Europe Mobile Oil Change Services Market Revenue (USD Billion) Forecast, by Segment 3, 2018-2029
      Table 12: Europe Mobile Oil Change Services Market Revenue (USD Billion) Forecast, by Country, 2018-2029
      Table 13: Latin America Mobile Oil Change Services Market Revenue (USD Billion) Forecast, by Segment 1, 2018-2029
      Table 14: Latin America Mobile Oil Change Services Market Revenue (USD Billion) Forecast, by Segment 2, 2018-2029
      Table 15: Latin America Mobile Oil Change Services Market Revenue (USD Billion) Forecast, by Segment 3, 2018-2029
      Table 16: Latin America Mobile Oil Change Services Market Revenue (USD Billion) Forecast, by Country, 2018-2029
      Table 17: Asia Pacific Mobile Oil Change Services Market Revenue (USD Billion) Forecast, by Segment 1, 2018-2029
      Table 18: Asia Pacific Mobile Oil Change Services Market Revenue (USD Billion) Forecast, by Segment 2, 2018-2029
      Table 19: Asia Pacific Mobile Oil Change Services Market Revenue (USD Billion) Forecast, by Segment 3, 2018-2029
      Table 20: Asia Pacific Mobile Oil Change Services Market Revenue (USD Billion) Forecast, by Country, 2018-2029
      Table 21: Middle East & Africa Mobile Oil Change Services Market Revenue (USD Billion) Forecast, by Segment 1, 2018-2029
      Table 22: Middle East & Africa Mobile Oil Change Services Market Revenue (USD Billion) Forecast, by Segment 2, 2018-2029
      Table 23: Middle East & Africa Mobile Oil Change Services Market Revenue (USD Billion) Forecast, by Segment 3, 2018-2029
      Table 24: Middle East & Africa Mobile Oil Change Services Market Revenue (USD Billion) Forecast, by Country, 2018-2029
      Research Process

      Data Library Research are conducted by industry experts who offer insight on industry structure, market segmentations technology assessment and competitive landscape (CL), and penetration, as well as on emerging trends. Their analysis is based on primary interviews (~ 80%) and secondary research (~ 20%) as well as years of professional expertise in their respective industries. Adding to this, by analysing historical trends and current market positions, our analysts predict where the market will be headed for the next five years. Furthermore, the varying trends of segment & categories geographically presented are also studied and the estimated based on the primary & secondary research.

      In this particular report from the supply side Data Library Research has conducted primary surveys (interviews) with the key level executives (VP, CEO’s, Marketing Director, Business Development Manager and SOFT) of the companies that active & prominent as well as the midsized organization

      FIGURE 1: DLR RESEARH PROCESS

      research-methodology1

      Primary Research

      Extensive primary research was conducted to gain a deeper insight of the market and industry performance. The analysis is based on both primary and secondary research as well as years of professional expertise in the respective industries.

      In addition to analysing current and historical trends, our analysts predict where the market is headed over the next five years.

      It varies by segment for these categories geographically presented in the list of market tables. Speaking about this particular report we have conducted primary surveys (interviews) with the key level executives (VP, CEO’s, Marketing Director, Business Development Manager and many more) of the major players active in the market.

      Secondary Research

      Secondary research was mainly used to collect and identify information useful for the extensive, technical, market-oriented, and Friend’s study of the Global Extra Neutral Alcohol. It was also used to obtain key information about major players, market classification and segmentation according to the industry trends, geographical markets, and developments related to the market and technology perspectives. For this study, analysts have gathered information from various credible sources, such as annual reports, sec filings, journals, white papers, SOFT presentations, and company web sites.

      Market Size Estimation

      Both, top-down and bottom-up approaches were used to estimate and validate the size of the Global market and to estimate the size of various other dependent submarkets in the overall Extra Neutral Alcohol. The key players in the market were identified through secondary research and their market contributions in the respective geographies were determined through primary and secondary research.

      Forecast Model

      research-methodology2