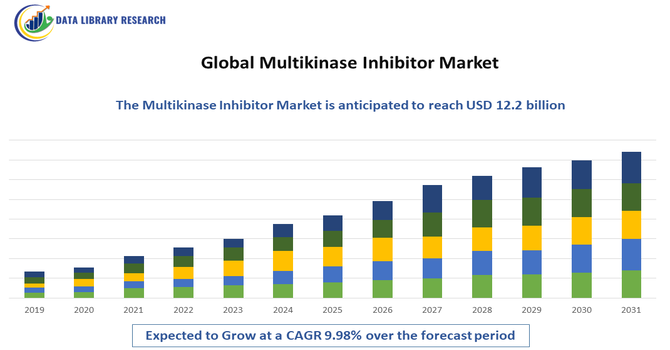
Multikinase Inhibitor Market Overview and Analysis:
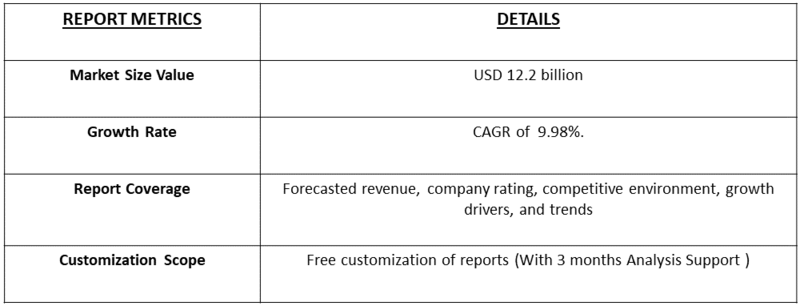
- The market is projected to grow from an estimated value of USD 7.18 billion in 2025 to approximately USD 12.2 billion by 2032, expanding at a Compound Annual Growth Rate (CAGR) of about 9.98%.
Get Complete Analysis Of The Report - Download Updated Free Sample PDF
The Global Multikinase Inhibitor Market is experiencing significant growth, driven by the increasing prevalence of various cancers and chronic diseases that involve dysregulated kinase signaling pathways. Multikinase inhibitors, which target multiple kinases simultaneously, offer enhanced therapeutic efficacy by interfering with tumor growth, angiogenesis, and metastasis. The rising adoption of personalized medicine and targeted therapies in oncology is further accelerating demand for these inhibitors. Additionally, ongoing advancements in drug design, development of next-generation multikinase inhibitors with improved selectivity and safety profiles, and expanding clinical trial pipelines are supporting market growth.
Multikinase Inhibitor Market Latest Trends:
The Global Multikinase Inhibitor Market is witnessing several notable trends that are shaping its growth and therapeutic applications. A key trend is the development of next-generation multikinase inhibitors with enhanced selectivity and reduced off-target effects, improving safety profiles for patients. There is also a growing emphasis on combination therapies, where multikinase inhibitors are paired with immunotherapies, chemotherapies, or other targeted agents to enhance efficacy and overcome drug resistance. Additionally, personalized medicine approaches are gaining traction, with biomarker-driven patient selection enabling more effective and tailored treatment strategies. Advances in oral formulations and extended-release technologies are improving patient adherence and convenience.
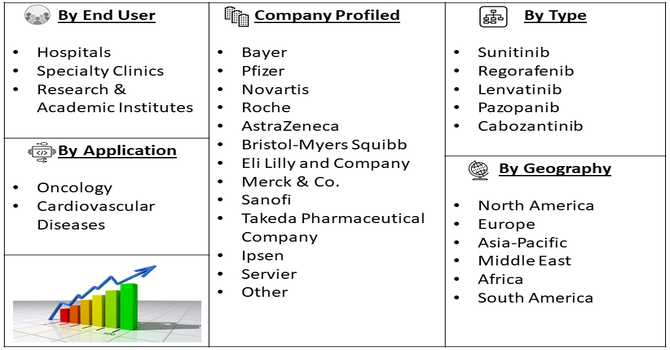
Segmentation: Global Multikinase Inhibitor Market is segmented By Drug Type (The market is divided into Sorafenib, Sunitinib, Regorafenib, Lenvatinib, Pazopanib, Cabozantinib), Application (Oncology, Cardiovascular Diseases), End User (Hospitals, Specialty Clinics, and Research & Academic Institutes), and Geography (North America, Europe, Asia-Pacific, Middle East and Africa, and South America). The report provides the value (in USD million) for the above segments.
For Detailed Market Segmentation - Get a Free Sample PDF
Market Drivers:
- Rising Prevalence of Cancer and Increasing Demand for Targeted Therapies
One of the primary drivers of the global multikinase inhibitor market is the rapidly increasing incidence of various cancers, such as liver, renal cell carcinoma, and thyroid cancers, which are the key therapeutic areas for multikinase inhibitors.
According to global cancer statistics, the number of cancer cases is expected to continue rising due to aging populations, changing lifestyles, and environmental factors. For instance, Globocan 2022 reported that there were an estimated 53,504,187 prevalent cancer cases worldwide-25,747,272 in males and 27,756,915 in females. Multikinase inhibitors, such as Sorafenib, Sunitinib, and Lenvatinib, offer targeted mechanisms of action that inhibit multiple signalling pathways responsible for tumor growth, angiogenesis, and metastasis.
- Increasing R&D Investments and Expansion of Drug Development Pipelines
Another key growth driver is the surge in research and development activities focused on discovering and developing next-generation multikinase inhibitors with improved efficacy and safety profiles. Leading pharmaceutical companies and biotechnology firms are investing heavily in oncology drug pipelines and engaging in strategic collaborations, mergers, and acquisitions to enhance their product portfolios. For instance, in May 2023, Zion Pharma Limited announced a global agreement with roche to develop and commercialize a blood-brain barrier (BBB) penetrant oral HER2 tyrosine kinase inhibitor, the drug has the potential to treat or prevent the onset of brain metastases in patients with HER2-positive metastatic breast cancer. This continuous innovation and supportive policy environment are expected to fuel the growth and diversification of the global multikinase inhibitor market in the coming years.
Market Restraints:
- High Cost of Treatment and Limited Affordability
The growth of the global multikinase inhibitor market is hindered by several challenges, primarily the high cost of treatment and limited affordability in developing regions. Multikinase inhibitors are often priced at premium levels due to complex manufacturing processes, high R&D expenses, and extended clinical trial requirements. This results in limited accessibility for patients in low- and middle-income countries, thereby restraining widespread adoption. Furthermore, adverse side effects and drug resistance pose significant clinical limitations.
Socio-Economic Impact on Multikinase Inhibitor Market
The Global Multikinase Inhibitor Market has a significant socioeconomic impact by enhancing access to targeted cancer therapies, which improve patient survival and quality of life. These inhibitors, used to treat various cancers, reduce hospitalizations and long-term healthcare costs, alleviating the financial burden on patients, families, and healthcare systems. The market also drives economic growth through pharmaceutical manufacturing, research and development, and job creation in healthcare and biotech sectors. By providing advanced, effective treatment options, multikinase inhibitors support workforce productivity and reduce societal losses associated with cancer-related morbidity and mortality. Additionally, wider availability of these therapies fosters healthcare equity, enabling broader access to life-saving treatments in both developed and emerging economies.
Segmental Analysis:
- Sorafenib segment is expected to witness the highest growth over the forecast period
Sorafenib holds a significant share in the global multikinase inhibitor market and continues to drive growth due to its proven efficacy in treating advanced hepatocellular carcinoma, renal cell carcinoma, and differentiated thyroid cancer. As one of the first approved oral multikinase inhibitors, Sorafenib inhibits multiple pathways associated with tumor cell proliferation and angiogenesis. Its established clinical safety profile, broad therapeutic use, and inclusion in multiple treatment guidelines have contributed to its strong market presence. Furthermore, ongoing research to explore combination therapies involving Sorafenib is expected to enhance its long-term clinical utility and maintain its dominance during the forecast period.
- Oncology segment is expected to witness the highest growth over the forecast period
The oncology segment dominates the market and is anticipated to exhibit robust growth over the forecast period, driven by the rising global cancer burden and the increasing demand for targeted therapies. Multikinase inhibitors have become a cornerstone in oncology due to their ability to interfere with multiple molecular targets involved in cancer progression. With growing awareness of personalized treatment approaches and the integration of biomarkers in therapy selection, their use in oncology continues to expand. Additionally, significant R&D investments and regulatory approvals for novel multikinase inhibitors in cancer treatment further strengthen this segment’s outlook.
- Hospitals segment is expected to witness the highest growth over the forecast period
The hospital segment accounts for the largest share of the market, supported by the high volume of cancer diagnoses and the availability of advanced treatment infrastructure. Hospitals remain the primary centers for administering multikinase inhibitor therapies due to their comprehensive oncology departments, skilled healthcare professionals, and patient monitoring capabilities. Increasing healthcare expenditure and the establishment of cancer specialty centers in both developed and emerging markets are enhancing patient access to advanced treatment options, thereby boosting this segment’s growth.
- North America segment is expected to witness the highest growth over the forecast period
North America is expected to witness the highest growth over the forecast period, driven by strong healthcare infrastructure, early adoption of innovative cancer therapies, and substantial R&D investments by pharmaceutical companies. For instance, In May 2025, PRISM BioLab, a biotechnology company specializing in small molecule inhibitors of protein-protein interactions, announced that Eisai Co. presented analysis from a combination study of E7386, developed in collaboration with PRISM, and Lenvatinib mesylate at the ASCO Congress 2025 in Chicago, held from May 30 to June 3. The study abstract was released the same day, highlighting advancements in targeted cancer therapy research.
Additionally, the high prevalence of cancer, growing patient awareness, and the presence of leading market players such as Pfizer, Bayer, and Eli Lilly further solidify North America’s leading position in the global multikinase inhibitor market. For instance, in 2025, American Cancer Society reported that, in 2022, around 20 million new cancer cases were diagnosed. By 2050, cases are projected to reach 35 million due to population growth. This rising cancer prevalence in the U.S. has heightened demand for affordable therapies, emphasizing the need for cost-effective treatment options to manage the expanding patient population.
Thus, such factors are driving the market growth in this region.
To Learn More About This Report - Request a Free Sample Copy
Multikinase Inhibitor Market Competitive Landscape:
The Global Multikinase Inhibitor Market is competitive and led by large pharmaceutical companies and specialist oncology firms that focus on innovation, clinical pipeline expansion, and strategic collaborations to develop next-generation multikinase therapies.
Key Players:
- Bayer
- Pfizer
- Novartis
- Roche
- AstraZeneca
- Bristol-Myers Squibb
- Eli Lilly and Company
- Merck & Co.
- Sanofi
- Takeda Pharmaceutical Company
- Ipsen
- Incyte Corporation
- Exelixis
- GlaxoSmithKline (GSK)
- Daiichi Sankyo
- Eisai
- Servier
- Janssen (Johnson & Johnson)
- Astellas Pharma
- Amgen
Recent Development
- In May 2025, Galmed Pharmaceuticals Ltd., a clinical-stage biopharmaceutical company focused on cardiometabolic and GI oncology therapies, announced that initial oncology studies demonstrated Aramchol enhanced the effects of Regorafenib, a liver and colorectal cancer-approved treatment. The combination showed improved efficacy in both in vitro and in vivo liver and colon cancer models, indicating potential for Aramchol to boost existing therapeutic outcomes in gastrointestinal oncology.
- In July 2024, Novartis launched Scemblix (asciminib), a novel kinase inhibitor targeting adults with newly diagnosed Philadelphia chromosome-positive chronic myeloid leukemia (Ph+ CML). This advanced therapy demonstrates enhanced molecular response rates in clinical trials, positioning it as a significant advancement in the kinase inhibitor industry.
Frequently Asked Questions (FAQ) :
Q1. What are the main growth-driving factors for this market?
The primary driver is the increasing global prevalence of cancers responsive to targeted therapy, such as renal cell carcinoma (kidney cancer) and liver cancer. Growth is also fueled by the extensive research and development pipeline, which continually introduces new, more selective MKI drugs with improved efficacy and fewer side effects. The shift toward personalized medicine, which relies on identifying specific genetic biomarkers, further boosts demand.
Q2. What are the main restraining factors for this market?
A key constraint is the extremely high cost of MKI drugs, which creates significant access barriers for patients in many healthcare systems globally. The market also struggles with the common issue of drug resistance, where tumors develop ways to bypass the inhibitor, requiring complex combination therapies. Furthermore, these drugs often come with significant adverse side effects that limit patient adherence and require rigorous monitoring.
Q3. Which segment is expected to witness high growth?
The Renal Cell Carcinoma (RCC) Segment is projected to witness the highest growth. MKIs are a foundational and highly effective treatment for advanced kidney cancer, often used in both first- and second-line settings. Driven by the consistent need for effective systemic therapy in this patient population, continued innovation and the expanding use of MKIs in combination regimens ensure this segment remains the largest and most dynamic area of the market.
Q4. Who are the top major players for this market?
The market is dominated by major global pharmaceutical companies with strong oncology portfolios. Top major players include Bayer AG (Nexavar), Novartis AG, Pfizer Inc., and Eisai Co., Ltd. Competition is intense and centers on developing next-generation MKIs that can overcome existing drug resistance mechanisms, demonstrate superior clinical survival benefits, and secure favorable reimbursement and pricing agreements across key global markets.
Q5. Which country is the largest player?
The United States is the largest country player by revenue. This dominance is due to its highest per-unit drug pricing and significant investment in cutting-edge targeted oncology treatments. The presence of major pharmaceutical R&D facilities, high patient access to expensive specialty drugs, and a large number of clinical trials involving MKIs firmly establish the U.S. as the primary revenue generator in this high-value market.
List of Figures
Figure 1: Global Multikinase Inhibitor Market Revenue Breakdown (USD Billion, %) by Region, 2022 & 2029
Figure 2: Global Multikinase Inhibitor Market Value Share (%), By Segment 1, 2022 & 2029
Figure 3: Global Multikinase Inhibitor Market Forecast (USD Billion), by Sub-Segment 1, 2018-2029
Figure 4: Global Multikinase Inhibitor Market Forecast (USD Billion), by Sub-Segment 2, 2018-2029
Figure 5: Global Multikinase Inhibitor Market Value Share (%), By Segment 2, 2022 & 2029
Figure 6: Global Multikinase Inhibitor Market Forecast (USD Billion), by Sub-Segment 1, 2018-2029
Figure 7: Global Multikinase Inhibitor Market Forecast (USD Billion), by Sub-Segment 2, 2018-2029
Figure 8: Global Multikinase Inhibitor Market Forecast (USD Billion), by Sub-Segment 3, 2018-2029
Figure 9: Global Multikinase Inhibitor Market Forecast (USD Billion), by Others, 2018-2029
Figure 10: Global Multikinase Inhibitor Market Value Share (%), By Segment 3, 2022 & 2029
Figure 11: Global Multikinase Inhibitor Market Forecast (USD Billion), by Sub-Segment 1, 2018-2029
Figure 12: Global Multikinase Inhibitor Market Forecast (USD Billion), by Sub-Segment 2, 2018-2029
Figure 13: Global Multikinase Inhibitor Market Forecast (USD Billion), by Sub-Segment 3, 2018-2029
Figure 14: Global Multikinase Inhibitor Market Forecast (USD Billion), by Others, 2018-2029
Figure 15: Global Multikinase Inhibitor Market Value (USD Billion), by Region, 2022 & 2029
Figure 16: North America Multikinase Inhibitor Market Value Share (%), By Segment 1, 2022 & 2029
Figure 17: North America Multikinase Inhibitor Market Forecast (USD Billion), by Sub-Segment 1, 2018-2029
Figure 18: North America Multikinase Inhibitor Market Forecast (USD Billion), by Sub-Segment 2, 2018-2029
Figure 19: North America Multikinase Inhibitor Market Value Share (%), By Segment 2, 2022 & 2029
Figure 20: North America Multikinase Inhibitor Market Forecast (USD Billion), by Sub-Segment 1, 2018-2029
Figure 21: North America Multikinase Inhibitor Market Forecast (USD Billion), by Sub-Segment 2, 2018-2029
Figure 22: North America Multikinase Inhibitor Market Forecast (USD Billion), by Sub-Segment 3, 2018-2029
Figure 23: North America Multikinase Inhibitor Market Forecast (USD Billion), by Others, 2018-2029
Figure 24: North America Multikinase Inhibitor Market Value Share (%), By Segment 3, 2022 & 2029
Figure 25: North America Multikinase Inhibitor Market Forecast (USD Billion), by Sub-Segment 1, 2018-2029
Figure 26: North America Multikinase Inhibitor Market Forecast (USD Billion), by Sub-Segment 2, 2018-2029
Figure 27: North America Multikinase Inhibitor Market Forecast (USD Billion), by Sub-Segment 3, 2018-2029
Figure 28: North America Multikinase Inhibitor Market Forecast (USD Billion), by Others, 2018-2029
Figure 29: North America Multikinase Inhibitor Market Forecast (USD Billion), by U.S., 2018-2029
Figure 30: North America Multikinase Inhibitor Market Forecast (USD Billion), by Canada, 2018-2029
Figure 31: Latin America Multikinase Inhibitor Market Value Share (%), By Segment 1, 2022 & 2029
Figure 32: Latin America Multikinase Inhibitor Market Forecast (USD Billion), by Sub-Segment 1, 2018-2029
Figure 33: Latin America Multikinase Inhibitor Market Forecast (USD Billion), by Sub-Segment 2, 2018-2029
Figure 34: Latin America Multikinase Inhibitor Market Value Share (%), By Segment 2, 2022 & 2029
Figure 35: Latin America Multikinase Inhibitor Market Forecast (USD Billion), by Sub-Segment 1, 2018-2029
Figure 36: Latin America Multikinase Inhibitor Market Forecast (USD Billion), by Sub-Segment 2, 2018-2029
Figure 37: Latin America Multikinase Inhibitor Market Forecast (USD Billion), by Sub-Segment 3, 2018-2029
Figure 38: Latin America Multikinase Inhibitor Market Forecast (USD Billion), by Others, 2018-2029
Figure 39: Latin America Multikinase Inhibitor Market Value Share (%), By Segment 3, 2022 & 2029
Figure 40: Latin America Multikinase Inhibitor Market Forecast (USD Billion), by Sub-Segment 1, 2018-2029
Figure 41: Latin America Multikinase Inhibitor Market Forecast (USD Billion), by Sub-Segment 2, 2018-2029
Figure 42: Latin America Multikinase Inhibitor Market Forecast (USD Billion), by Sub-Segment 3, 2018-2029
Figure 43: Latin America Multikinase Inhibitor Market Forecast (USD Billion), by Others, 2018-2029
Figure 44: Latin America Multikinase Inhibitor Market Forecast (USD Billion), by Brazil, 2018-2029
Figure 45: Latin America Multikinase Inhibitor Market Forecast (USD Billion), by Mexico, 2018-2029
Figure 46: Latin America Multikinase Inhibitor Market Forecast (USD Billion), by Rest of Latin America, 2018-2029
Figure 47: Europe Multikinase Inhibitor Market Value Share (%), By Segment 1, 2022 & 2029
Figure 48: Europe Multikinase Inhibitor Market Forecast (USD Billion), by Sub-Segment 1, 2018-2029
Figure 49: Europe Multikinase Inhibitor Market Forecast (USD Billion), by Sub-Segment 2, 2018-2029
Figure 50: Europe Multikinase Inhibitor Market Value Share (%), By Segment 2, 2022 & 2029
Figure 51: Europe Multikinase Inhibitor Market Forecast (USD Billion), by Sub-Segment 1, 2018-2029
Figure 52: Europe Multikinase Inhibitor Market Forecast (USD Billion), by Sub-Segment 2, 2018-2029
Figure 53: Europe Multikinase Inhibitor Market Forecast (USD Billion), by Sub-Segment 3, 2018-2029
Figure 54: Europe Multikinase Inhibitor Market Forecast (USD Billion), by Others, 2018-2029
Figure 55: Europe Multikinase Inhibitor Market Value Share (%), By Segment 3, 2022 & 2029
Figure 56: Europe Multikinase Inhibitor Market Forecast (USD Billion), by Sub-Segment 1, 2018-2029
Figure 57: Europe Multikinase Inhibitor Market Forecast (USD Billion), by Sub-Segment 2, 2018-2029
Figure 58: Europe Multikinase Inhibitor Market Forecast (USD Billion), by Sub-Segment 3, 2018-2029
Figure 59: Europe Multikinase Inhibitor Market Forecast (USD Billion), by Others, 2018-2029
Figure 60: Europe Multikinase Inhibitor Market Forecast (USD Billion), by U.K., 2018-2029
Figure 61: Europe Multikinase Inhibitor Market Forecast (USD Billion), by Germany, 2018-2029
Figure 62: Europe Multikinase Inhibitor Market Forecast (USD Billion), by France, 2018-2029
Figure 63: Europe Multikinase Inhibitor Market Forecast (USD Billion), by Italy, 2018-2029
Figure 64: Europe Multikinase Inhibitor Market Forecast (USD Billion), by Spain, 2018-2029
Figure 65: Europe Multikinase Inhibitor Market Forecast (USD Billion), by Russia, 2018-2029
Figure 66: Europe Multikinase Inhibitor Market Forecast (USD Billion), by Rest of Europe, 2018-2029
Figure 67: Asia Pacific Multikinase Inhibitor Market Value Share (%), By Segment 1, 2022 & 2029
Figure 68: Asia Pacific Multikinase Inhibitor Market Forecast (USD Billion), by Sub-Segment 1, 2018-2029
Figure 69: Asia Pacific Multikinase Inhibitor Market Forecast (USD Billion), by Sub-Segment 2, 2018-2029
Figure 70: Asia Pacific Multikinase Inhibitor Market Value Share (%), By Segment 2, 2022 & 2029
Figure 71: Asia Pacific Multikinase Inhibitor Market Forecast (USD Billion), by Sub-Segment 1, 2018-2029
Figure 72: Asia Pacific Multikinase Inhibitor Market Forecast (USD Billion), by Sub-Segment 2, 2018-2029
Figure 73: Asia Pacific Multikinase Inhibitor Market Forecast (USD Billion), by Sub-Segment 3, 2018-2029
Figure 74: Asia Pacific Multikinase Inhibitor Market Forecast (USD Billion), by Others, 2018-2029
Figure 75: Asia Pacific Multikinase Inhibitor Market Value Share (%), By Segment 3, 2022 & 2029
Figure 76: Asia Pacific Multikinase Inhibitor Market Forecast (USD Billion), by Sub-Segment 1, 2018-2029
Figure 77: Asia Pacific Multikinase Inhibitor Market Forecast (USD Billion), by Sub-Segment 2, 2018-2029
Figure 78: Asia Pacific Multikinase Inhibitor Market Forecast (USD Billion), by Sub-Segment 3, 2018-2029
Figure 79: Asia Pacific Multikinase Inhibitor Market Forecast (USD Billion), by Others, 2018-2029
Figure 80: Asia Pacific Multikinase Inhibitor Market Forecast (USD Billion), by China, 2018-2029
Figure 81: Asia Pacific Multikinase Inhibitor Market Forecast (USD Billion), by India, 2018-2029
Figure 82: Asia Pacific Multikinase Inhibitor Market Forecast (USD Billion), by Japan, 2018-2029
Figure 83: Asia Pacific Multikinase Inhibitor Market Forecast (USD Billion), by Australia, 2018-2029
Figure 84: Asia Pacific Multikinase Inhibitor Market Forecast (USD Billion), by Southeast Asia, 2018-2029
Figure 85: Asia Pacific Multikinase Inhibitor Market Forecast (USD Billion), by Rest of Asia Pacific, 2018-2029
Figure 86: Middle East & Africa Multikinase Inhibitor Market Value Share (%), By Segment 1, 2022 & 2029
Figure 87: Middle East & Africa Multikinase Inhibitor Market Forecast (USD Billion), by Sub-Segment 1, 2018-2029
Figure 88: Middle East & Africa Multikinase Inhibitor Market Forecast (USD Billion), by Sub-Segment 2, 2018-2029
Figure 89: Middle East & Africa Multikinase Inhibitor Market Value Share (%), By Segment 2, 2022 & 2029
Figure 90: Middle East & Africa Multikinase Inhibitor Market Forecast (USD Billion), by Sub-Segment 1, 2018-2029
Figure 91: Middle East & Africa Multikinase Inhibitor Market Forecast (USD Billion), by Sub-Segment 2, 2018-2029
Figure 92: Middle East & Africa Multikinase Inhibitor Market Forecast (USD Billion), by Sub-Segment 3, 2018-2029
Figure 93: Middle East & Africa Multikinase Inhibitor Market Forecast (USD Billion), by Others, 2018-2029
Figure 94: Middle East & Africa Multikinase Inhibitor Market Value Share (%), By Segment 3, 2022 & 2029
Figure 95: Middle East & Africa Multikinase Inhibitor Market Forecast (USD Billion), by Sub-Segment 1, 2018-2029
Figure 96: Middle East & Africa Multikinase Inhibitor Market Forecast (USD Billion), by Sub-Segment 2, 2018-2029
Figure 97: Middle East & Africa Multikinase Inhibitor Market Forecast (USD Billion), by Sub-Segment 3, 2018-2029
Figure 98: Middle East & Africa Multikinase Inhibitor Market Forecast (USD Billion), by Others, 2018-2029
Figure 99: Middle East & Africa Multikinase Inhibitor Market Forecast (USD Billion), by GCC, 2018-2029
Figure 100: Middle East & Africa Multikinase Inhibitor Market Forecast (USD Billion), by South Africa, 2018-2029
Figure 101: Middle East & Africa Multikinase Inhibitor Market Forecast (USD Billion), by Rest of Middle East & Africa, 2018-2029
List of Tables
Table 1: Global Multikinase Inhibitor Market Revenue (USD Billion) Forecast, by Segment 1, 2018-2029
Table 2: Global Multikinase Inhibitor Market Revenue (USD Billion) Forecast, by Segment 2, 2018-2029
Table 3: Global Multikinase Inhibitor Market Revenue (USD Billion) Forecast, by Segment 3, 2018-2029
Table 4: Global Multikinase Inhibitor Market Revenue (USD Billion) Forecast, by Region, 2018-2029
Table 5: North America Multikinase Inhibitor Market Revenue (USD Billion) Forecast, by Segment 1, 2018-2029
Table 6: North America Multikinase Inhibitor Market Revenue (USD Billion) Forecast, by Segment 2, 2018-2029
Table 7: North America Multikinase Inhibitor Market Revenue (USD Billion) Forecast, by Segment 3, 2018-2029
Table 8: North America Multikinase Inhibitor Market Revenue (USD Billion) Forecast, by Country, 2018-2029
Table 9: Europe Multikinase Inhibitor Market Revenue (USD Billion) Forecast, by Segment 1, 2018-2029
Table 10: Europe Multikinase Inhibitor Market Revenue (USD Billion) Forecast, by Segment 2, 2018-2029
Table 11: Europe Multikinase Inhibitor Market Revenue (USD Billion) Forecast, by Segment 3, 2018-2029
Table 12: Europe Multikinase Inhibitor Market Revenue (USD Billion) Forecast, by Country, 2018-2029
Table 13: Latin America Multikinase Inhibitor Market Revenue (USD Billion) Forecast, by Segment 1, 2018-2029
Table 14: Latin America Multikinase Inhibitor Market Revenue (USD Billion) Forecast, by Segment 2, 2018-2029
Table 15: Latin America Multikinase Inhibitor Market Revenue (USD Billion) Forecast, by Segment 3, 2018-2029
Table 16: Latin America Multikinase Inhibitor Market Revenue (USD Billion) Forecast, by Country, 2018-2029
Table 17: Asia Pacific Multikinase Inhibitor Market Revenue (USD Billion) Forecast, by Segment 1, 2018-2029
Table 18: Asia Pacific Multikinase Inhibitor Market Revenue (USD Billion) Forecast, by Segment 2, 2018-2029
Table 19: Asia Pacific Multikinase Inhibitor Market Revenue (USD Billion) Forecast, by Segment 3, 2018-2029
Table 20: Asia Pacific Multikinase Inhibitor Market Revenue (USD Billion) Forecast, by Country, 2018-2029
Table 21: Middle East & Africa Multikinase Inhibitor Market Revenue (USD Billion) Forecast, by Segment 1, 2018-2029
Table 22: Middle East & Africa Multikinase Inhibitor Market Revenue (USD Billion) Forecast, by Segment 2, 2018-2029
Table 23: Middle East & Africa Multikinase Inhibitor Market Revenue (USD Billion) Forecast, by Segment 3, 2018-2029
Table 24: Middle East & Africa Multikinase Inhibitor Market Revenue (USD Billion) Forecast, by Country, 2018-2029
Research Process
Data Library Research are conducted by industry experts who offer insight on
industry structure, market segmentations technology assessment and competitive landscape (CL), and penetration, as well as on emerging trends. Their analysis is based on primary interviews (~ 80%) and secondary research (~ 20%) as well as years of professional expertise in their respective industries. Adding to this, by analysing historical trends and current market positions, our analysts predict where the market will be headed for the next five years. Furthermore, the varying trends of segment & categories geographically presented are also studied and the estimated based on the primary & secondary research.
In this particular report from the supply side Data Library Research has conducted primary surveys (interviews) with the key level executives (VP, CEO’s, Marketing Director, Business Development Manager
and SOFT) of the companies that active & prominent as well as the midsized organization
FIGURE 1: DLR RESEARH PROCESS
![research-methodology1]()
Primary Research
Extensive primary research was conducted to gain a deeper insight of the market and industry performance. The analysis is based on both primary and secondary research as well as years of professional expertise in the respective industries.
In addition to analysing current and historical trends, our analysts predict where the market is headed over the next five years.
It varies by segment for these categories geographically presented in the list of market tables. Speaking about this particular report we have conducted primary surveys (interviews) with the key level executives (VP, CEO’s, Marketing Director, Business Development Manager and many more) of the major players active in the market.
Secondary Research
Secondary research was mainly used to collect and identify information useful for the extensive, technical, market-oriented, and Friend’s study of the Global Extra Neutral Alcohol. It was also used to obtain key information about major players, market classification and segmentation according to the industry trends, geographical markets, and developments related to the market and technology perspectives. For this study, analysts have gathered information from various credible sources, such as annual reports, sec filings, journals, white papers, SOFT presentations, and company web sites.
Market Size Estimation
Both, top-down and bottom-up approaches were used to estimate and validate the size of the Global market and to estimate the size of various other dependent submarkets in the overall Extra Neutral Alcohol. The key players in the market were identified through secondary research and their market contributions in the respective geographies were determined through primary and secondary research.
Forecast Model
![research-methodology2]()