Multiple Sclerosis Therapeutic Market Overview and Analysis
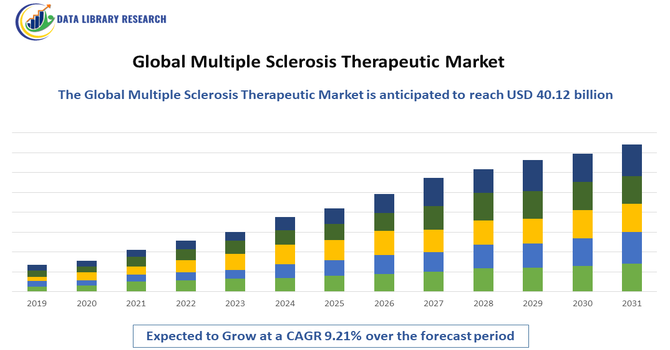
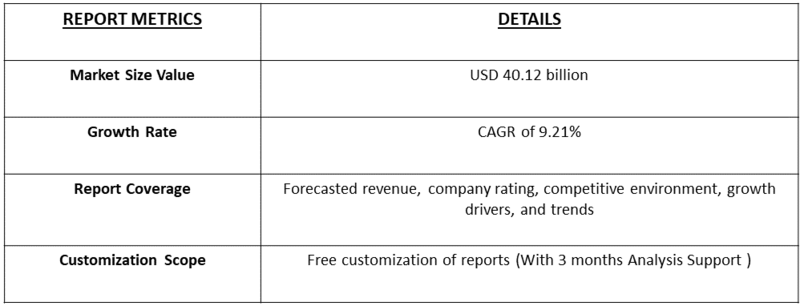
- The global multiple sclerosis therapeutic market size was estimated at USD 26.5 billion in 2026 and is projected to reach USD 40.12 billion by 2033, growing with a CAGR of 9.21% from 2026-2033.
Get Complete Analysis Of The Report - Download Updated Free Sample PDF
The Global Multiple Sclerosis (MS) Therapeutic Market represents the worldwide efforts to treat and manage multiple sclerosis, a long-term condition that affects the brain and spinal cord. This market includes medicines that help slow disease progression, reduce flare-ups, and manage symptoms, allowing patients to maintain a better quality of life. It is driven by growing awareness of MS, improved diagnosis, and continuous innovation in drug research, including oral therapies and biologics. Pharmaceutical companies, healthcare providers, and research organizations play a key role.
Multiple Sclerosis Therapeutic Market Latest Trends
The Global Multiple Sclerosis (MS) Therapeutic Market is experiencing steady transformation driven by scientific innovation and evolving treatment paradigms. A notable trend is the transition from injectable therapies toward high-efficacy oral and infusion-based treatments that enhance patient adherence and clinical outcomes. Advances in biologics, monoclonal antibodies, and precision medicine are enabling more targeted disease management. Improved diagnostic tools and earlier disease identification are expanding the treated patient population. In parallel, digital health solutions and remote patient monitoring are supporting long-term disease management.
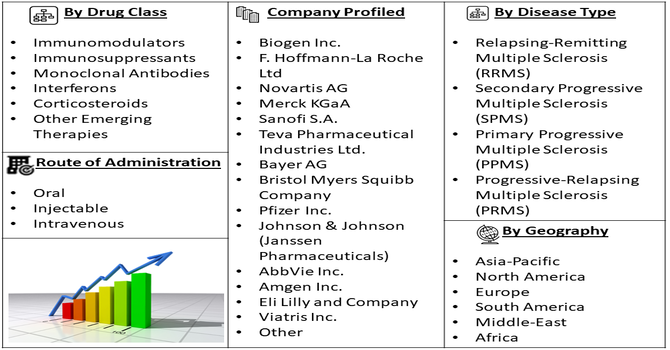
Segmentation: The Global Multiple Sclerosis (MS) Therapeutic Market is segmented by Drug Class (Immunomodulators, Immunosuppressants, Monoclonal Antibodies, Interferons, Corticosteroids and Other Emerging Therapies), Disease Type (Relapsing-Remitting Multiple Sclerosis (RRMS), Secondary Progressive Multiple Sclerosis (SPMS), Primary Progressive Multiple Sclerosis (PPMS) and Progressive-Relapsing Multiple Sclerosis (PRMS)), Route of Administration (Oral, Injectable and Intravenous), and Geography (North America, Europe, Asia-Pacific, Middle East and Africa, and South America). The report provides the value (in USD million) for the above segments.
For Detailed Market Segmentation - Get a Free Sample PDF
Market Drivers:
- Rising Prevalence and Improved Diagnosis
The increasing global prevalence of multiple sclerosis is a primary driver of the MS therapeutic market. For instance, WHO, reported that Multiple Sclerosis (MS) affects over 2.8 million people globally.
Greater awareness among healthcare professionals and patients, combined with improved access to advanced diagnostic tools such as MRI and biomarker-based testing, has led to earlier and more accurate diagnosis. Early identification expands the eligible patient population for disease-modifying therapies and long-term treatment plans. In addition, improved survival rates and longer disease duration have increased the demand for sustained therapeutic management. Together, these factors are driving consistent growth in treatment adoption and encouraging pharmaceutical companies to expand and diversify their MS product portfolios.
- Innovation in Disease-Modifying Therapies
Continuous innovation in disease-modifying therapies (DMTs) is significantly accelerating market growth. Pharmaceutical companies are investing heavily in research and development to introduce high-efficacy therapies, including monoclonal antibodies, oral agents, and targeted immunotherapies. These advanced treatments offer improved clinical outcomes, reduced relapse rates, and enhanced patient convenience compared to traditional injectables.
Regulatory approvals of novel therapies and expanding clinical pipelines are strengthening market momentum, while ongoing innovation continues to improve quality of life for individuals living with multiple sclerosis. For instance, in 2024, Roche Pharma India launched Ocrevus (Ocrelizumab) for multiple sclerosis, expanding its neurology portfolio and addressing unmet patient needs. Approved for RRMS and PPMS, it demonstrated over 10 years of clinical and real-world data, showing reduced disability progression and delayed disease advancement. The launch strengthened Roche’s global presence, reinforced its leadership in high-efficacy MS therapies, increased clinician confidence and patient adoption, and supported growth in the global MS therapeutic market.
Market Restraints:
- High Treatment Costs and Limited Access
High treatment costs remain a significant restraint in the global MS therapeutic market. Many advanced disease-modifying therapies are expensive, placing a substantial financial burden on patients, healthcare systems, and insurers. In low- and middle-income regions, limited reimbursement coverage and inadequate healthcare infrastructure further restrict access to effective treatments. These cost-related barriers contribute to disparities in treatment availability and outcomes across regions. Additionally, long-term therapy requirements increase cumulative expenses, discouraging sustained adherence. Addressing affordability, expanding reimbursement frameworks, and improving healthcare access are critical challenges that must be resolved to ensure broader and more equitable market growth.
Socioeconomic Impact on Multiple Sclerosis Therapeutic Market
Multiple sclerosis imposes a significant socioeconomic burden, affecting patients, caregivers, employers, and healthcare systems. As MS commonly manifests during prime working years, it contributes to reduced workforce participation, productivity losses, and increased disability-related costs. Effective therapeutic interventions can mitigate disease progression, thereby lowering long-term healthcare expenditures and reducing reliance on social support services. However, the high cost of advanced MS therapies continues to limit access in developing regions, exacerbating health inequities. From a broader economic perspective, timely diagnosis and access to effective treatments can improve patient independence, enhance quality of life, and generate long-term economic benefits through sustained employment and reduced caregiving demands.
Segmental Analysis:
- Immunosuppressants segment is expected to witness the highest growth over the forecast period
The immunosuppressants segment is expected to witness the highest growth over the forecast period due to their increasing effectiveness in treating moderate to severe multiple sclerosis cases. These therapies help control abnormal immune responses responsible for nerve damage, making them particularly valuable in progressive and treatment-resistant forms of MS. Growing clinical evidence supporting their long-term efficacy, along with continued drug approvals and expanded therapeutic indications, is accelerating adoption. Additionally, advancements in formulation and dosing strategies have improved safety and tolerability profiles. Rising physician preference for high-efficacy treatments and increasing patient awareness are further contributing to the strong growth outlook of the immunosuppressants segment.
- Relapsing-Remitting Multiple Sclerosis (RRMS) segment is expected to witness highest growth over the forecast period
The Relapsing-Remitting Multiple Sclerosis (RRMS) segment is expected to witness the highest growth over the forecast period, as it represents the most commonly diagnosed form of MS globally. Early diagnosis and timely initiation of disease-modifying therapies have significantly improved disease management in RRMS patients. The availability of a broad range of treatment options, including oral, injectable, and infusion therapies, supports strong adoption. Ongoing clinical research focused on reducing relapse frequency and delaying disease progression further fuels growth. Increased patient awareness and proactive treatment approaches continue to drive expansion within the RRMS segment.
- Injectable segment is expected to witness the highest growth over the forecast period
The injectable segment is expected to witness the highest growth over the forecast period due to its established clinical effectiveness and long-standing use in MS management. Injectable therapies, such as interferons and monoclonal antibodies, remain widely prescribed owing to their proven safety profiles and consistent therapeutic outcomes. Many healthcare providers continue to prefer injectables for patients requiring controlled dosing and close clinical monitoring. Additionally, the introduction of improved formulations with reduced injection frequency and enhanced tolerability is supporting sustained demand. Strong physician familiarity and patient trust in injectable treatments contribute to the segment’s continued growth.
- North American Region is expected to witness the highest growth over the forecast period
North America is expected to witness the highest growth over the forecast period due to its advanced healthcare infrastructure and strong focus on neurological disease management. High disease awareness, early diagnosis rates, and broad access to innovative MS therapies support market expansion in the region.
Favorable reimbursement policies and significant investments in research and development further enhance treatment adoption. For instance, United Healthcare began reimbursing the PoNS device, which uses electrical stimulation to improve walking in multiple sclerosis patients, covering approximately USD 18,100 including patient copay. United became the second major insurer, following Anthem, to provide coverage, enhancing patient access to this novel therapy developed by Helius Medical Technologies. The reimbursement approval encouraged broader adoption of the PoNS device, signaling favorable payer policies and attracting investment in innovative MS therapies. It supported growth in the US multiple sclerosis therapeutic market by improving patient access to advanced neurostimulation treatments, increasing clinician confidence, and promoting further development of high-cost, high-efficacy interventions for MS management.
The presence of leading pharmaceutical companies and ongoing clinical trials also contribute to rapid introduction of novel therapies. For instance, in 2025, Contineum Therapeutics, Inc. reported Phase 2 VISTA trial topline results for PIPE-307, an M1 receptor antagonist for RRMS. The data demonstrated potential to improve disease management, generated anticipation for innovative therapies, and supported the adoption of advanced treatments, driving investment and growth in US’s relapsing-remitting multiple sclerosis therapeutic market. Thus, these factors position North America as a key growth driver in the global MS therapeutic market.
To Learn More About This Report - Request a Free Sample Copy
Multiple Sclerosis Therapeutic Market Competitive Landscape
The competitive landscape of the Global MS Therapeutic Market is characterized by intense competition and sustained investment in research and development. Leading pharmaceutical companies focus on expanding their portfolios through innovative disease-modifying therapies, biologics, and next-generation immunomodulators. Strategic initiatives such as mergers, acquisitions, partnerships, and licensing agreements are widely adopted to strengthen product pipelines and global market presence. As patent expirations and new product launches reshape market dynamics, competition is expected to intensify, emphasizing innovation, regulatory success, and market access capabilities.
The major players for this market are:
- Biogen Inc.
- F. Hoffmann-La Roche Ltd
- Novartis AG
- Merck KGaA
- Sanofi S.A.
- Teva Pharmaceutical Industries Ltd.
- Bayer AG
- Bristol Myers Squibb Company
- Pfizer Inc.
- Johnson & Johnson (Janssen Pharmaceuticals)
- AbbVie Inc.
- Amgen Inc.
- Eli Lilly and Company
- Viatris Inc.
- TG Therapeutics, Inc.
- Horizon Therapeutics plc
- Acorda Therapeutics, Inc.
- Mallinckrodt Pharmaceuticals
- GeNeuro SA
- Opexa Therapeutics, Inc.
Recent Development
- In September 2025, Kyverna Therapeutics, Inc. (Nasdaq: KYTX), a clinical-stage biopharmaceutical company focused on cell therapies for autoimmune diseases, announced updated Phase 1 investigator-initiated trial data for KYV-101 in progressive multiple sclerosis. Presented at the 2025 ECTRIMS Congress by Stanford Medicine and UCSF, the positive results highlighted the therapy’s potential to expand treatment options, stimulate investment, and drive growth in the global MS therapeutic market, particularly within high-efficacy and advanced therapy segments.
- In September 2025, TG Therapeutics, Inc. presented updated six-year ULTIMATE I & II Phase 3 trial data for BRIUMVI® (ublituximab-xiiy) in relapsing multiple sclerosis at the 2025 ECTRIMS meeting with partner Neuraxpharm. The data confirmed long-term efficacy and safety, strengthened its competitive position, increased clinician and investor confidence, and supported adoption, market share growth, and expansion in the global high-efficacy MS therapeutic market.
Frequently Asked Questions (FAQ) :
Q1. What are the main growth-driving factors for this market?
The market is growing because of a rising global prevalence of Multiple Sclerosis and earlier diagnosis through advanced imaging. There is a strong shift toward "Disease-Modifying Therapies" (DMTs) that help slow disability. Additionally, increased government funding for autoimmune research and the development of more convenient oral and injectable drugs are fueling growth.
Q2. What are the main restraining factors for this market?
Growth is limited by the incredibly high cost of long-term treatments, which many patients cannot afford without extensive insurance. Severe side effects of some powerful therapies, such as a weakened immune system, can also deter use. Furthermore, the entry of cheaper "biosimilars" as patents for major blockbuster drugs expire reduces overall revenue.
Q3. Which segment is expected to witness high growth?
The immunosuppressants segment is expected to witness the highest growth over the forecast period due to their increasing use in managing aggressive and progressive forms of multiple sclerosis. Their ability to effectively reduce immune-mediated damage, along with ongoing clinical advancements and expanding indications, is driving strong adoption across global markets.
Q4. Who are the top major players for this market?
The market is led by global pharmaceutical giants specializing in neurology and immunology. Key players include Biogen, Novartis, Roche (Genentech), Sanofi, and Merck KGaA. These companies dominate by holding patents on the most effective Disease-Modifying Therapies and investing billions in clinical trials to discover a potential cure for the disease.
Q5. Which country is the largest player?
The United States is the largest player in the Multiple Sclerosis therapeutic market. This is due to its advanced healthcare infrastructure, high awareness of neurological disorders, and early access to the latest FDA-approved drugs. The U.S. also has the highest per-capita spending on specialty medications, keeping it at the global forefront.
List of Figures
Figure 1: Global Multiple Sclerosis Therapeutic Market Revenue Breakdown (USD Billion, %) by Region, 2019 & 2027
Figure 2: Global Multiple Sclerosis Therapeutic Market Value Share (%), By Segment 1, 2019 & 2027
Figure 3: Global Multiple Sclerosis Therapeutic Market Forecast (USD Billion), by Sub-Segment 1, 2016-2027
Figure 4: Global Multiple Sclerosis Therapeutic Market Forecast (USD Billion), by Sub-Segment 2, 2016-2027
Figure 5: Global Multiple Sclerosis Therapeutic Market Value Share (%), By Segment 2, 2019 & 2027
Figure 6: Global Multiple Sclerosis Therapeutic Market Forecast (USD Billion), by Sub-Segment 1, 2016-2027
Figure 7: Global Multiple Sclerosis Therapeutic Market Forecast (USD Billion), by Sub-Segment 2, 2016-2027
Figure 8: Global Multiple Sclerosis Therapeutic Market Forecast (USD Billion), by Sub-Segment 3, 2016-2027
Figure 9: Global Multiple Sclerosis Therapeutic Market Forecast (USD Billion), by Others, 2016-2027
Figure 10: Global Multiple Sclerosis Therapeutic Market Value Share (%), By Segment 3, 2019 & 2027
Figure 11: Global Multiple Sclerosis Therapeutic Market Forecast (USD Billion), by Sub-Segment 1, 2016-2027
Figure 12: Global Multiple Sclerosis Therapeutic Market Forecast (USD Billion), by Sub-Segment 2, 2016-2027
Figure 13: Global Multiple Sclerosis Therapeutic Market Forecast (USD Billion), by Sub-Segment 3, 2016-2027
Figure 14: Global Multiple Sclerosis Therapeutic Market Forecast (USD Billion), by Others, 2016-2027
Figure 15: Global Multiple Sclerosis Therapeutic Market Value (USD Billion), by Region, 2019 & 2027
Figure 16: North America Multiple Sclerosis Therapeutic Market Value Share (%), By Segment 1, 2019 & 2027
Figure 17: North America Multiple Sclerosis Therapeutic Market Forecast (USD Billion), by Sub-Segment 1, 2016-2027
Figure 18: North America Multiple Sclerosis Therapeutic Market Forecast (USD Billion), by Sub-Segment 2, 2016-2027
Figure 19: North America Multiple Sclerosis Therapeutic Market Value Share (%), By Segment 2, 2019 & 2027
Figure 20: North America Multiple Sclerosis Therapeutic Market Forecast (USD Billion), by Sub-Segment 1, 2016-2027
Figure 21: North America Multiple Sclerosis Therapeutic Market Forecast (USD Billion), by Sub-Segment 2, 2016-2027
Figure 22: North America Multiple Sclerosis Therapeutic Market Forecast (USD Billion), by Sub-Segment 3, 2016-2027
Figure 23: North America Multiple Sclerosis Therapeutic Market Forecast (USD Billion), by Others, 2016-2027
Figure 24: North America Multiple Sclerosis Therapeutic Market Value Share (%), By Segment 3, 2019 & 2027
Figure 25: North America Multiple Sclerosis Therapeutic Market Forecast (USD Billion), by Sub-Segment 1, 2016-2027
Figure 26: North America Multiple Sclerosis Therapeutic Market Forecast (USD Billion), by Sub-Segment 2, 2016-2027
Figure 27: North America Multiple Sclerosis Therapeutic Market Forecast (USD Billion), by Sub-Segment 3, 2016-2027
Figure 28: North America Multiple Sclerosis Therapeutic Market Forecast (USD Billion), by Others, 2016-2027
Figure 29: North America Multiple Sclerosis Therapeutic Market Forecast (USD Billion), by U.S., 2016-2027
Figure 30: North America Multiple Sclerosis Therapeutic Market Forecast (USD Billion), by Canada, 2016-2027
Figure 31: Latin America Multiple Sclerosis Therapeutic Market Value Share (%), By Segment 1, 2019 & 2027
Figure 32: Latin America Multiple Sclerosis Therapeutic Market Forecast (USD Billion), by Sub-Segment 1, 2016-2027
Figure 33: Latin America Multiple Sclerosis Therapeutic Market Forecast (USD Billion), by Sub-Segment 2, 2016-2027
Figure 34: Latin America Multiple Sclerosis Therapeutic Market Value Share (%), By Segment 2, 2019 & 2027
Figure 35: Latin America Multiple Sclerosis Therapeutic Market Forecast (USD Billion), by Sub-Segment 1, 2016-2027
Figure 36: Latin America Multiple Sclerosis Therapeutic Market Forecast (USD Billion), by Sub-Segment 2, 2016-2027
Figure 37: Latin America Multiple Sclerosis Therapeutic Market Forecast (USD Billion), by Sub-Segment 3, 2016-2027
Figure 38: Latin America Multiple Sclerosis Therapeutic Market Forecast (USD Billion), by Others, 2016-2027
Figure 39: Latin America Multiple Sclerosis Therapeutic Market Value Share (%), By Segment 3, 2019 & 2027
Figure 40: Latin America Multiple Sclerosis Therapeutic Market Forecast (USD Billion), by Sub-Segment 1, 2016-2027
Figure 41: Latin America Multiple Sclerosis Therapeutic Market Forecast (USD Billion), by Sub-Segment 2, 2016-2027
Figure 42: Latin America Multiple Sclerosis Therapeutic Market Forecast (USD Billion), by Sub-Segment 3, 2016-2027
Figure 43: Latin America Multiple Sclerosis Therapeutic Market Forecast (USD Billion), by Others, 2016-2027
Figure 44: Latin America Multiple Sclerosis Therapeutic Market Forecast (USD Billion), by Brazil, 2016-2027
Figure 45: Latin America Multiple Sclerosis Therapeutic Market Forecast (USD Billion), by Mexico, 2016-2027
Figure 46: Latin America Multiple Sclerosis Therapeutic Market Forecast (USD Billion), by Rest of Latin America, 2016-2027
Figure 47: Europe Multiple Sclerosis Therapeutic Market Value Share (%), By Segment 1, 2019 & 2027
Figure 48: Europe Multiple Sclerosis Therapeutic Market Forecast (USD Billion), by Sub-Segment 1, 2016-2027
Figure 49: Europe Multiple Sclerosis Therapeutic Market Forecast (USD Billion), by Sub-Segment 2, 2016-2027
Figure 50: Europe Multiple Sclerosis Therapeutic Market Value Share (%), By Segment 2, 2019 & 2027
Figure 51: Europe Multiple Sclerosis Therapeutic Market Forecast (USD Billion), by Sub-Segment 1, 2016-2027
Figure 52: Europe Multiple Sclerosis Therapeutic Market Forecast (USD Billion), by Sub-Segment 2, 2016-2027
Figure 53: Europe Multiple Sclerosis Therapeutic Market Forecast (USD Billion), by Sub-Segment 3, 2016-2027
Figure 54: Europe Multiple Sclerosis Therapeutic Market Forecast (USD Billion), by Others, 2016-2027
Figure 55: Europe Multiple Sclerosis Therapeutic Market Value Share (%), By Segment 3, 2019 & 2027
Figure 56: Europe Multiple Sclerosis Therapeutic Market Forecast (USD Billion), by Sub-Segment 1, 2016-2027
Figure 57: Europe Multiple Sclerosis Therapeutic Market Forecast (USD Billion), by Sub-Segment 2, 2016-2027
Figure 58: Europe Multiple Sclerosis Therapeutic Market Forecast (USD Billion), by Sub-Segment 3, 2016-2027
Figure 59: Europe Multiple Sclerosis Therapeutic Market Forecast (USD Billion), by Others, 2016-2027
Figure 60: Europe Multiple Sclerosis Therapeutic Market Forecast (USD Billion), by U.K., 2016-2027
Figure 61: Europe Multiple Sclerosis Therapeutic Market Forecast (USD Billion), by Germany, 2016-2027
Figure 62: Europe Multiple Sclerosis Therapeutic Market Forecast (USD Billion), by France, 2016-2027
Figure 63: Europe Multiple Sclerosis Therapeutic Market Forecast (USD Billion), by Italy, 2016-2027
Figure 64: Europe Multiple Sclerosis Therapeutic Market Forecast (USD Billion), by Spain, 2016-2027
Figure 65: Europe Multiple Sclerosis Therapeutic Market Forecast (USD Billion), by Russia, 2016-2027
Figure 66: Europe Multiple Sclerosis Therapeutic Market Forecast (USD Billion), by Rest of Europe, 2016-2027
Figure 67: Asia Pacific Multiple Sclerosis Therapeutic Market Value Share (%), By Segment 1, 2019 & 2027
Figure 68: Asia Pacific Multiple Sclerosis Therapeutic Market Forecast (USD Billion), by Sub-Segment 1, 2016-2027
Figure 69: Asia Pacific Multiple Sclerosis Therapeutic Market Forecast (USD Billion), by Sub-Segment 2, 2016-2027
Figure 70: Asia Pacific Multiple Sclerosis Therapeutic Market Value Share (%), By Segment 2, 2019 & 2027
Figure 71: Asia Pacific Multiple Sclerosis Therapeutic Market Forecast (USD Billion), by Sub-Segment 1, 2016-2027
Figure 72: Asia Pacific Multiple Sclerosis Therapeutic Market Forecast (USD Billion), by Sub-Segment 2, 2016-2027
Figure 73: Asia Pacific Multiple Sclerosis Therapeutic Market Forecast (USD Billion), by Sub-Segment 3, 2016-2027
Figure 74: Asia Pacific Multiple Sclerosis Therapeutic Market Forecast (USD Billion), by Others, 2016-2027
Figure 75: Asia Pacific Multiple Sclerosis Therapeutic Market Value Share (%), By Segment 3, 2019 & 2027
Figure 76: Asia Pacific Multiple Sclerosis Therapeutic Market Forecast (USD Billion), by Sub-Segment 1, 2016-2027
Figure 77: Asia Pacific Multiple Sclerosis Therapeutic Market Forecast (USD Billion), by Sub-Segment 2, 2016-2027
Figure 78: Asia Pacific Multiple Sclerosis Therapeutic Market Forecast (USD Billion), by Sub-Segment 3, 2016-2027
Figure 79: Asia Pacific Multiple Sclerosis Therapeutic Market Forecast (USD Billion), by Others, 2016-2027
Figure 80: Asia Pacific Multiple Sclerosis Therapeutic Market Forecast (USD Billion), by China, 2016-2027
Figure 81: Asia Pacific Multiple Sclerosis Therapeutic Market Forecast (USD Billion), by India, 2016-2027
Figure 82: Asia Pacific Multiple Sclerosis Therapeutic Market Forecast (USD Billion), by Japan, 2016-2027
Figure 83: Asia Pacific Multiple Sclerosis Therapeutic Market Forecast (USD Billion), by Australia, 2016-2027
Figure 84: Asia Pacific Multiple Sclerosis Therapeutic Market Forecast (USD Billion), by Southeast Asia, 2016-2027
Figure 85: Asia Pacific Multiple Sclerosis Therapeutic Market Forecast (USD Billion), by Rest of Asia Pacific, 2016-2027
Figure 86: Middle East & Africa Multiple Sclerosis Therapeutic Market Value Share (%), By Segment 1, 2019 & 2027
Figure 87: Middle East & Africa Multiple Sclerosis Therapeutic Market Forecast (USD Billion), by Sub-Segment 1, 2016-2027
Figure 88: Middle East & Africa Multiple Sclerosis Therapeutic Market Forecast (USD Billion), by Sub-Segment 2, 2016-2027
Figure 89: Middle East & Africa Multiple Sclerosis Therapeutic Market Value Share (%), By Segment 2, 2019 & 2027
Figure 90: Middle East & Africa Multiple Sclerosis Therapeutic Market Forecast (USD Billion), by Sub-Segment 1, 2016-2027
Figure 91: Middle East & Africa Multiple Sclerosis Therapeutic Market Forecast (USD Billion), by Sub-Segment 2, 2016-2027
Figure 92: Middle East & Africa Multiple Sclerosis Therapeutic Market Forecast (USD Billion), by Sub-Segment 3, 2016-2027
Figure 93: Middle East & Africa Multiple Sclerosis Therapeutic Market Forecast (USD Billion), by Others, 2016-2027
Figure 94: Middle East & Africa Multiple Sclerosis Therapeutic Market Value Share (%), By Segment 3, 2019 & 2027
Figure 95: Middle East & Africa Multiple Sclerosis Therapeutic Market Forecast (USD Billion), by Sub-Segment 1, 2016-2027
Figure 96: Middle East & Africa Multiple Sclerosis Therapeutic Market Forecast (USD Billion), by Sub-Segment 2, 2016-2027
Figure 97: Middle East & Africa Multiple Sclerosis Therapeutic Market Forecast (USD Billion), by Sub-Segment 3, 2016-2027
Figure 98: Middle East & Africa Multiple Sclerosis Therapeutic Market Forecast (USD Billion), by Others, 2016-2027
Figure 99: Middle East & Africa Multiple Sclerosis Therapeutic Market Forecast (USD Billion), by GCC, 2016-2027
Figure 100: Middle East & Africa Multiple Sclerosis Therapeutic Market Forecast (USD Billion), by South Africa, 2016-2027
Figure 101: Middle East & Africa Multiple Sclerosis Therapeutic Market Forecast (USD Billion), by Rest of Middle East & Africa, 2016-2027
List of Tables
Table 1: Global Multiple Sclerosis Therapeutic Market Revenue (USD Billion) Forecast, by Segment 1, 2016-2027
Table 2: Global Multiple Sclerosis Therapeutic Market Revenue (USD Billion) Forecast, by Segment 2, 2016-2027
Table 3: Global Multiple Sclerosis Therapeutic Market Revenue (USD Billion) Forecast, by Segment 3, 2016-2027
Table 4: Global Multiple Sclerosis Therapeutic Market Revenue (USD Billion) Forecast, by Region, 2016-2027
Table 5: North America Multiple Sclerosis Therapeutic Market Revenue (USD Billion) Forecast, by Segment 1, 2016-2027
Table 6: North America Multiple Sclerosis Therapeutic Market Revenue (USD Billion) Forecast, by Segment 2, 2016-2027
Table 7: North America Multiple Sclerosis Therapeutic Market Revenue (USD Billion) Forecast, by Segment 3, 2016-2027
Table 8: North America Multiple Sclerosis Therapeutic Market Revenue (USD Billion) Forecast, by Country, 2016-2027
Table 9: Europe Multiple Sclerosis Therapeutic Market Revenue (USD Billion) Forecast, by Segment 1, 2016-2027
Table 10: Europe Multiple Sclerosis Therapeutic Market Revenue (USD Billion) Forecast, by Segment 2, 2016-2027
Table 11: Europe Multiple Sclerosis Therapeutic Market Revenue (USD Billion) Forecast, by Segment 3, 2016-2027
Table 12: Europe Multiple Sclerosis Therapeutic Market Revenue (USD Billion) Forecast, by Country, 2016-2027
Table 13: Latin America Multiple Sclerosis Therapeutic Market Revenue (USD Billion) Forecast, by Segment 1, 2016-2027
Table 14: Latin America Multiple Sclerosis Therapeutic Market Revenue (USD Billion) Forecast, by Segment 2, 2016-2027
Table 15: Latin America Multiple Sclerosis Therapeutic Market Revenue (USD Billion) Forecast, by Segment 3, 2016-2027
Table 16: Latin America Multiple Sclerosis Therapeutic Market Revenue (USD Billion) Forecast, by Country, 2016-2027
Table 17: Asia Pacific Multiple Sclerosis Therapeutic Market Revenue (USD Billion) Forecast, by Segment 1, 2016-2027
Table 18: Asia Pacific Multiple Sclerosis Therapeutic Market Revenue (USD Billion) Forecast, by Segment 2, 2016-2027
Table 19: Asia Pacific Multiple Sclerosis Therapeutic Market Revenue (USD Billion) Forecast, by Segment 3, 2016-2027
Table 20: Asia Pacific Multiple Sclerosis Therapeutic Market Revenue (USD Billion) Forecast, by Country, 2016-2027
Table 21: Middle East & Africa Multiple Sclerosis Therapeutic Market Revenue (USD Billion) Forecast, by Segment 1, 2016-2027
Table 22: Middle East & Africa Multiple Sclerosis Therapeutic Market Revenue (USD Billion) Forecast, by Segment 2, 2016-2027
Table 23: Middle East & Africa Multiple Sclerosis Therapeutic Market Revenue (USD Billion) Forecast, by Segment 3, 2016-2027
Table 24: Middle East & Africa Multiple Sclerosis Therapeutic Market Revenue (USD Billion) Forecast, by Country, 2016-2027
Research Process
Data Library Research are conducted by industry experts who offer insight on
industry structure, market segmentations technology assessment and competitive landscape (CL), and penetration, as well as on emerging trends. Their analysis is based on primary interviews (~ 80%) and secondary research (~ 20%) as well as years of professional expertise in their respective industries. Adding to this, by analysing historical trends and current market positions, our analysts predict where the market will be headed for the next five years. Furthermore, the varying trends of segment & categories geographically presented are also studied and the estimated based on the primary & secondary research.
In this particular report from the supply side Data Library Research has conducted primary surveys (interviews) with the key level executives (VP, CEO’s, Marketing Director, Business Development Manager
and SOFT) of the companies that active & prominent as well as the midsized organization
FIGURE 1: DLR RESEARH PROCESS
![research-methodology1]()
Primary Research
Extensive primary research was conducted to gain a deeper insight of the market and industry performance. The analysis is based on both primary and secondary research as well as years of professional expertise in the respective industries.
In addition to analysing current and historical trends, our analysts predict where the market is headed over the next five years.
It varies by segment for these categories geographically presented in the list of market tables. Speaking about this particular report we have conducted primary surveys (interviews) with the key level executives (VP, CEO’s, Marketing Director, Business Development Manager and many more) of the major players active in the market.
Secondary Research
Secondary research was mainly used to collect and identify information useful for the extensive, technical, market-oriented, and Friend’s study of the Global Extra Neutral Alcohol. It was also used to obtain key information about major players, market classification and segmentation according to the industry trends, geographical markets, and developments related to the market and technology perspectives. For this study, analysts have gathered information from various credible sources, such as annual reports, sec filings, journals, white papers, SOFT presentations, and company web sites.
Market Size Estimation
Both, top-down and bottom-up approaches were used to estimate and validate the size of the Global market and to estimate the size of various other dependent submarkets in the overall Extra Neutral Alcohol. The key players in the market were identified through secondary research and their market contributions in the respective geographies were determined through primary and secondary research.
Forecast Model
![research-methodology2]()