Natural Organic Personal Care Product Market Overview and Analysis

The Global Natural Organic Personal Care Product Market size was estimated at USD 21.82 billion in 2026 and is projected to reach USD 44.77 billion by 2033, growing with a CAGR of 8.76% from 2026-2033.

Natural Organic Personal Care Product Market

Get Complete Analysis Of The Report - Download Updated Free Sample PDF

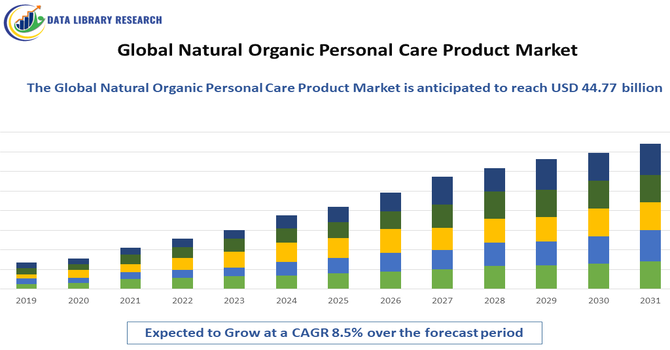
The Global Natural Organic Personal Care Product Market refers to the worldwide industry that produces, markets, and sells personal care products—such as skincare, haircare, cosmetics, and hygiene items—made primarily from natural and organically sourced ingredients. These products avoid synthetic chemicals, artificial fragrances, parabens, and harmful additives, appealing to health-conscious and environmentally aware consumers. The growth in this market is driven by rising consumer preference for sustainable, non-toxic, and ethically produced goods, increased awareness of product ingredient safety, and stringent regulations supporting organic certification.

Natural Organic Personal Care Product Market Latest Trends

The global natural organic personal care product market is shaped by increasing consumer demand for clean, chemical-free formulations that support health and sustainability. Shoppers are prioritizing ingredient transparency, eco-friendly packaging, and cruelty-free certifications. Digital commerce and social media influence buying behavior, with direct-to-consumer brands leveraging online platforms for growth. Millennials and Gen Z are key drivers, seeking products aligned with wellness and environmental values.

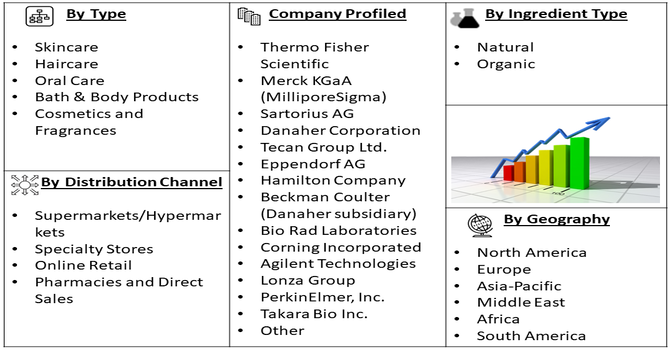
Segmentation: The Global Natural Organic Personal Care Product Market is segmented by Product Type (Skincare, Haircare, Oral Care, Bath & Body Products, Cosmetics, and Fragrances), Ingredient Type (Natural and Organic), Distribution Channel (Supermarkets/Hypermarkets, Specialty Stores, Online Retail, Pharmacies, and Direct Sales), and Geography (North America, Europe, Asia-Pacific, Middle East and Africa, and South America). The report provides the value (in USD million) for the above segments.

Natural Organic Personal Care Product Market segment

For Detailed Market Segmentation - Get a Free Sample PDF

Market Drivers:

  • Rising Consumer Awareness and Health Consciousness

Growing consumer awareness about the potential health risks associated with synthetic chemicals in conventional personal care products is a major driver of the global natural organic personal care product market. Consumers are increasingly informed about ingredients such as parabens, sulfates, phthalates, and artificial fragrances, which are often linked to skin irritation and long-term health concerns. For instance, in October 2025, Zatik Naturals introduced its sulfate-free foaming shampoos, demonstrating that rich lather was achievable without harsh chemicals. Formulated with plant-based surfactants and organic extracts, the shampoos gently cleansed and hydrated hair and scalp. The vegan, cruelty-free, USDA Certified Organic products were handcrafted in California using fresh botanicals.

This awareness has shifted preferences toward products made with natural, plant-based, and organically certified ingredients perceived as safer and gentler. Increased access to information through digital media, influencers, and product labeling has further empowered consumers to make informed choices, accelerating demand across skincare, haircare, and hygiene segments globally.

  • Sustainability, Ethical Consumption, and Regulatory Support

Sustainability and ethical consumption trends strongly drive market growth, as consumers seek products aligned with environmental protection and social responsibility. Natural organic personal care brands emphasize eco-friendly packaging, cruelty-free testing, fair-trade sourcing, and reduced environmental impact.

Corporate sustainability initiatives and carbon reduction goals also encourage manufacturers to reformulate products using renewable and biodegradable ingredients. For instance, in June 2023, The Estée Lauder Companies Inc. launched the Responsible Store Design program to assess existing and new retail outlets and guide sustainable visual merchandising. The pilot program focused on energy efficiency, waste reduction, water conservation, and responsible material sourcing, with six stores aligning successfully by the end of June.

Market Restraints

  • High Cost and Limited Accessibility

The high cost of natural and organic personal care products remains a key restraint limiting widespread market penetration. Organic ingredients, sustainable sourcing, certification processes, and eco-friendly packaging significantly increase production costs, resulting in premium pricing compared to conventional alternatives. This price gap restricts affordability for price-sensitive consumers, especially in developing and low-income regions. Additionally, limited availability of certified organic raw materials and supply chain complexities can constrain scalability. Lack of consumer trust in unverified “natural” claims also creates skepticism. Together, these factors slow adoption rates and pose challenges to achieving mass-market acceptance despite growing demand.

Socioeconomic Impact on Natural Organic Personal Care Product Market

The natural organic personal care market contributes positively to socioeconomic development by creating jobs across agriculture, manufacturing, research, and retail sectors. Demand for certified organic ingredients supports smallholder farmers and sustainable farming practices, often improving rural incomes. Ethical sourcing and fair-trade initiatives enhance community welfare and environmental stewardship. Consumer health awareness reduces exposure to harmful chemicals, potentially lowering long-term healthcare costs. However, premium pricing can limit accessibility for lower-income consumers, raising concerns about equity. Overall, market growth encourages investment in green technologies and education, fostering inclusive economic participation while promoting responsible consumption patterns globally.

Segmental Analysis:

  • Skincare segment is expected to witness highest growth over the forecast period

The skincare segment is expected to witness the highest growth over the forecast period due to increasing consumer focus on skin health, appearance, and long-term wellness. Rising concerns about allergies, sensitivity, aging, and pollution-related skin damage are driving demand for natural and organic skincare products formulated with plant-based, chemical-free ingredients. Consumers increasingly prefer clean-label moisturizers, serums, sunscreens, and anti-aging solutions perceived as safer and more effective. Growth is further supported by product innovation, dermatological endorsements, and premiumization trends. The influence of social media, beauty influencers, and personalized skincare routines also contributes significantly to the rapid expansion of this segment.

  • Organic segment is expected to witness highest growth over the forecast period

The organic segment is expected to witness the highest growth over the forecast period as consumers increasingly trust certified organic products over those merely labeled as natural. Organic personal care products are formulated using ingredients grown without synthetic pesticides, fertilizers, or genetically modified organisms, aligning with health-conscious and environmentally aware lifestyles.

Rising awareness of certification standards, such as USDA Organic and COSMOS, enhances consumer confidence and willingness to pay premium prices. For instance, In May 2023, Amway announced that four Artistry Skincare products received The Skin Cancer Foundation Seal of Recommendation. The recognized products included Artistry Skin Nutrition Balancing Matte Day Lotion SPF 30, Renewing Reactivation Day Cream SPF 30, Hydrating Day Lotion SPF 30, and Renewing Reactivation Day Lotion SPF 30.

Additionally, regulatory support for organic farming, growing availability of certified raw materials, and brand transparency initiatives are strengthening demand, positioning the organic segment as a key growth engine in the global market.

  • Online Retail segment is expected to witness highest growth over the forecast period

The online retail segment is expected to witness the highest growth over the forecast period due to increasing digital adoption and changing consumer purchasing behavior. E-commerce platforms offer convenience, wider product selection, detailed ingredient information, and access to niche organic brands not available in physical stores. The growth of direct-to-consumer models allows brands to build stronger customer relationships while offering competitive pricing and subscription services. Social media marketing, influencer endorsements, and targeted advertising further drive online sales. Additionally, improvements in logistics, secure payment systems, and global reach make online retail a preferred channel for natural organic personal care products.

  • North America Region is expected to witness highest growth over the forecast period

North America is expected to witness the highest growth over the forecast period due to strong consumer awareness, high disposable income, and well-established demand for clean and sustainable personal care products.

In January 2025, Research from the University of Cincinnati highlights that sulfate-free advancements are transforming North America’s natural and organic personal care market. The shift goes beyond simply removing sulfates from labels, emphasizing real consumer benefits and genuine environmental improvements, which is driving stronger demand for sustainable, high-performance cleansing products.

Simialrly, in 2024, Kylie Cosmetics’ launch in India marked a major milestone in its global expansion. Partnering with House of Beauty, the brand finally entered the Indian market, fulfilling long-awaited demand from local beauty consumers. Available exclusively in 25 Sephora India stores and online, the move strengthened Kylie Cosmetics’ presence and accessibility across the country.

Consumers in the region are highly informed about ingredient safety, environmental impact, and ethical sourcing, driving preference for natural and organic alternatives. The presence of major market players, continuous product innovation, and advanced distribution networks further support growth. Favorable regulatory frameworks, widespread availability of certified organic products, and strong penetration of e-commerce channels also contribute to North America’s leading position in the global natural organic personal care product market.

Natural Organic Personal Care Product Market table

To Learn More About This Report - Request a Free Sample Copy

Natural Organic Personal Care Product Market Competitive Landscape

The competitive landscape of the global natural organic personal care market is dynamic and fragmented, featuring established multinational brands alongside emerging niche players. Major corporations invest in sustainability, acquiring indie organic brands to expand their portfolios and market share. Innovation in formulation, certification, and packaging differentiates competitors, while marketing strategies focus on authenticity and brand values. E-commerce platforms enable smaller brands to reach global audiences, intensifying competition. Regulatory compliance and third-party organic certifications serve as key competitive barriers. Strategic partnerships, celebrity endorsements, and regional expansions are common tactics. Price competitiveness versus premium positioning remains a balancing act as brands strive to meet diverse consumer preferences.

The major players for above market are:

  • L’Oréal S.A.
  • The Estée Lauder Companies Inc.
  • Unilever PLC
  • Beiersdorf AG
  • Procter & Gamble (P&G)
  • Johnson & Johnson
  • Natura & Co (including The Body Shop & Aesop)
  • Weleda AG
  • Burt’s Bees (Clorox)
  • Hain Celestial Group (e.g., Avalon Organics)
  • Aveda Corporation
  • Amway Corporation
  • Arbonne International LLC
  • Korres Natural Products
  • Yves Rocher SA
  • Oriflame Cosmetics AG
  • Dr. Bronner’s Magic Soaps
  • Herbivore Botanicals
  • Tata Harper Skincare

Recent Development

  • In May 2025, TLL Elements Pvt. Ltd. launched YES SKINCARE in India, strengthening the global natural organic personal care product market by expanding clean, science-backed D2C offerings. The brand promoted mindful beauty and everyday skincare solutions, reinforcing consumer demand for effective, transparent, and purpose-driven natural products, while highlighting India’s growing role in shaping global clean beauty trends.


  • In April 2025, BASF expanded its natural-based ingredient portfolio with Verdessence Maize, Lamesoft OP Plus, and Dehyton PK45 GA/RA, supporting more sustainable personal care formulations without sacrificing performance. This development strengthened the global natural organic personal care market by enabling biodegradable, eco-conscious alternatives, aligning with rising consumer demand for responsible beauty and longevity-focused routines.


Frequently Asked Questions (FAQ) :

Q1. What are the main growth-driving factors for this market?

The market is primarily driven by increasing consumer awareness regarding the harmful effects of synthetic chemicals like parabens and sulfates. A growing preference for "clean beauty" and sustainable sourcing encourages brands to innovate. Additionally, rising disposable incomes and the expansion of e-commerce platforms have made organic products globally accessible to health-conscious consumers.

Q2. What are the main restraining factors for this market?

High production costs and the premium pricing of organic ingredients act as significant restraints, limiting the target demographic. Short shelf lives due to the absence of synthetic preservatives also pose logistical challenges for retailers. Furthermore, "greenwashing"—where products are misleadingly labeled as natural—creates consumer skepticism and complicates regulatory compliance across different regions.

Q3. Which segment is expected to witness high growth?

The skin care segment is expected to witness the highest growth. Consumers are increasingly prioritizing facial care routines involving organic serums, moisturizers, and cleansers. This shift is fueled by a desire for anti-aging benefits without chemical side effects, alongside a rising trend of DIY-inspired organic treatments that emphasize ingredient transparency and purity.

Q4. Who are the top major players for this market?

The market features prominent players such as L'Oréal SA (with brands like Kiehl's), The Estée Lauder Companies, and Beiersdorf AG. Other influential entities include Weleda, Arbonne International, Burt's Bees (owned by Clorox), and Hain Celestial Group. These companies focus on sustainable packaging and botanical formulations to secure a competitive market share.

Q5. Which country is the largest player?

The United States is currently the largest player in this market. Its dominance is supported by a sophisticated retail network, high consumer awareness, and a strong presence of local organic brands. The culture of wellness and environmental sustainability in North America continues to drive massive demand for premium, certified organic personal care solutions.

Natural Organic Personal Care Product MARKET STUDY GLOBAL MARKET ANALYSIS, INSIGHTS AND FORECAST, 2022-2029

    1. Introduction

    • 1.1. Research Scope
    • 1.2. Market Segmentation
    • 1.3. Research Methodology
    • 1.4. Definitions and Assumptions

    2. Executive Summary

      3. Market Dynamics

      • 3.1. Market Drivers
      • 3.2. Market Restraints
      • 3.3. Market Opportunities

      4. Key Insights

      • 4.1. Key Emerging Trends – For Major Countries
      • 4.2. Latest Technological Advancement
      • 4.3. Regulatory Landscape
      • 4.4. Industry SWOT Analysis
      • 4.5. Porters Five Forces Analysis

      5. Global Natural Organic Personal Care Product Market Analysis (USD Billion), Insights and Forecast, 2018-2029

      • 5.1. Key Findings / Summary
      • 5.2. Market Analysis, Insights and Forecast – By Segment 1
        • 5.2.1. Sub-Segment 1
        • 5.2.2. Sub-Segment 2
      • 5.3. Market Analysis, Insights and Forecast – By Segment 2
        • 5.3.1. Sub-Segment 1
        • 5.3.2. Sub-Segment 2
        • 5.3.3. Sub-Segment 3
        • 5.3.4. Others
      • 5.4. Market Analysis, Insights and Forecast – By Segment 3
        • 5.4.1. Sub-Segment 1
        • 5.4.2. Sub-Segment 2
        • 5.4.3. Sub-Segment 3
        • 5.4.4. Others
      • 5.5. Market Analysis, Insights and Forecast – By Region
        • 5.5.1. North America
        • 5.5.2. Latin America
        • 5.5.3. Europe
        • 5.5.4. Asia Pacific
        • 5.5.5. Middle East and Africa

      6. North America Natural Organic Personal Care Product Market Analysis (USD Billion), Insights and Forecast, 2018-2029

      • 6.1. Key Findings / Summary
      • 6.2. Market Analysis, Insights and Forecast – By Segment 1
        • 6.2.1. Sub-Segment 1
        • 6.2.2. Sub-Segment 2
      • 6.3. Market Analysis, Insights and Forecast – By Segment 2
        • 6.3.1. Sub-Segment 1
        • 6.3.2. Sub-Segment 2
        • 6.3.3. Sub-Segment 3
        • 6.3.4. Others
      • 6.4. Market Analysis, Insights and Forecast – By Segment 3
        • 6.4.1. Sub-Segment 1
        • 6.4.2. Sub-Segment 2
        • 6.4.3. Sub-Segment 3
        • 6.4.4. Others
      • 6.5. Market Analysis, Insights and Forecast – By Country
        • 6.5.1. U.S.
        • 6.5.2. Canada

      7. Latin America Natural Organic Personal Care Product Market Analysis (USD Billion), Insights and Forecast, 2018-2029

      • 7.1. Key Findings / Summary
      • 7.2. Market Analysis, Insights and Forecast – By Segment 1
        • 7.2.1. Sub-Segment 1
        • 7.2.2. Sub-Segment 2
      • 7.3. Market Analysis, Insights and Forecast – By Segment 2
        • 7.3.1. Sub-Segment 1
        • 7.3.2. Sub-Segment 2
        • 7.3.3. Sub-Segment 3
        • 7.3.4. Others
      • 7.4. Market Analysis, Insights and Forecast – By Segment 3
        • 7.4.1. Sub-Segment 1
        • 7.4.2. Sub-Segment 2
        • 7.4.3. Sub-Segment 3
        • 7.4.4. Others
      • 7.5. Insights and Forecast – By Country
        • 7.5.1. Brazil
        • 7.5.2. Mexico
        • 7.5.3. Rest of Latin America

      8. Europe Natural Organic Personal Care Product Market Analysis (USD Billion), Insights and Forecast, 2018-2029

      • 8.1. Key Findings / Summary
      • 8.2. Market Analysis, Insights and Forecast – By Segment 1
        • 8.2.1. Sub-Segment 1
        • 8.2.2. Sub-Segment 2
      • 8.3. Market Analysis, Insights and Forecast – By Segment 2
        • 8.3.1. Sub-Segment 1
        • 8.3.2. Sub-Segment 2
        • 8.3.3. Sub-Segment 3
        • 8.3.4. Others
      • 8.4. Market Analysis, Insights and Forecast – By Segment 3
        • 8.4.1. Sub-Segment 1
        • 8.4.2. Sub-Segment 2
        • 8.4.3. Sub-Segment 3
        • 8.4.4. Others
      • 8.5. Market Analysis, Insights and Forecast – By Country
        • 8.5.1. UK
        • 8.5.2. Germany
        • 8.5.3. France
        • 8.5.4. Italy
        • 8.5.5. Spain
        • 8.5.6. Russia
        • 8.5.7. Rest of Europe

      9. Asia Pacific Natural Organic Personal Care Product Market Analysis (USD Billion), Insights and Forecast, 2018-2029

      • 9.1. Key Findings / Summary
      • 9.2. Market Analysis, Insights and Forecast – By Segment 1
        • 9.2.1. Sub-Segment 1
        • 9.2.2. Sub-Segment 2
      • 9.3. Market Analysis, Insights and Forecast – By Segment 2
        • 9.3.1. Sub-Segment 1
        • 9.3.2. Sub-Segment 2
        • 9.3.3. Sub-Segment 3
        • 9.3.4. Others
      • 9.4. Market Analysis, Insights and Forecast – By Segment 3
        • 9.4.1. Sub-Segment 1
        • 9.4.2. Sub-Segment 2
        • 9.4.3. Sub-Segment 3
        • 9.4.4. Others
      • 9.5. Market Analysis, Insights and Forecast – By Country
        • 9.5.1. China
        • 9.5.2. India
        • 9.5.3. Japan
        • 9.5.4. Australia
        • 9.5.5. South East Asia
        • 9.5.6. Rest of Asia Pacific

      10. Middle East & Africa Natural Organic Personal Care Product Market Analysis (USD Billion), Insights and Forecast, 2018-2029

      • 10.1. Key Findings / Summary
      • 10.2. Market Analysis, Insights and Forecast – By Segment 1
        • 10.2.1. Sub-Segment 1
        • 10.2.2. Sub-Segment 2
      • 10.3. Market Analysis, Insights and Forecast – By Segment 2
        • 10.3.1. Sub-Segment 1
        • 10.3.2. Sub-Segment 2
        • 10.3.3. Sub-Segment 3
        • 10.3.4. Others
      • 10.4. Market Analysis, Insights and Forecast – By Segment 3
        • 10.4.1. Sub-Segment 1
        • 10.4.2. Sub-Segment 2
        • 10.4.3. Sub-Segment 3
        • 10.4.4. Others
      • 10.5. Market Analysis, Insights and Forecast – By Country
        • 10.5.1. GCC
        • 10.5.2. South Africa
        • 10.5.3. Rest of Middle East & Africa

      11. Competitive Analysis

      • 11.1. Company Market Share Analysis, 2018
      • 11.2. Key Industry Developments
      • 11.3. Company Profile
        • 11.3.1. Company 1
          • 11.3.1.1. Business Overview
          • 11.3.1.2. Segment 1 & Service Offering
          • 11.3.1.3. Overall Revenue
          • 11.3.1.4. Geographic Presence
          • 11.3.1.5. Recent Development
        *Similar details will be provided for the following companies
        • 11.3.2. Company 2
        • 11.3.3. Company 3
        • 11.3.4. Company 4
        • 11.3.5. Company 5
        • 11.3.6. Company 6
        • 11.3.7. Company 7
        • 11.3.8. Company 8
        • 11.3.9. Company 9
        • 11.3.10. Company 10
        • 11.3.11. Company 11
        • 11.3.12. Company 12
      List of Figures

      Figure 1: Global Natural Organic Personal Care Product Market Revenue Breakdown (USD Billion, %) by Region, 2022 & 2029
      Figure 2: Global Natural Organic Personal Care Product Market Value Share (%), By Segment 1, 2022 & 2029
      Figure 3: Global Natural Organic Personal Care Product Market Forecast (USD Billion), by Sub-Segment 1, 2018-2029
      Figure 4: Global Natural Organic Personal Care Product Market Forecast (USD Billion), by Sub-Segment 2, 2018-2029
      Figure 5: Global Natural Organic Personal Care Product Market Value Share (%), By Segment 2, 2022 & 2029
      Figure 6: Global Natural Organic Personal Care Product Market Forecast (USD Billion), by Sub-Segment 1, 2018-2029
      Figure 7: Global Natural Organic Personal Care Product Market Forecast (USD Billion), by Sub-Segment 2, 2018-2029
      Figure 8: Global Natural Organic Personal Care Product Market Forecast (USD Billion), by Sub-Segment 3, 2018-2029
      Figure 9: Global Natural Organic Personal Care Product Market Forecast (USD Billion), by Others, 2018-2029
      Figure 10: Global Natural Organic Personal Care Product Market Value Share (%), By Segment 3, 2022 & 2029
      Figure 11: Global Natural Organic Personal Care Product Market Forecast (USD Billion), by Sub-Segment 1, 2018-2029
      Figure 12: Global Natural Organic Personal Care Product Market Forecast (USD Billion), by Sub-Segment 2, 2018-2029
      Figure 13: Global Natural Organic Personal Care Product Market Forecast (USD Billion), by Sub-Segment 3, 2018-2029
      Figure 14: Global Natural Organic Personal Care Product Market Forecast (USD Billion), by Others, 2018-2029
      Figure 15: Global Natural Organic Personal Care Product Market Value (USD Billion), by Region, 2022 & 2029
      Figure 16: North America Natural Organic Personal Care Product Market Value Share (%), By Segment 1, 2022 & 2029
      Figure 17: North America Natural Organic Personal Care Product Market Forecast (USD Billion), by Sub-Segment 1, 2018-2029
      Figure 18: North America Natural Organic Personal Care Product Market Forecast (USD Billion), by Sub-Segment 2, 2018-2029
      Figure 19: North America Natural Organic Personal Care Product Market Value Share (%), By Segment 2, 2022 & 2029
      Figure 20: North America Natural Organic Personal Care Product Market Forecast (USD Billion), by Sub-Segment 1, 2018-2029
      Figure 21: North America Natural Organic Personal Care Product Market Forecast (USD Billion), by Sub-Segment 2, 2018-2029
      Figure 22: North America Natural Organic Personal Care Product Market Forecast (USD Billion), by Sub-Segment 3, 2018-2029
      Figure 23: North America Natural Organic Personal Care Product Market Forecast (USD Billion), by Others, 2018-2029
      Figure 24: North America Natural Organic Personal Care Product Market Value Share (%), By Segment 3, 2022 & 2029
      Figure 25: North America Natural Organic Personal Care Product Market Forecast (USD Billion), by Sub-Segment 1, 2018-2029
      Figure 26: North America Natural Organic Personal Care Product Market Forecast (USD Billion), by Sub-Segment 2, 2018-2029
      Figure 27: North America Natural Organic Personal Care Product Market Forecast (USD Billion), by Sub-Segment 3, 2018-2029
      Figure 28: North America Natural Organic Personal Care Product Market Forecast (USD Billion), by Others, 2018-2029
      Figure 29: North America Natural Organic Personal Care Product Market Forecast (USD Billion), by U.S., 2018-2029
      Figure 30: North America Natural Organic Personal Care Product Market Forecast (USD Billion), by Canada, 2018-2029
      Figure 31: Latin America Natural Organic Personal Care Product Market Value Share (%), By Segment 1, 2022 & 2029
      Figure 32: Latin America Natural Organic Personal Care Product Market Forecast (USD Billion), by Sub-Segment 1, 2018-2029
      Figure 33: Latin America Natural Organic Personal Care Product Market Forecast (USD Billion), by Sub-Segment 2, 2018-2029
      Figure 34: Latin America Natural Organic Personal Care Product Market Value Share (%), By Segment 2, 2022 & 2029
      Figure 35: Latin America Natural Organic Personal Care Product Market Forecast (USD Billion), by Sub-Segment 1, 2018-2029
      Figure 36: Latin America Natural Organic Personal Care Product Market Forecast (USD Billion), by Sub-Segment 2, 2018-2029
      Figure 37: Latin America Natural Organic Personal Care Product Market Forecast (USD Billion), by Sub-Segment 3, 2018-2029
      Figure 38: Latin America Natural Organic Personal Care Product Market Forecast (USD Billion), by Others, 2018-2029
      Figure 39: Latin America Natural Organic Personal Care Product Market Value Share (%), By Segment 3, 2022 & 2029
      Figure 40: Latin America Natural Organic Personal Care Product Market Forecast (USD Billion), by Sub-Segment 1, 2018-2029
      Figure 41: Latin America Natural Organic Personal Care Product Market Forecast (USD Billion), by Sub-Segment 2, 2018-2029
      Figure 42: Latin America Natural Organic Personal Care Product Market Forecast (USD Billion), by Sub-Segment 3, 2018-2029
      Figure 43: Latin America Natural Organic Personal Care Product Market Forecast (USD Billion), by Others, 2018-2029
      Figure 44: Latin America Natural Organic Personal Care Product Market Forecast (USD Billion), by Brazil, 2018-2029
      Figure 45: Latin America Natural Organic Personal Care Product Market Forecast (USD Billion), by Mexico, 2018-2029
      Figure 46: Latin America Natural Organic Personal Care Product Market Forecast (USD Billion), by Rest of Latin America, 2018-2029
      Figure 47: Europe Natural Organic Personal Care Product Market Value Share (%), By Segment 1, 2022 & 2029
      Figure 48: Europe Natural Organic Personal Care Product Market Forecast (USD Billion), by Sub-Segment 1, 2018-2029
      Figure 49: Europe Natural Organic Personal Care Product Market Forecast (USD Billion), by Sub-Segment 2, 2018-2029
      Figure 50: Europe Natural Organic Personal Care Product Market Value Share (%), By Segment 2, 2022 & 2029
      Figure 51: Europe Natural Organic Personal Care Product Market Forecast (USD Billion), by Sub-Segment 1, 2018-2029
      Figure 52: Europe Natural Organic Personal Care Product Market Forecast (USD Billion), by Sub-Segment 2, 2018-2029
      Figure 53: Europe Natural Organic Personal Care Product Market Forecast (USD Billion), by Sub-Segment 3, 2018-2029
      Figure 54: Europe Natural Organic Personal Care Product Market Forecast (USD Billion), by Others, 2018-2029
      Figure 55: Europe Natural Organic Personal Care Product Market Value Share (%), By Segment 3, 2022 & 2029
      Figure 56: Europe Natural Organic Personal Care Product Market Forecast (USD Billion), by Sub-Segment 1, 2018-2029
      Figure 57: Europe Natural Organic Personal Care Product Market Forecast (USD Billion), by Sub-Segment 2, 2018-2029
      Figure 58: Europe Natural Organic Personal Care Product Market Forecast (USD Billion), by Sub-Segment 3, 2018-2029
      Figure 59: Europe Natural Organic Personal Care Product Market Forecast (USD Billion), by Others, 2018-2029
      Figure 60: Europe Natural Organic Personal Care Product Market Forecast (USD Billion), by U.K., 2018-2029
      Figure 61: Europe Natural Organic Personal Care Product Market Forecast (USD Billion), by Germany, 2018-2029
      Figure 62: Europe Natural Organic Personal Care Product Market Forecast (USD Billion), by France, 2018-2029
      Figure 63: Europe Natural Organic Personal Care Product Market Forecast (USD Billion), by Italy, 2018-2029
      Figure 64: Europe Natural Organic Personal Care Product Market Forecast (USD Billion), by Spain, 2018-2029
      Figure 65: Europe Natural Organic Personal Care Product Market Forecast (USD Billion), by Russia, 2018-2029
      Figure 66: Europe Natural Organic Personal Care Product Market Forecast (USD Billion), by Rest of Europe, 2018-2029
      Figure 67: Asia Pacific Natural Organic Personal Care Product Market Value Share (%), By Segment 1, 2022 & 2029
      Figure 68: Asia Pacific Natural Organic Personal Care Product Market Forecast (USD Billion), by Sub-Segment 1, 2018-2029
      Figure 69: Asia Pacific Natural Organic Personal Care Product Market Forecast (USD Billion), by Sub-Segment 2, 2018-2029
      Figure 70: Asia Pacific Natural Organic Personal Care Product Market Value Share (%), By Segment 2, 2022 & 2029
      Figure 71: Asia Pacific Natural Organic Personal Care Product Market Forecast (USD Billion), by Sub-Segment 1, 2018-2029
      Figure 72: Asia Pacific Natural Organic Personal Care Product Market Forecast (USD Billion), by Sub-Segment 2, 2018-2029
      Figure 73: Asia Pacific Natural Organic Personal Care Product Market Forecast (USD Billion), by Sub-Segment 3, 2018-2029
      Figure 74: Asia Pacific Natural Organic Personal Care Product Market Forecast (USD Billion), by Others, 2018-2029
      Figure 75: Asia Pacific Natural Organic Personal Care Product Market Value Share (%), By Segment 3, 2022 & 2029
      Figure 76: Asia Pacific Natural Organic Personal Care Product Market Forecast (USD Billion), by Sub-Segment 1, 2018-2029
      Figure 77: Asia Pacific Natural Organic Personal Care Product Market Forecast (USD Billion), by Sub-Segment 2, 2018-2029
      Figure 78: Asia Pacific Natural Organic Personal Care Product Market Forecast (USD Billion), by Sub-Segment 3, 2018-2029
      Figure 79: Asia Pacific Natural Organic Personal Care Product Market Forecast (USD Billion), by Others, 2018-2029
      Figure 80: Asia Pacific Natural Organic Personal Care Product Market Forecast (USD Billion), by China, 2018-2029
      Figure 81: Asia Pacific Natural Organic Personal Care Product Market Forecast (USD Billion), by India, 2018-2029
      Figure 82: Asia Pacific Natural Organic Personal Care Product Market Forecast (USD Billion), by Japan, 2018-2029
      Figure 83: Asia Pacific Natural Organic Personal Care Product Market Forecast (USD Billion), by Australia, 2018-2029
      Figure 84: Asia Pacific Natural Organic Personal Care Product Market Forecast (USD Billion), by Southeast Asia, 2018-2029
      Figure 85: Asia Pacific Natural Organic Personal Care Product Market Forecast (USD Billion), by Rest of Asia Pacific, 2018-2029
      Figure 86: Middle East & Africa Natural Organic Personal Care Product Market Value Share (%), By Segment 1, 2022 & 2029
      Figure 87: Middle East & Africa Natural Organic Personal Care Product Market Forecast (USD Billion), by Sub-Segment 1, 2018-2029
      Figure 88: Middle East & Africa Natural Organic Personal Care Product Market Forecast (USD Billion), by Sub-Segment 2, 2018-2029
      Figure 89: Middle East & Africa Natural Organic Personal Care Product Market Value Share (%), By Segment 2, 2022 & 2029
      Figure 90: Middle East & Africa Natural Organic Personal Care Product Market Forecast (USD Billion), by Sub-Segment 1, 2018-2029
      Figure 91: Middle East & Africa Natural Organic Personal Care Product Market Forecast (USD Billion), by Sub-Segment 2, 2018-2029
      Figure 92: Middle East & Africa Natural Organic Personal Care Product Market Forecast (USD Billion), by Sub-Segment 3, 2018-2029
      Figure 93: Middle East & Africa Natural Organic Personal Care Product Market Forecast (USD Billion), by Others, 2018-2029
      Figure 94: Middle East & Africa Natural Organic Personal Care Product Market Value Share (%), By Segment 3, 2022 & 2029
      Figure 95: Middle East & Africa Natural Organic Personal Care Product Market Forecast (USD Billion), by Sub-Segment 1, 2018-2029
      Figure 96: Middle East & Africa Natural Organic Personal Care Product Market Forecast (USD Billion), by Sub-Segment 2, 2018-2029
      Figure 97: Middle East & Africa Natural Organic Personal Care Product Market Forecast (USD Billion), by Sub-Segment 3, 2018-2029
      Figure 98: Middle East & Africa Natural Organic Personal Care Product Market Forecast (USD Billion), by Others, 2018-2029
      Figure 99: Middle East & Africa Natural Organic Personal Care Product Market Forecast (USD Billion), by GCC, 2018-2029
      Figure 100: Middle East & Africa Natural Organic Personal Care Product Market Forecast (USD Billion), by South Africa, 2018-2029
      Figure 101: Middle East & Africa Natural Organic Personal Care Product Market Forecast (USD Billion), by Rest of Middle East & Africa, 2018-2029 
      List of Tables
      Table 1: Global Natural Organic Personal Care Product Market Revenue (USD Billion) Forecast, by Segment 1, 2018-2029
      Table 2: Global Natural Organic Personal Care Product Market Revenue (USD Billion) Forecast, by Segment 2, 2018-2029
      Table 3: Global Natural Organic Personal Care Product Market Revenue (USD Billion) Forecast, by Segment 3, 2018-2029
      Table 4: Global Natural Organic Personal Care Product Market Revenue (USD Billion) Forecast, by Region, 2018-2029
      Table 5: North America Natural Organic Personal Care Product Market Revenue (USD Billion) Forecast, by Segment 1, 2018-2029
      Table 6: North America Natural Organic Personal Care Product Market Revenue (USD Billion) Forecast, by Segment 2, 2018-2029
      Table 7: North America Natural Organic Personal Care Product Market Revenue (USD Billion) Forecast, by Segment 3, 2018-2029
      Table 8: North America Natural Organic Personal Care Product Market Revenue (USD Billion) Forecast, by Country, 2018-2029
      Table 9: Europe Natural Organic Personal Care Product Market Revenue (USD Billion) Forecast, by Segment 1, 2018-2029
      Table 10: Europe Natural Organic Personal Care Product Market Revenue (USD Billion) Forecast, by Segment 2, 2018-2029
      Table 11: Europe Natural Organic Personal Care Product Market Revenue (USD Billion) Forecast, by Segment 3, 2018-2029
      Table 12: Europe Natural Organic Personal Care Product Market Revenue (USD Billion) Forecast, by Country, 2018-2029
      Table 13: Latin America Natural Organic Personal Care Product Market Revenue (USD Billion) Forecast, by Segment 1, 2018-2029
      Table 14: Latin America Natural Organic Personal Care Product Market Revenue (USD Billion) Forecast, by Segment 2, 2018-2029
      Table 15: Latin America Natural Organic Personal Care Product Market Revenue (USD Billion) Forecast, by Segment 3, 2018-2029
      Table 16: Latin America Natural Organic Personal Care Product Market Revenue (USD Billion) Forecast, by Country, 2018-2029
      Table 17: Asia Pacific Natural Organic Personal Care Product Market Revenue (USD Billion) Forecast, by Segment 1, 2018-2029
      Table 18: Asia Pacific Natural Organic Personal Care Product Market Revenue (USD Billion) Forecast, by Segment 2, 2018-2029
      Table 19: Asia Pacific Natural Organic Personal Care Product Market Revenue (USD Billion) Forecast, by Segment 3, 2018-2029
      Table 20: Asia Pacific Natural Organic Personal Care Product Market Revenue (USD Billion) Forecast, by Country, 2018-2029
      Table 21: Middle East & Africa Natural Organic Personal Care Product Market Revenue (USD Billion) Forecast, by Segment 1, 2018-2029
      Table 22: Middle East & Africa Natural Organic Personal Care Product Market Revenue (USD Billion) Forecast, by Segment 2, 2018-2029
      Table 23: Middle East & Africa Natural Organic Personal Care Product Market Revenue (USD Billion) Forecast, by Segment 3, 2018-2029
      Table 24: Middle East & Africa Natural Organic Personal Care Product Market Revenue (USD Billion) Forecast, by Country, 2018-2029
      Research Process

      Data Library Research are conducted by industry experts who offer insight on industry structure, market segmentations technology assessment and competitive landscape (CL), and penetration, as well as on emerging trends. Their analysis is based on primary interviews (~ 80%) and secondary research (~ 20%) as well as years of professional expertise in their respective industries. Adding to this, by analysing historical trends and current market positions, our analysts predict where the market will be headed for the next five years. Furthermore, the varying trends of segment & categories geographically presented are also studied and the estimated based on the primary & secondary research.

      In this particular report from the supply side Data Library Research has conducted primary surveys (interviews) with the key level executives (VP, CEO’s, Marketing Director, Business Development Manager and SOFT) of the companies that active & prominent as well as the midsized organization

      FIGURE 1: DLR RESEARH PROCESS

      research-methodology1

      Primary Research

      Extensive primary research was conducted to gain a deeper insight of the market and industry performance. The analysis is based on both primary and secondary research as well as years of professional expertise in the respective industries.

      In addition to analysing current and historical trends, our analysts predict where the market is headed over the next five years.

      It varies by segment for these categories geographically presented in the list of market tables. Speaking about this particular report we have conducted primary surveys (interviews) with the key level executives (VP, CEO’s, Marketing Director, Business Development Manager and many more) of the major players active in the market.

      Secondary Research

      Secondary research was mainly used to collect and identify information useful for the extensive, technical, market-oriented, and Friend’s study of the Global Extra Neutral Alcohol. It was also used to obtain key information about major players, market classification and segmentation according to the industry trends, geographical markets, and developments related to the market and technology perspectives. For this study, analysts have gathered information from various credible sources, such as annual reports, sec filings, journals, white papers, SOFT presentations, and company web sites.

      Market Size Estimation

      Both, top-down and bottom-up approaches were used to estimate and validate the size of the Global market and to estimate the size of various other dependent submarkets in the overall Extra Neutral Alcohol. The key players in the market were identified through secondary research and their market contributions in the respective geographies were determined through primary and secondary research.

      Forecast Model

      research-methodology2