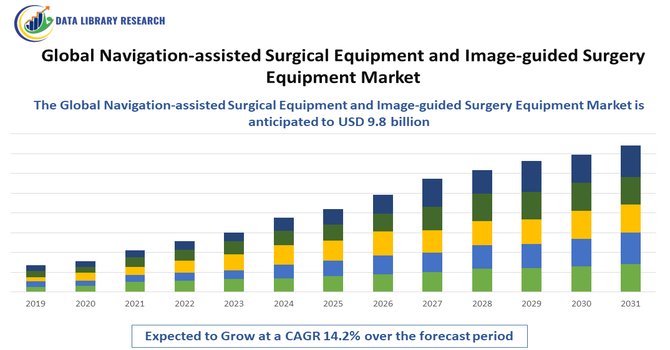
Navigation-assisted Surgical Equipment and Image-guided Surgery Equipment Market Overview and Analysis
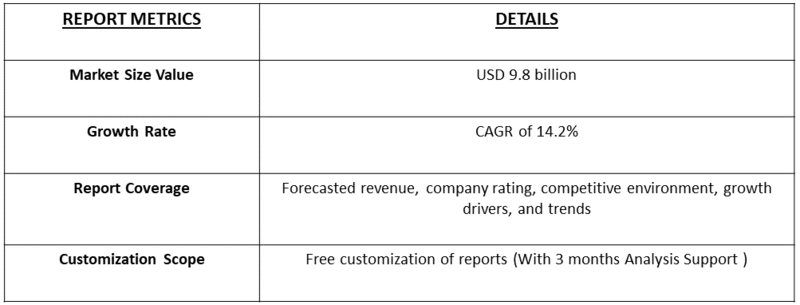
- The Global Navigation-assisted Surgical Equipment and Image-guided Surgery Equipment Market was valued at USD 4.1 billion in 2025 and expected to reach to USD 9.8 billion by 2032, growing with the CAGR of 14.2% over the forecast period 2025-2032.
Get Complete Analysis Of The Report - Download Updated Free Sample PDF
The Global Navigation-assisted Surgical Equipment and Image-guided Surgery Equipment Market is experiencing strong growth, primarily driven by the rising demand for minimally invasive surgical procedures and the increasing adoption of advanced imaging and navigation technologies in operating rooms. Surgeons are increasingly leveraging navigation-assisted and image-guided systems to enhance precision, accuracy, and safety during complex procedures, particularly in orthopedics, neurosurgery, and spinal surgeries. The growth is further supported by technological advancements such as 3D imaging, augmented reality (AR), and robotic-assisted navigation, which improve intraoperative visualization and patient outcomes.
Navigation-assisted Surgical Equipment and Image-guided Surgery Equipment Market Latest Trends
The Global Navigation-assisted Surgical Equipment and Image-guided Surgery Equipment Market is witnessing several emerging trends that are reshaping surgical practices. One key trend is the integration of advanced imaging modalities with real-time navigation systems, enabling surgeons to perform highly precise and minimally invasive procedures with improved outcomes. The adoption of robotic-assisted navigation platforms is also gaining momentum, allowing for enhanced dexterity, reduced surgical errors, and shorter patient recovery times.
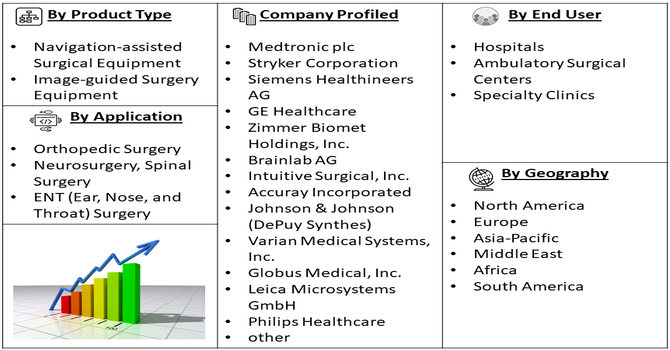
Segmentation: Global Navigation-assisted Surgical Equipment and Image-guided Surgery Equipment Market is segmented By Product Type (Navigation-assisted Surgical Equipment, Image-guided Surgery Equipment), Application (Orthopedic Surgery, Neurosurgery, Spinal Surgery, ENT (Ear, Nose, and Throat) Surgery), End User (Hospitals, Ambulatory Surgical Centers, Specialty Clinics), and Geography (North America, Europe, Asia-Pacific, Middle East and Africa, and South America). The report provides the value (in USD million) for the above segments.
For Detailed Market Segmentation - Get a Free Sample PDF
Market Drivers:
- Rising Demand for Minimally Invasive and Precision Surgeries
A key driver for the Global Navigation-assisted Surgical Equipment and Image-guided Surgery Equipment Market is the increasing adoption of minimally invasive surgical procedures. Surgeons are increasingly relying on navigation-assisted and image-guided systems to enhance precision, accuracy, and safety during complex surgeries, particularly in orthopedics, neurosurgery, and spinal procedures.
In September 2025, Sarvodaya Hospital in Faridabad introduced the Advanced SSI Mantra Surgical Robot, enabling minimally invasive surgeries across multiple specialties. The system offered enhanced 3D vision, tremor filtration, and advanced instrumentation, improving surgical precision, reducing infection risks, blood loss, and recovery time. Its adoption addressed the rising demand for precision and minimally invasive procedures, strengthening the global navigation-assisted and image-guided surgery equipment market by demonstrating technological innovation and expanded clinical applications. These technologies allow real-time visualization of anatomical structures, reducing the risk of complications, minimizing tissue damage, and improving postoperative outcomes.
- Technological Advancements in Surgical Navigation and Imaging Systems
Surgical navigation and imaging technologies, including 3D imaging, augmented reality (AR), artificial intelligence (AI), and robotic-assisted navigation platforms. These innovations provide surgeons with enhanced intraoperative guidance, accurate preoperative planning, and predictive analytics for patient-specific procedures. Integration of AI and AR also supports complex decision-making during surgeries, improving outcomes and reducing errors. For instance, in October 2025, MediView XR, Inc. closed a USD 24 million Series A funding round led by GE HealthCare, with participation from Cleveland Clinic, Mayo Clinic, Edge Ventures, and JobsOhio Growth Capital Fund. The investment reflected strong confidence from leading healthcare and technology organizations. The funding supported advancements in AR-based surgical navigation, guidance, and image fusion, accelerating innovation in surgical imaging systems and positively impacting the global navigation-assisted and image-guided surgery equipment market.
Continuous upgrades in software, real-time tracking, and cloud-based platforms are expanding the capabilities of navigation-assisted systems, making them increasingly indispensable in modern operating rooms. These technological advancements, combined with rising investments in hospital infrastructure, are significantly fueling the growth of this market.
Market Restraints:
- High Cost of Equipment and Maintenance
The high cost of equipment and maintenance, which limits adoption, particularly among small hospitals and healthcare centers in developing regions. The advanced navigation systems, imaging devices, and software platforms require substantial capital investment, specialized infrastructure, and ongoing service contracts, making them less accessible to budget-constrained facilities. Another key restraint is the requirement for skilled personnel and specialized training to operate these systems effectively. Surgeons, technicians, and operating room staff must undergo extensive training to handle navigation-assisted and image-guided equipment, which can be time-consuming and costly.
Socio Economic Impact on Navigation-assisted Surgical Equipment and Image-guided Surgery Equipment Market
The global navigation-assisted and image-guided surgery equipment market has had a substantial socioeconomic impact by revolutionizing surgical precision, patient safety, and overall healthcare efficiency. These technologies enabled surgeons to perform complex procedures with greater accuracy, reducing complications, hospital stays, and recovery times, which lowered healthcare costs and improved patient outcomes. The market also stimulated job creation across high-tech manufacturing, software development, and medical training sectors, fostering innovation and skills development. Additionally, improved surgical success rates increased public trust in healthcare systems and expanded access to advanced procedures worldwide.
Segmental Analysis:
- Navigation-assisted Surgical Equipment segment is expected to witness highest growth over the forecast period
The navigation-assisted surgical equipment segment is expected to witness significant growth due to its widespread use in complex procedures requiring precise intraoperative guidance. These systems provide real-time visualization and tracking of surgical instruments, improving accuracy and reducing the risk of complications. The adoption is particularly strong in orthopedic and spinal surgeries, where precision is critical for implant placement and alignment. Increasing demand for minimally invasive procedures and the need to enhance patient outcomes are driving investment in navigation-assisted technologies.
- Orthopedic Surgery segment is expected to witness highest growth over the forecast period
The orthopedic surgery segment dominates the market, driven by the rising prevalence of musculoskeletal disorders, joint injuries, and an aging population requiring hip, knee, and spine interventions. Navigation-assisted and image-guided systems help surgeons accurately position implants, reduce intraoperative errors, and improve post-operative recovery. Additionally, technological advancements such as 3D imaging and robotic-assisted navigation have made these systems increasingly reliable and efficient, supporting the growth of orthopedic applications.
- Hospitals segment is expected to witness highest growth over the forecast period
The hospital segment accounts for the largest market share due to its capacity to handle high volumes of surgical procedures and invest in advanced equipment. Hospitals offer integrated infrastructure, trained surgical teams, and specialized operating rooms capable of supporting navigation-assisted and image-guided technologies. Moreover, hospitals in developed regions are increasingly adopting these systems to improve surgical precision, reduce complications, and enhance overall patient care.
- North America segment is expected to witness highest growth over the forecast period
North America dominates the global market, primarily due to the presence of advanced healthcare infrastructure, high adoption of minimally invasive surgeries, and strong technological innovation in surgical navigation systems. For instance, in 2024, Orthofix Medical Inc. partnered with MRIguidance to distribute BoneMRI imaging software in the U.S. and completed the world’s first eight cases using BoneMRI with 7D’s FLASH Navigation System. The software generated synthetic CT images from MRI scans without radiation, enabling safer preoperative planning and spinal navigation. This innovation advanced technological capabilities in surgical imaging and navigation, strengthening North America’s navigation-assisted and image-guided surgery equipment market by promoting radiation-free, precision-guided procedures.
The U.S. leads the regional market, supported by favorable reimbursement policies, early adoption of advanced surgical equipment, and a growing prevalence of orthopedic and neurological disorders. Additionally, the presence of major market players and ongoing investments in research and development contribute to North America’s leadership in this space.
To Learn More About This Report - Request a Free Sample Copy
Navigation-assisted Surgical Equipment and Image-guided Surgery Equipment Market Competitive Landscape:
The competitive environment in the global navigation assisted surgical and image guided surgery equipment market is characterised by rapid innovation, consolidation through mergers & acquisitions, and strategic partnerships between technology providers, device manufacturers, and healthcare institutions. Key players focus on enhancing system compatibility, improving imaging and tracking accuracy, expanding service networks, and offering bundled platforms for neurosurgery, orthopedics, and ENT. Differentiation is increasingly achieved through software upgrades (AR/VR assistance), integration with robotic platforms, and global distribution reach.
Key Players:
- Medtronic plc
- Stryker Corporation
- Siemens Healthineers AG
- GE Healthcare
- Zimmer Biomet Holdings, Inc.
- Brainlab AG
- Intuitive Surgical, Inc.
- Accuray Incorporated
- Johnson & Johnson (DePuy Synthes)
- Varian Medical Systems, Inc.
- Globus Medical, Inc.
- Leica Microsystems GmbH
- Philips Healthcare
- OrthoPediatrics Corp.
- NuVasive, Inc.
- TransEnterix, Inc.
- Canon Medical Systems Corporation
- EOS imaging SA
- Omnis Medical Inc.
- Curon Medical Inc.
Recent Development
- In June 2025, Kauvery Hospital Alwarpet, part of the Kauvery Group, launched Chennai’s first O-ARM with Navigation System, an AI-powered surgical imaging platform. The system enhanced precision in complex brain, spine, and orthopedic surgeries, enabling improved accuracy, safety, and outcomes. Its adoption marked a significant technological advancement in surgical care, strengthening the hospital’s capabilities in image-guided and navigation-assisted procedures.
- In October 2025, Zeta Surgical announced that its Zeta TMS Navigation System received FDA 510(k) clearance as a Class II stereotaxic instrument. The system provided image-guided, real-time coil positioning for transcranial magnetic stimulation, combining 3D imaging and motion-aware tracking to maintain target alignment during patient movement. Its approval advanced precision neuropsychiatric treatments, particularly for treatment-resistant major depressive disorder, and contributed to growth and technological innovation in the navigation-assisted and image-guided surgery equipment market.
Frequently Asked Questions (FAQ) :
Q1. What are the main growth-driving factors for this market?
The market is primarily driven by the rising global demand for minimally invasive surgical procedures, as these lead to faster patient recovery and reduced complications. Technological advancements, including the integration of Artificial Intelligence (AI) and robotics with navigation systems, also boost growth. Furthermore, the increasing worldwide prevalence of neurological and orthopedic disorders requires highly precise surgical interventions.
Q2. What are the main restraining factors for this market?
A major constraint is the high initial cost associated with purchasing, installing, and maintaining advanced navigation and image-guided systems. These systems often require substantial capital expenditure, limiting their adoption to well-funded hospitals and specialized centers. Another challenge is the shortage of highly skilled surgeons and technical personnel trained to operate these sophisticated equipment effectively.
Q3. Which segment is expected to witness high growth?
The Optical Navigation Systems segment, by technology, is poised for rapid growth due to its superior accuracy during complex operations and its ability to reduce patient exposure to radiation compared to older systems. By application, the ENT (Ear, Nose, and Throat) surgery and Orthopedic surgery segments are also expected to see significant growth as navigation aids become standardized for precision implant placement and difficult procedures.
Q4. Who are the top major players for this market?
The market is characterized by several key multinational corporations specializing in medical technology. Top major players include Medtronic plc, Stryker Corporation, Brainlab AG, Zimmer Biomet Holdings, Inc., and Siemens Healthineers AG. These companies continually drive innovation through new product development and integration of cutting-edge imaging and robotics into their surgical platforms.
Q5. Which country is the largest player?
North America, particularly the United States, holds the largest market share globally. This leadership is due to its highly advanced healthcare infrastructure, high per capita healthcare spending, favorable reimbursement policies for advanced procedures, and the presence of numerous key market leaders. This environment supports the early and rapid adoption of sophisticated navigation-assisted surgical technologies.
List of Figures
Figure 1: Global Navigation-assisted Surgical Equipment and Image-guided Surgery Equipment Market Revenue Breakdown (USD Billion, %) by Region, 2022 & 2029
Figure 2: Global Navigation-assisted Surgical Equipment and Image-guided Surgery Equipment Market Value Share (%), By Segment 1, 2022 & 2029
Figure 3: Global Navigation-assisted Surgical Equipment and Image-guided Surgery Equipment Market Forecast (USD Billion), by Sub-Segment 1, 2018-2029
Figure 4: Global Navigation-assisted Surgical Equipment and Image-guided Surgery Equipment Market Forecast (USD Billion), by Sub-Segment 2, 2018-2029
Figure 5: Global Navigation-assisted Surgical Equipment and Image-guided Surgery Equipment Market Value Share (%), By Segment 2, 2022 & 2029
Figure 6: Global Navigation-assisted Surgical Equipment and Image-guided Surgery Equipment Market Forecast (USD Billion), by Sub-Segment 1, 2018-2029
Figure 7: Global Navigation-assisted Surgical Equipment and Image-guided Surgery Equipment Market Forecast (USD Billion), by Sub-Segment 2, 2018-2029
Figure 8: Global Navigation-assisted Surgical Equipment and Image-guided Surgery Equipment Market Forecast (USD Billion), by Sub-Segment 3, 2018-2029
Figure 9: Global Navigation-assisted Surgical Equipment and Image-guided Surgery Equipment Market Forecast (USD Billion), by Others, 2018-2029
Figure 10: Global Navigation-assisted Surgical Equipment and Image-guided Surgery Equipment Market Value Share (%), By Segment 3, 2022 & 2029
Figure 11: Global Navigation-assisted Surgical Equipment and Image-guided Surgery Equipment Market Forecast (USD Billion), by Sub-Segment 1, 2018-2029
Figure 12: Global Navigation-assisted Surgical Equipment and Image-guided Surgery Equipment Market Forecast (USD Billion), by Sub-Segment 2, 2018-2029
Figure 13: Global Navigation-assisted Surgical Equipment and Image-guided Surgery Equipment Market Forecast (USD Billion), by Sub-Segment 3, 2018-2029
Figure 14: Global Navigation-assisted Surgical Equipment and Image-guided Surgery Equipment Market Forecast (USD Billion), by Others, 2018-2029
Figure 15: Global Navigation-assisted Surgical Equipment and Image-guided Surgery Equipment Market Value (USD Billion), by Region, 2022 & 2029
Figure 16: North America Navigation-assisted Surgical Equipment and Image-guided Surgery Equipment Market Value Share (%), By Segment 1, 2022 & 2029
Figure 17: North America Navigation-assisted Surgical Equipment and Image-guided Surgery Equipment Market Forecast (USD Billion), by Sub-Segment 1, 2018-2029
Figure 18: North America Navigation-assisted Surgical Equipment and Image-guided Surgery Equipment Market Forecast (USD Billion), by Sub-Segment 2, 2018-2029
Figure 19: North America Navigation-assisted Surgical Equipment and Image-guided Surgery Equipment Market Value Share (%), By Segment 2, 2022 & 2029
Figure 20: North America Navigation-assisted Surgical Equipment and Image-guided Surgery Equipment Market Forecast (USD Billion), by Sub-Segment 1, 2018-2029
Figure 21: North America Navigation-assisted Surgical Equipment and Image-guided Surgery Equipment Market Forecast (USD Billion), by Sub-Segment 2, 2018-2029
Figure 22: North America Navigation-assisted Surgical Equipment and Image-guided Surgery Equipment Market Forecast (USD Billion), by Sub-Segment 3, 2018-2029
Figure 23: North America Navigation-assisted Surgical Equipment and Image-guided Surgery Equipment Market Forecast (USD Billion), by Others, 2018-2029
Figure 24: North America Navigation-assisted Surgical Equipment and Image-guided Surgery Equipment Market Value Share (%), By Segment 3, 2022 & 2029
Figure 25: North America Navigation-assisted Surgical Equipment and Image-guided Surgery Equipment Market Forecast (USD Billion), by Sub-Segment 1, 2018-2029
Figure 26: North America Navigation-assisted Surgical Equipment and Image-guided Surgery Equipment Market Forecast (USD Billion), by Sub-Segment 2, 2018-2029
Figure 27: North America Navigation-assisted Surgical Equipment and Image-guided Surgery Equipment Market Forecast (USD Billion), by Sub-Segment 3, 2018-2029
Figure 28: North America Navigation-assisted Surgical Equipment and Image-guided Surgery Equipment Market Forecast (USD Billion), by Others, 2018-2029
Figure 29: North America Navigation-assisted Surgical Equipment and Image-guided Surgery Equipment Market Forecast (USD Billion), by U.S., 2018-2029
Figure 30: North America Navigation-assisted Surgical Equipment and Image-guided Surgery Equipment Market Forecast (USD Billion), by Canada, 2018-2029
Figure 31: Latin America Navigation-assisted Surgical Equipment and Image-guided Surgery Equipment Market Value Share (%), By Segment 1, 2022 & 2029
Figure 32: Latin America Navigation-assisted Surgical Equipment and Image-guided Surgery Equipment Market Forecast (USD Billion), by Sub-Segment 1, 2018-2029
Figure 33: Latin America Navigation-assisted Surgical Equipment and Image-guided Surgery Equipment Market Forecast (USD Billion), by Sub-Segment 2, 2018-2029
Figure 34: Latin America Navigation-assisted Surgical Equipment and Image-guided Surgery Equipment Market Value Share (%), By Segment 2, 2022 & 2029
Figure 35: Latin America Navigation-assisted Surgical Equipment and Image-guided Surgery Equipment Market Forecast (USD Billion), by Sub-Segment 1, 2018-2029
Figure 36: Latin America Navigation-assisted Surgical Equipment and Image-guided Surgery Equipment Market Forecast (USD Billion), by Sub-Segment 2, 2018-2029
Figure 37: Latin America Navigation-assisted Surgical Equipment and Image-guided Surgery Equipment Market Forecast (USD Billion), by Sub-Segment 3, 2018-2029
Figure 38: Latin America Navigation-assisted Surgical Equipment and Image-guided Surgery Equipment Market Forecast (USD Billion), by Others, 2018-2029
Figure 39: Latin America Navigation-assisted Surgical Equipment and Image-guided Surgery Equipment Market Value Share (%), By Segment 3, 2022 & 2029
Figure 40: Latin America Navigation-assisted Surgical Equipment and Image-guided Surgery Equipment Market Forecast (USD Billion), by Sub-Segment 1, 2018-2029
Figure 41: Latin America Navigation-assisted Surgical Equipment and Image-guided Surgery Equipment Market Forecast (USD Billion), by Sub-Segment 2, 2018-2029
Figure 42: Latin America Navigation-assisted Surgical Equipment and Image-guided Surgery Equipment Market Forecast (USD Billion), by Sub-Segment 3, 2018-2029
Figure 43: Latin America Navigation-assisted Surgical Equipment and Image-guided Surgery Equipment Market Forecast (USD Billion), by Others, 2018-2029
Figure 44: Latin America Navigation-assisted Surgical Equipment and Image-guided Surgery Equipment Market Forecast (USD Billion), by Brazil, 2018-2029
Figure 45: Latin America Navigation-assisted Surgical Equipment and Image-guided Surgery Equipment Market Forecast (USD Billion), by Mexico, 2018-2029
Figure 46: Latin America Navigation-assisted Surgical Equipment and Image-guided Surgery Equipment Market Forecast (USD Billion), by Rest of Latin America, 2018-2029
Figure 47: Europe Navigation-assisted Surgical Equipment and Image-guided Surgery Equipment Market Value Share (%), By Segment 1, 2022 & 2029
Figure 48: Europe Navigation-assisted Surgical Equipment and Image-guided Surgery Equipment Market Forecast (USD Billion), by Sub-Segment 1, 2018-2029
Figure 49: Europe Navigation-assisted Surgical Equipment and Image-guided Surgery Equipment Market Forecast (USD Billion), by Sub-Segment 2, 2018-2029
Figure 50: Europe Navigation-assisted Surgical Equipment and Image-guided Surgery Equipment Market Value Share (%), By Segment 2, 2022 & 2029
Figure 51: Europe Navigation-assisted Surgical Equipment and Image-guided Surgery Equipment Market Forecast (USD Billion), by Sub-Segment 1, 2018-2029
Figure 52: Europe Navigation-assisted Surgical Equipment and Image-guided Surgery Equipment Market Forecast (USD Billion), by Sub-Segment 2, 2018-2029
Figure 53: Europe Navigation-assisted Surgical Equipment and Image-guided Surgery Equipment Market Forecast (USD Billion), by Sub-Segment 3, 2018-2029
Figure 54: Europe Navigation-assisted Surgical Equipment and Image-guided Surgery Equipment Market Forecast (USD Billion), by Others, 2018-2029
Figure 55: Europe Navigation-assisted Surgical Equipment and Image-guided Surgery Equipment Market Value Share (%), By Segment 3, 2022 & 2029
Figure 56: Europe Navigation-assisted Surgical Equipment and Image-guided Surgery Equipment Market Forecast (USD Billion), by Sub-Segment 1, 2018-2029
Figure 57: Europe Navigation-assisted Surgical Equipment and Image-guided Surgery Equipment Market Forecast (USD Billion), by Sub-Segment 2, 2018-2029
Figure 58: Europe Navigation-assisted Surgical Equipment and Image-guided Surgery Equipment Market Forecast (USD Billion), by Sub-Segment 3, 2018-2029
Figure 59: Europe Navigation-assisted Surgical Equipment and Image-guided Surgery Equipment Market Forecast (USD Billion), by Others, 2018-2029
Figure 60: Europe Navigation-assisted Surgical Equipment and Image-guided Surgery Equipment Market Forecast (USD Billion), by U.K., 2018-2029
Figure 61: Europe Navigation-assisted Surgical Equipment and Image-guided Surgery Equipment Market Forecast (USD Billion), by Germany, 2018-2029
Figure 62: Europe Navigation-assisted Surgical Equipment and Image-guided Surgery Equipment Market Forecast (USD Billion), by France, 2018-2029
Figure 63: Europe Navigation-assisted Surgical Equipment and Image-guided Surgery Equipment Market Forecast (USD Billion), by Italy, 2018-2029
Figure 64: Europe Navigation-assisted Surgical Equipment and Image-guided Surgery Equipment Market Forecast (USD Billion), by Spain, 2018-2029
Figure 65: Europe Navigation-assisted Surgical Equipment and Image-guided Surgery Equipment Market Forecast (USD Billion), by Russia, 2018-2029
Figure 66: Europe Navigation-assisted Surgical Equipment and Image-guided Surgery Equipment Market Forecast (USD Billion), by Rest of Europe, 2018-2029
Figure 67: Asia Pacific Navigation-assisted Surgical Equipment and Image-guided Surgery Equipment Market Value Share (%), By Segment 1, 2022 & 2029
Figure 68: Asia Pacific Navigation-assisted Surgical Equipment and Image-guided Surgery Equipment Market Forecast (USD Billion), by Sub-Segment 1, 2018-2029
Figure 69: Asia Pacific Navigation-assisted Surgical Equipment and Image-guided Surgery Equipment Market Forecast (USD Billion), by Sub-Segment 2, 2018-2029
Figure 70: Asia Pacific Navigation-assisted Surgical Equipment and Image-guided Surgery Equipment Market Value Share (%), By Segment 2, 2022 & 2029
Figure 71: Asia Pacific Navigation-assisted Surgical Equipment and Image-guided Surgery Equipment Market Forecast (USD Billion), by Sub-Segment 1, 2018-2029
Figure 72: Asia Pacific Navigation-assisted Surgical Equipment and Image-guided Surgery Equipment Market Forecast (USD Billion), by Sub-Segment 2, 2018-2029
Figure 73: Asia Pacific Navigation-assisted Surgical Equipment and Image-guided Surgery Equipment Market Forecast (USD Billion), by Sub-Segment 3, 2018-2029
Figure 74: Asia Pacific Navigation-assisted Surgical Equipment and Image-guided Surgery Equipment Market Forecast (USD Billion), by Others, 2018-2029
Figure 75: Asia Pacific Navigation-assisted Surgical Equipment and Image-guided Surgery Equipment Market Value Share (%), By Segment 3, 2022 & 2029
Figure 76: Asia Pacific Navigation-assisted Surgical Equipment and Image-guided Surgery Equipment Market Forecast (USD Billion), by Sub-Segment 1, 2018-2029
Figure 77: Asia Pacific Navigation-assisted Surgical Equipment and Image-guided Surgery Equipment Market Forecast (USD Billion), by Sub-Segment 2, 2018-2029
Figure 78: Asia Pacific Navigation-assisted Surgical Equipment and Image-guided Surgery Equipment Market Forecast (USD Billion), by Sub-Segment 3, 2018-2029
Figure 79: Asia Pacific Navigation-assisted Surgical Equipment and Image-guided Surgery Equipment Market Forecast (USD Billion), by Others, 2018-2029
Figure 80: Asia Pacific Navigation-assisted Surgical Equipment and Image-guided Surgery Equipment Market Forecast (USD Billion), by China, 2018-2029
Figure 81: Asia Pacific Navigation-assisted Surgical Equipment and Image-guided Surgery Equipment Market Forecast (USD Billion), by India, 2018-2029
Figure 82: Asia Pacific Navigation-assisted Surgical Equipment and Image-guided Surgery Equipment Market Forecast (USD Billion), by Japan, 2018-2029
Figure 83: Asia Pacific Navigation-assisted Surgical Equipment and Image-guided Surgery Equipment Market Forecast (USD Billion), by Australia, 2018-2029
Figure 84: Asia Pacific Navigation-assisted Surgical Equipment and Image-guided Surgery Equipment Market Forecast (USD Billion), by Southeast Asia, 2018-2029
Figure 85: Asia Pacific Navigation-assisted Surgical Equipment and Image-guided Surgery Equipment Market Forecast (USD Billion), by Rest of Asia Pacific, 2018-2029
Figure 86: Middle East & Africa Navigation-assisted Surgical Equipment and Image-guided Surgery Equipment Market Value Share (%), By Segment 1, 2022 & 2029
Figure 87: Middle East & Africa Navigation-assisted Surgical Equipment and Image-guided Surgery Equipment Market Forecast (USD Billion), by Sub-Segment 1, 2018-2029
Figure 88: Middle East & Africa Navigation-assisted Surgical Equipment and Image-guided Surgery Equipment Market Forecast (USD Billion), by Sub-Segment 2, 2018-2029
Figure 89: Middle East & Africa Navigation-assisted Surgical Equipment and Image-guided Surgery Equipment Market Value Share (%), By Segment 2, 2022 & 2029
Figure 90: Middle East & Africa Navigation-assisted Surgical Equipment and Image-guided Surgery Equipment Market Forecast (USD Billion), by Sub-Segment 1, 2018-2029
Figure 91: Middle East & Africa Navigation-assisted Surgical Equipment and Image-guided Surgery Equipment Market Forecast (USD Billion), by Sub-Segment 2, 2018-2029
Figure 92: Middle East & Africa Navigation-assisted Surgical Equipment and Image-guided Surgery Equipment Market Forecast (USD Billion), by Sub-Segment 3, 2018-2029
Figure 93: Middle East & Africa Navigation-assisted Surgical Equipment and Image-guided Surgery Equipment Market Forecast (USD Billion), by Others, 2018-2029
Figure 94: Middle East & Africa Navigation-assisted Surgical Equipment and Image-guided Surgery Equipment Market Value Share (%), By Segment 3, 2022 & 2029
Figure 95: Middle East & Africa Navigation-assisted Surgical Equipment and Image-guided Surgery Equipment Market Forecast (USD Billion), by Sub-Segment 1, 2018-2029
Figure 96: Middle East & Africa Navigation-assisted Surgical Equipment and Image-guided Surgery Equipment Market Forecast (USD Billion), by Sub-Segment 2, 2018-2029
Figure 97: Middle East & Africa Navigation-assisted Surgical Equipment and Image-guided Surgery Equipment Market Forecast (USD Billion), by Sub-Segment 3, 2018-2029
Figure 98: Middle East & Africa Navigation-assisted Surgical Equipment and Image-guided Surgery Equipment Market Forecast (USD Billion), by Others, 2018-2029
Figure 99: Middle East & Africa Navigation-assisted Surgical Equipment and Image-guided Surgery Equipment Market Forecast (USD Billion), by GCC, 2018-2029
Figure 100: Middle East & Africa Navigation-assisted Surgical Equipment and Image-guided Surgery Equipment Market Forecast (USD Billion), by South Africa, 2018-2029
Figure 101: Middle East & Africa Navigation-assisted Surgical Equipment and Image-guided Surgery Equipment Market Forecast (USD Billion), by Rest of Middle East & Africa, 2018-2029
List of Tables
Table 1: Global Navigation-assisted Surgical Equipment and Image-guided Surgery Equipment Market Revenue (USD Billion) Forecast, by Segment 1, 2018-2029
Table 2: Global Navigation-assisted Surgical Equipment and Image-guided Surgery Equipment Market Revenue (USD Billion) Forecast, by Segment 2, 2018-2029
Table 3: Global Navigation-assisted Surgical Equipment and Image-guided Surgery Equipment Market Revenue (USD Billion) Forecast, by Segment 3, 2018-2029
Table 4: Global Navigation-assisted Surgical Equipment and Image-guided Surgery Equipment Market Revenue (USD Billion) Forecast, by Region, 2018-2029
Table 5: North America Navigation-assisted Surgical Equipment and Image-guided Surgery Equipment Market Revenue (USD Billion) Forecast, by Segment 1, 2018-2029
Table 6: North America Navigation-assisted Surgical Equipment and Image-guided Surgery Equipment Market Revenue (USD Billion) Forecast, by Segment 2, 2018-2029
Table 7: North America Navigation-assisted Surgical Equipment and Image-guided Surgery Equipment Market Revenue (USD Billion) Forecast, by Segment 3, 2018-2029
Table 8: North America Navigation-assisted Surgical Equipment and Image-guided Surgery Equipment Market Revenue (USD Billion) Forecast, by Country, 2018-2029
Table 9: Europe Navigation-assisted Surgical Equipment and Image-guided Surgery Equipment Market Revenue (USD Billion) Forecast, by Segment 1, 2018-2029
Table 10: Europe Navigation-assisted Surgical Equipment and Image-guided Surgery Equipment Market Revenue (USD Billion) Forecast, by Segment 2, 2018-2029
Table 11: Europe Navigation-assisted Surgical Equipment and Image-guided Surgery Equipment Market Revenue (USD Billion) Forecast, by Segment 3, 2018-2029
Table 12: Europe Navigation-assisted Surgical Equipment and Image-guided Surgery Equipment Market Revenue (USD Billion) Forecast, by Country, 2018-2029
Table 13: Latin America Navigation-assisted Surgical Equipment and Image-guided Surgery Equipment Market Revenue (USD Billion) Forecast, by Segment 1, 2018-2029
Table 14: Latin America Navigation-assisted Surgical Equipment and Image-guided Surgery Equipment Market Revenue (USD Billion) Forecast, by Segment 2, 2018-2029
Table 15: Latin America Navigation-assisted Surgical Equipment and Image-guided Surgery Equipment Market Revenue (USD Billion) Forecast, by Segment 3, 2018-2029
Table 16: Latin America Navigation-assisted Surgical Equipment and Image-guided Surgery Equipment Market Revenue (USD Billion) Forecast, by Country, 2018-2029
Table 17: Asia Pacific Navigation-assisted Surgical Equipment and Image-guided Surgery Equipment Market Revenue (USD Billion) Forecast, by Segment 1, 2018-2029
Table 18: Asia Pacific Navigation-assisted Surgical Equipment and Image-guided Surgery Equipment Market Revenue (USD Billion) Forecast, by Segment 2, 2018-2029
Table 19: Asia Pacific Navigation-assisted Surgical Equipment and Image-guided Surgery Equipment Market Revenue (USD Billion) Forecast, by Segment 3, 2018-2029
Table 20: Asia Pacific Navigation-assisted Surgical Equipment and Image-guided Surgery Equipment Market Revenue (USD Billion) Forecast, by Country, 2018-2029
Table 21: Middle East & Africa Navigation-assisted Surgical Equipment and Image-guided Surgery Equipment Market Revenue (USD Billion) Forecast, by Segment 1, 2018-2029
Table 22: Middle East & Africa Navigation-assisted Surgical Equipment and Image-guided Surgery Equipment Market Revenue (USD Billion) Forecast, by Segment 2, 2018-2029
Table 23: Middle East & Africa Navigation-assisted Surgical Equipment and Image-guided Surgery Equipment Market Revenue (USD Billion) Forecast, by Segment 3, 2018-2029
Table 24: Middle East & Africa Navigation-assisted Surgical Equipment and Image-guided Surgery Equipment Market Revenue (USD Billion) Forecast, by Country, 2018-2029
Research Process
Data Library Research are conducted by industry experts who offer insight on
industry structure, market segmentations technology assessment and competitive landscape (CL), and penetration, as well as on emerging trends. Their analysis is based on primary interviews (~ 80%) and secondary research (~ 20%) as well as years of professional expertise in their respective industries. Adding to this, by analysing historical trends and current market positions, our analysts predict where the market will be headed for the next five years. Furthermore, the varying trends of segment & categories geographically presented are also studied and the estimated based on the primary & secondary research.
In this particular report from the supply side Data Library Research has conducted primary surveys (interviews) with the key level executives (VP, CEO’s, Marketing Director, Business Development Manager
and SOFT) of the companies that active & prominent as well as the midsized organization
FIGURE 1: DLR RESEARH PROCESS
![research-methodology1]()
Primary Research
Extensive primary research was conducted to gain a deeper insight of the market and industry performance. The analysis is based on both primary and secondary research as well as years of professional expertise in the respective industries.
In addition to analysing current and historical trends, our analysts predict where the market is headed over the next five years.
It varies by segment for these categories geographically presented in the list of market tables. Speaking about this particular report we have conducted primary surveys (interviews) with the key level executives (VP, CEO’s, Marketing Director, Business Development Manager and many more) of the major players active in the market.
Secondary Research
Secondary research was mainly used to collect and identify information useful for the extensive, technical, market-oriented, and Friend’s study of the Global Extra Neutral Alcohol. It was also used to obtain key information about major players, market classification and segmentation according to the industry trends, geographical markets, and developments related to the market and technology perspectives. For this study, analysts have gathered information from various credible sources, such as annual reports, sec filings, journals, white papers, SOFT presentations, and company web sites.
Market Size Estimation
Both, top-down and bottom-up approaches were used to estimate and validate the size of the Global market and to estimate the size of various other dependent submarkets in the overall Extra Neutral Alcohol. The key players in the market were identified through secondary research and their market contributions in the respective geographies were determined through primary and secondary research.
Forecast Model
![research-methodology2]()