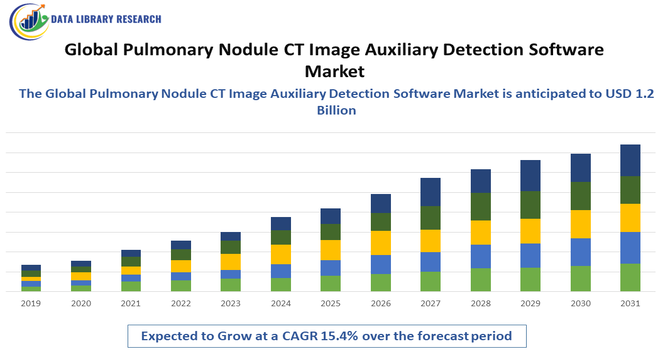
Pulmonary Nodule CT Image Auxiliary Detection Software Market Overview and Analysis:
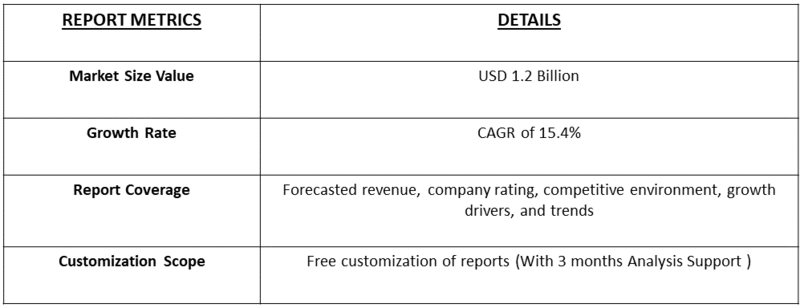
- The market is projected to reach over USD 1.2 billion in 2025 to USD 8.5 billion by 2032. The market is forecasted for very high expansion, with a CAGR of 15.4% over the forecast period, 2025-2032.
Get Complete Analysis Of The Report - Download Updated Free Sample PDF
The Global Pulmonary Nodule CT Image Auxiliary Detection Software Market is experiencing accelerated growth as the demand for advanced diagnostic solutions increases alongside rising global incidence of lung cancer and respiratory disorders. The market is driven by the expanding use of CT imaging in early lung disease screening programs, growing adoption of artificial intelligence (AI)-powered medical imaging tools, and the rising clinical need for accurate detection of small pulmonary nodules that may be missed in manual reviews.
Pulmonary Nodule CT Image Auxiliary Detection Software Market Latest Trends:
The most prominent trends in the market for pulmonary-nodule CT image auxiliary detection software is a widespread shift toward deep learning and multi-task AI frameworks that combine detection, segmentation and classification of lung nodules in a single workflow. Recent studies show these AI systems achieving sensitivities of 94 % or higher for benign and malignant nodules in non-screening CT scans. At the same time, there's strong emphasis on workflow-integration and clinician support, particularly helping less experienced radiologists improve detection sensitivity without significantly increasing false positives. Finally, regulatory approval, cloud-based deployment and integration into PACS/tele-radiology ecosystems are becoming more important, as healthcare providers seek scalable, compliant software solutions that can support high CT volume workflows and early-detection programs.
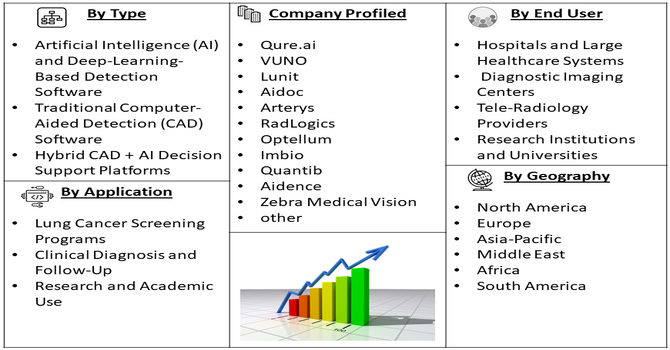
Segmentation: Global Pulmonary Nodule CT Image Auxiliary Detection Software Market is segmented By Type of Software (Artificial Intelligence (AI) and Deep-Learning-Based Detection Software, Traditional Computer-Aided Detection (CAD) Software, Hybrid CAD + AI Decision Support Platforms), Deployment Mode (Cloud-Based Solutions, On-Premise Software, Web-Hosted and Hybrid Deployment Models), Application (Lung Cancer Screening Programs, Clinical Diagnosis and Follow-Up, Research and Academic Use), End-User (Hospitals and Large Healthcare Systems, Diagnostic Imaging Centers, Tele-Radiology Providers, Research Institutions and Universities, and Geography (North America, Europe, Asia-Pacific, Middle East and Africa, and South America). The report provides the value (in USD million) for the above segments.
For Detailed Market Segmentation - Get a Free Sample PDF
Market Drivers:
- Rising Prevalence of Lung Cancer and Growing Focus on Early Detection
A major driver of this market is the increasing global burden of lung cancer, which remains one of the leading causes of cancer-related deaths. Early detection significantly improves survival rates, and pulmonary nodules are often one of the earliest radiological indicators.
In 2022, Globocan, reported that lung cancer was the most commonly diagnosed cancer and the leading cause of cancer-related deaths globally, with around 2.48 million new cases and 1.8 million deaths. Incidence and mortality varied by sex, region, and human development index (HDI). If these rates had remained stable, projections estimated 4.62 million new cases and 3.55 million deaths by 2050. This rising prevalence had driven demand for pulmonary nodule detection software, boosting market growth. As a result, healthcare systems are prioritizing the adoption of advanced CT-based screening and auxiliary detection software to identify nodules that may be too small or subtle for manual interpretation.
- Increasing Use of Artificial Intelligence and Automation in Medical Imaging
The rapid integration of AI, machine learning, and deep learning technologies in radiology workflows is another strong market driver, particularly due to their ability to enhance accuracy, speed, and consistency in CT image interpretation.
AI-powered software helps reduce the risk of diagnostic errors, enhances real-time reading support, and decreases fatigue-related oversight in high-volume settings. For instance, in April 2025, an article published by European Journal of Cardiovascular Medicine in March 2025, reported that high accuracy of AI algorithms in detecting pulmonary nodules, along with their ability to identify nodules missed by radiologists, is expected to accelerate adoption of AI-assisted detection tools in the Global Pulmonary Nodule CT Image Auxiliary Detection Software Market. This clinical validation boosts confidence, enhances early diagnosis, and drives overall market growth. The growing use of artificial intelligence and automation in medical imaging is accelerating demand for advanced pulmonary nodule detection software by improving diagnostic accuracy, efficiency, and workflow productivity.
Market Restraints:
The growth of the Global Pulmonary Nodule CT Image Auxiliary Detection Software Market is hindered by several key restraints that affect adoption and scalability across healthcare environments. One of the most significant challenges is the high development and implementation cost of advanced AI-powered detection platforms, which often require substantial investment in digital infrastructure, high-performance computing systems, and cybersecurity compliance—making deployment difficult for small and resource-limited medical facilities. Additionally, data privacy and regulatory constraints surrounding medical imaging and patient information can slow down software approval, integration, and international expansion.
Socio-Economic Impact on Pulmonary Nodule CT Image Auxiliary Detection Software Market
The growth of the Global Pulmonary Nodule CT Image Auxiliary Detection Software Market is driven by the rising prevalence of lung cancer and respiratory diseases, increasing adoption of low-dose CT screening programs, and growing awareness about early diagnosis. Advancements in artificial intelligence and deep-learning algorithms are improving the accuracy and efficiency of nodule detection, encouraging wider clinical use. Additionally, the expanding elderly population, higher demand for workflow automation in radiology, and supportive government initiatives for early lung disease detection further fuel market expansion. Integration of cloud-based solutions and improved imaging infrastructure in emerging economies also contributes to strong market growth.
Segmental Analysis:
- Artificial Intelligence (AI) and Deep-Learning-Based Detection Software segment is expected to witness the highest growth over the forecast period
This segment is experiencing strong growth as AI-powered detection systems continue to outperform traditional CAD platforms by offering improved accuracy, faster processing time, and advanced classification capabilities for malignant and benign nodules. The increasing availability of data-trained deep-learning models and regulatory approvals for AI-assisted radiology tools are accelerating adoption across hospitals and imaging centers.
- Cloud-Based Solutions segment is expected to witness the highest growth over the forecast period
Cloud-based deployment is gaining momentum due to its scalability, lower infrastructure cost, and ability to support remote access across distributed healthcare networks. As tele-radiology expands and healthcare digitization accelerates, cloud-powered AI software enables real-time collaboration, automated updates, and seamless integration with PACS and electronic health records.
- Lung Cancer Screening Programs segment is expected to witness the highest growth over the forecast period
Lung cancer screening programs represent a key growth driver as governments and healthcare providers increasingly implement large-scale CT-based early detection initiatives for high-risk populations. Advanced auxiliary detection software plays a crucial role in improving screening workflow efficiency, reducing missed nodules, and enabling stratified risk assessment during early diagnosis.
- Hospitals and Large Healthcare Systems segment is expected to witness the highest growth over the forecast period
Hospitals and large medical networks dominate end-user demand due to high imaging volume, advanced infrastructure, and adoption of integrated AI-enabled radiology workflows. These institutions prioritize automation, diagnostic accuracy, and clinical decision support tools for enhancing patient outcomes, reducing interpretation delays, and supporting multidisciplinary lung-care pathways.
- North America segment is expected to witness the highest growth over the forecast period
North America leads the market owing to advanced healthcare infrastructure, high CT scan utilization rates, strong reimbursement frameworks, and early adoption of AI-enabled medical imaging solutions. The presence of leading AI radiology technology developers and active lung cancer screening mandates further supports regional dominance and market expansion.
Additionally, rising awareness of early lung cancer detection and a growing geriatric population contribute to sustained demand for pulmonary nodule detection software in North America. For instance, The American Cancer Society estimated that in 2025, the US would see approximately 226,650 new lung cancer cases—110,680 in men and 115,970 in women. This rising prevalence of lung cancer had intensified the need for early detection and monitoring tools, driving adoption of pulmonary nodule CT image auxiliary detection software and contributing to growth in the US market.
Further, the continuous technological innovation, strategic collaborations between hospitals and AI companies, and supportive regulatory pathways such as frequent FDA clearances further strengthen the region’s position as the primary driver of market growth.
To Learn More About This Report - Request a Free Sample Copy
Pulmonary Nodule CT Image Auxiliary Detection Software Market Competitive Landscape:
The competitive landscape is dynamic and increasingly crowded, featuring large medical-device incumbents, specialised imaging software firms, and agile AI start-ups. Companies compete on algorithm accuracy, regulatory approvals, PACS/EHR integration, cloud deployment options, and clinical validation across diverse populations and CT scanner types. Strategic partnerships, acquisitions, and clinical trial evidence are common ways vendors differentiate and scale their market presence.
The major players for this market are:
- Siemens Healthineers
- GE HealthCare
- Philips Healthcare
- Canon Medical Systems
- Fujifilm Medical Systems
- Agfa HealthCare
- Riverain Technologies
- Coreline Soft
- Qure.ai
- VUNO
- Lunit
- Aidoc
- Arterys
- RadLogics
- Optellum
- Imbio
- Quantib
- Aidence
- Zebra Medical Vision
- iCAD
Recent Development
- In December 2024, research published by Scientific Reports stated that the CMYOLOv5 model’s advanced multi-modal PET/CT fusion and high accuracy in detecting irregular lung tumors are expected to strengthen the Global Pulmonary Nodule CT Image Auxiliary Detection Software Market. Its superior performance over existing methods boosts clinical confidence in AI-driven tools, encouraging wider adoption and supporting overall market growth.
- In August 2024, Qure.ai’s 510(k) FDA clearance for its CT LN Quant solution is set to boost the Global Pulmonary Nodule CT Image Auxiliary Detection Software Market by strengthening confidence in AI-based nodule analysis. Its accurate volumetric tracking supports wider clinical adoption, intensifies competition, and accelerates innovation, driving overall market growth.
Frequently Asked Questions (FAQ) :
Q1. What are the main growth-driving factors for this market?
A primary driver is the rising global incidence of lung cancer, which necessitates early and accurate detection. The growing adoption of low-dose Computed Tomography (CT) screening programs, particularly for high-risk individuals, generates massive volumes of images that require analysis. Furthermore, rapid technological integration of Artificial Intelligence (AI) and Machine Learning (ML) algorithms is enhancing diagnostic precision and efficiency.
Q2. What are the main restraining factors for this market?
Key restraints include the high initial cost associated with implementing and integrating these sophisticated software systems into existing hospital IT infrastructure. Additionally, the market faces challenges due to strict and varied regulatory approvals required across different countries for medical devices and software. The lack of awareness or reluctance among some radiologists to fully trust AI tools also acts as a constraint.
Q3. Which segment is expected to witness high growth?
The Artificial Intelligence (AI) and deep-learning-based detection software segment is expected to witness the highest growth in the Global Pulmonary Nodule CT Image Auxiliary Detection Software Market, driven by its superior accuracy, faster image analysis, and ability to reduce diagnostic errors. Increasing clinical adoption and continuous algorithm advancements further accelerate segment expansion.
Q4. Who are the top major players for this market?
The market is dominated by major medical device and technology firms, many of which integrate these solutions into their imaging hardware. Top players include GE Healthcare, Siemens Healthineers, Canon Medical Systems, and Koninklijke Philips N.V. Additionally, specialized AI software companies like InferVision and SenseTime are becoming significant contributors by focusing solely on innovative diagnostic intelligence.
Q5. Which country is the largest player?
North America, specifically the United States, holds the largest market share for this detection software. This dominance is driven by high spending on healthcare technology, a high prevalence of lung cancer screening initiatives, and the early, enthusiastic adoption of advanced AI-based diagnostic tools in major hospitals and medical centers. The presence of key industry headquarters also supports this leading position.
List of Figures
Figure 1: Global Pulmonary Nodule CT Image Auxiliary Detection Software Market Revenue Breakdown (USD Billion, %) by Region, 2022 & 2029
Figure 2: Global Pulmonary Nodule CT Image Auxiliary Detection Software Market Value Share (%), By Segment 1, 2022 & 2029
Figure 3: Global Pulmonary Nodule CT Image Auxiliary Detection Software Market Forecast (USD Billion), by Sub-Segment 1, 2018-2029
Figure 4: Global Pulmonary Nodule CT Image Auxiliary Detection Software Market Forecast (USD Billion), by Sub-Segment 2, 2018-2029
Figure 5: Global Pulmonary Nodule CT Image Auxiliary Detection Software Market Value Share (%), By Segment 2, 2022 & 2029
Figure 6: Global Pulmonary Nodule CT Image Auxiliary Detection Software Market Forecast (USD Billion), by Sub-Segment 1, 2018-2029
Figure 7: Global Pulmonary Nodule CT Image Auxiliary Detection Software Market Forecast (USD Billion), by Sub-Segment 2, 2018-2029
Figure 8: Global Pulmonary Nodule CT Image Auxiliary Detection Software Market Forecast (USD Billion), by Sub-Segment 3, 2018-2029
Figure 9: Global Pulmonary Nodule CT Image Auxiliary Detection Software Market Forecast (USD Billion), by Others, 2018-2029
Figure 10: Global Pulmonary Nodule CT Image Auxiliary Detection Software Market Value Share (%), By Segment 3, 2022 & 2029
Figure 11: Global Pulmonary Nodule CT Image Auxiliary Detection Software Market Forecast (USD Billion), by Sub-Segment 1, 2018-2029
Figure 12: Global Pulmonary Nodule CT Image Auxiliary Detection Software Market Forecast (USD Billion), by Sub-Segment 2, 2018-2029
Figure 13: Global Pulmonary Nodule CT Image Auxiliary Detection Software Market Forecast (USD Billion), by Sub-Segment 3, 2018-2029
Figure 14: Global Pulmonary Nodule CT Image Auxiliary Detection Software Market Forecast (USD Billion), by Others, 2018-2029
Figure 15: Global Pulmonary Nodule CT Image Auxiliary Detection Software Market Value (USD Billion), by Region, 2022 & 2029
Figure 16: North America Pulmonary Nodule CT Image Auxiliary Detection Software Market Value Share (%), By Segment 1, 2022 & 2029
Figure 17: North America Pulmonary Nodule CT Image Auxiliary Detection Software Market Forecast (USD Billion), by Sub-Segment 1, 2018-2029
Figure 18: North America Pulmonary Nodule CT Image Auxiliary Detection Software Market Forecast (USD Billion), by Sub-Segment 2, 2018-2029
Figure 19: North America Pulmonary Nodule CT Image Auxiliary Detection Software Market Value Share (%), By Segment 2, 2022 & 2029
Figure 20: North America Pulmonary Nodule CT Image Auxiliary Detection Software Market Forecast (USD Billion), by Sub-Segment 1, 2018-2029
Figure 21: North America Pulmonary Nodule CT Image Auxiliary Detection Software Market Forecast (USD Billion), by Sub-Segment 2, 2018-2029
Figure 22: North America Pulmonary Nodule CT Image Auxiliary Detection Software Market Forecast (USD Billion), by Sub-Segment 3, 2018-2029
Figure 23: North America Pulmonary Nodule CT Image Auxiliary Detection Software Market Forecast (USD Billion), by Others, 2018-2029
Figure 24: North America Pulmonary Nodule CT Image Auxiliary Detection Software Market Value Share (%), By Segment 3, 2022 & 2029
Figure 25: North America Pulmonary Nodule CT Image Auxiliary Detection Software Market Forecast (USD Billion), by Sub-Segment 1, 2018-2029
Figure 26: North America Pulmonary Nodule CT Image Auxiliary Detection Software Market Forecast (USD Billion), by Sub-Segment 2, 2018-2029
Figure 27: North America Pulmonary Nodule CT Image Auxiliary Detection Software Market Forecast (USD Billion), by Sub-Segment 3, 2018-2029
Figure 28: North America Pulmonary Nodule CT Image Auxiliary Detection Software Market Forecast (USD Billion), by Others, 2018-2029
Figure 29: North America Pulmonary Nodule CT Image Auxiliary Detection Software Market Forecast (USD Billion), by U.S., 2018-2029
Figure 30: North America Pulmonary Nodule CT Image Auxiliary Detection Software Market Forecast (USD Billion), by Canada, 2018-2029
Figure 31: Latin America Pulmonary Nodule CT Image Auxiliary Detection Software Market Value Share (%), By Segment 1, 2022 & 2029
Figure 32: Latin America Pulmonary Nodule CT Image Auxiliary Detection Software Market Forecast (USD Billion), by Sub-Segment 1, 2018-2029
Figure 33: Latin America Pulmonary Nodule CT Image Auxiliary Detection Software Market Forecast (USD Billion), by Sub-Segment 2, 2018-2029
Figure 34: Latin America Pulmonary Nodule CT Image Auxiliary Detection Software Market Value Share (%), By Segment 2, 2022 & 2029
Figure 35: Latin America Pulmonary Nodule CT Image Auxiliary Detection Software Market Forecast (USD Billion), by Sub-Segment 1, 2018-2029
Figure 36: Latin America Pulmonary Nodule CT Image Auxiliary Detection Software Market Forecast (USD Billion), by Sub-Segment 2, 2018-2029
Figure 37: Latin America Pulmonary Nodule CT Image Auxiliary Detection Software Market Forecast (USD Billion), by Sub-Segment 3, 2018-2029
Figure 38: Latin America Pulmonary Nodule CT Image Auxiliary Detection Software Market Forecast (USD Billion), by Others, 2018-2029
Figure 39: Latin America Pulmonary Nodule CT Image Auxiliary Detection Software Market Value Share (%), By Segment 3, 2022 & 2029
Figure 40: Latin America Pulmonary Nodule CT Image Auxiliary Detection Software Market Forecast (USD Billion), by Sub-Segment 1, 2018-2029
Figure 41: Latin America Pulmonary Nodule CT Image Auxiliary Detection Software Market Forecast (USD Billion), by Sub-Segment 2, 2018-2029
Figure 42: Latin America Pulmonary Nodule CT Image Auxiliary Detection Software Market Forecast (USD Billion), by Sub-Segment 3, 2018-2029
Figure 43: Latin America Pulmonary Nodule CT Image Auxiliary Detection Software Market Forecast (USD Billion), by Others, 2018-2029
Figure 44: Latin America Pulmonary Nodule CT Image Auxiliary Detection Software Market Forecast (USD Billion), by Brazil, 2018-2029
Figure 45: Latin America Pulmonary Nodule CT Image Auxiliary Detection Software Market Forecast (USD Billion), by Mexico, 2018-2029
Figure 46: Latin America Pulmonary Nodule CT Image Auxiliary Detection Software Market Forecast (USD Billion), by Rest of Latin America, 2018-2029
Figure 47: Europe Pulmonary Nodule CT Image Auxiliary Detection Software Market Value Share (%), By Segment 1, 2022 & 2029
Figure 48: Europe Pulmonary Nodule CT Image Auxiliary Detection Software Market Forecast (USD Billion), by Sub-Segment 1, 2018-2029
Figure 49: Europe Pulmonary Nodule CT Image Auxiliary Detection Software Market Forecast (USD Billion), by Sub-Segment 2, 2018-2029
Figure 50: Europe Pulmonary Nodule CT Image Auxiliary Detection Software Market Value Share (%), By Segment 2, 2022 & 2029
Figure 51: Europe Pulmonary Nodule CT Image Auxiliary Detection Software Market Forecast (USD Billion), by Sub-Segment 1, 2018-2029
Figure 52: Europe Pulmonary Nodule CT Image Auxiliary Detection Software Market Forecast (USD Billion), by Sub-Segment 2, 2018-2029
Figure 53: Europe Pulmonary Nodule CT Image Auxiliary Detection Software Market Forecast (USD Billion), by Sub-Segment 3, 2018-2029
Figure 54: Europe Pulmonary Nodule CT Image Auxiliary Detection Software Market Forecast (USD Billion), by Others, 2018-2029
Figure 55: Europe Pulmonary Nodule CT Image Auxiliary Detection Software Market Value Share (%), By Segment 3, 2022 & 2029
Figure 56: Europe Pulmonary Nodule CT Image Auxiliary Detection Software Market Forecast (USD Billion), by Sub-Segment 1, 2018-2029
Figure 57: Europe Pulmonary Nodule CT Image Auxiliary Detection Software Market Forecast (USD Billion), by Sub-Segment 2, 2018-2029
Figure 58: Europe Pulmonary Nodule CT Image Auxiliary Detection Software Market Forecast (USD Billion), by Sub-Segment 3, 2018-2029
Figure 59: Europe Pulmonary Nodule CT Image Auxiliary Detection Software Market Forecast (USD Billion), by Others, 2018-2029
Figure 60: Europe Pulmonary Nodule CT Image Auxiliary Detection Software Market Forecast (USD Billion), by U.K., 2018-2029
Figure 61: Europe Pulmonary Nodule CT Image Auxiliary Detection Software Market Forecast (USD Billion), by Germany, 2018-2029
Figure 62: Europe Pulmonary Nodule CT Image Auxiliary Detection Software Market Forecast (USD Billion), by France, 2018-2029
Figure 63: Europe Pulmonary Nodule CT Image Auxiliary Detection Software Market Forecast (USD Billion), by Italy, 2018-2029
Figure 64: Europe Pulmonary Nodule CT Image Auxiliary Detection Software Market Forecast (USD Billion), by Spain, 2018-2029
Figure 65: Europe Pulmonary Nodule CT Image Auxiliary Detection Software Market Forecast (USD Billion), by Russia, 2018-2029
Figure 66: Europe Pulmonary Nodule CT Image Auxiliary Detection Software Market Forecast (USD Billion), by Rest of Europe, 2018-2029
Figure 67: Asia Pacific Pulmonary Nodule CT Image Auxiliary Detection Software Market Value Share (%), By Segment 1, 2022 & 2029
Figure 68: Asia Pacific Pulmonary Nodule CT Image Auxiliary Detection Software Market Forecast (USD Billion), by Sub-Segment 1, 2018-2029
Figure 69: Asia Pacific Pulmonary Nodule CT Image Auxiliary Detection Software Market Forecast (USD Billion), by Sub-Segment 2, 2018-2029
Figure 70: Asia Pacific Pulmonary Nodule CT Image Auxiliary Detection Software Market Value Share (%), By Segment 2, 2022 & 2029
Figure 71: Asia Pacific Pulmonary Nodule CT Image Auxiliary Detection Software Market Forecast (USD Billion), by Sub-Segment 1, 2018-2029
Figure 72: Asia Pacific Pulmonary Nodule CT Image Auxiliary Detection Software Market Forecast (USD Billion), by Sub-Segment 2, 2018-2029
Figure 73: Asia Pacific Pulmonary Nodule CT Image Auxiliary Detection Software Market Forecast (USD Billion), by Sub-Segment 3, 2018-2029
Figure 74: Asia Pacific Pulmonary Nodule CT Image Auxiliary Detection Software Market Forecast (USD Billion), by Others, 2018-2029
Figure 75: Asia Pacific Pulmonary Nodule CT Image Auxiliary Detection Software Market Value Share (%), By Segment 3, 2022 & 2029
Figure 76: Asia Pacific Pulmonary Nodule CT Image Auxiliary Detection Software Market Forecast (USD Billion), by Sub-Segment 1, 2018-2029
Figure 77: Asia Pacific Pulmonary Nodule CT Image Auxiliary Detection Software Market Forecast (USD Billion), by Sub-Segment 2, 2018-2029
Figure 78: Asia Pacific Pulmonary Nodule CT Image Auxiliary Detection Software Market Forecast (USD Billion), by Sub-Segment 3, 2018-2029
Figure 79: Asia Pacific Pulmonary Nodule CT Image Auxiliary Detection Software Market Forecast (USD Billion), by Others, 2018-2029
Figure 80: Asia Pacific Pulmonary Nodule CT Image Auxiliary Detection Software Market Forecast (USD Billion), by China, 2018-2029
Figure 81: Asia Pacific Pulmonary Nodule CT Image Auxiliary Detection Software Market Forecast (USD Billion), by India, 2018-2029
Figure 82: Asia Pacific Pulmonary Nodule CT Image Auxiliary Detection Software Market Forecast (USD Billion), by Japan, 2018-2029
Figure 83: Asia Pacific Pulmonary Nodule CT Image Auxiliary Detection Software Market Forecast (USD Billion), by Australia, 2018-2029
Figure 84: Asia Pacific Pulmonary Nodule CT Image Auxiliary Detection Software Market Forecast (USD Billion), by Southeast Asia, 2018-2029
Figure 85: Asia Pacific Pulmonary Nodule CT Image Auxiliary Detection Software Market Forecast (USD Billion), by Rest of Asia Pacific, 2018-2029
Figure 86: Middle East & Africa Pulmonary Nodule CT Image Auxiliary Detection Software Market Value Share (%), By Segment 1, 2022 & 2029
Figure 87: Middle East & Africa Pulmonary Nodule CT Image Auxiliary Detection Software Market Forecast (USD Billion), by Sub-Segment 1, 2018-2029
Figure 88: Middle East & Africa Pulmonary Nodule CT Image Auxiliary Detection Software Market Forecast (USD Billion), by Sub-Segment 2, 2018-2029
Figure 89: Middle East & Africa Pulmonary Nodule CT Image Auxiliary Detection Software Market Value Share (%), By Segment 2, 2022 & 2029
Figure 90: Middle East & Africa Pulmonary Nodule CT Image Auxiliary Detection Software Market Forecast (USD Billion), by Sub-Segment 1, 2018-2029
Figure 91: Middle East & Africa Pulmonary Nodule CT Image Auxiliary Detection Software Market Forecast (USD Billion), by Sub-Segment 2, 2018-2029
Figure 92: Middle East & Africa Pulmonary Nodule CT Image Auxiliary Detection Software Market Forecast (USD Billion), by Sub-Segment 3, 2018-2029
Figure 93: Middle East & Africa Pulmonary Nodule CT Image Auxiliary Detection Software Market Forecast (USD Billion), by Others, 2018-2029
Figure 94: Middle East & Africa Pulmonary Nodule CT Image Auxiliary Detection Software Market Value Share (%), By Segment 3, 2022 & 2029
Figure 95: Middle East & Africa Pulmonary Nodule CT Image Auxiliary Detection Software Market Forecast (USD Billion), by Sub-Segment 1, 2018-2029
Figure 96: Middle East & Africa Pulmonary Nodule CT Image Auxiliary Detection Software Market Forecast (USD Billion), by Sub-Segment 2, 2018-2029
Figure 97: Middle East & Africa Pulmonary Nodule CT Image Auxiliary Detection Software Market Forecast (USD Billion), by Sub-Segment 3, 2018-2029
Figure 98: Middle East & Africa Pulmonary Nodule CT Image Auxiliary Detection Software Market Forecast (USD Billion), by Others, 2018-2029
Figure 99: Middle East & Africa Pulmonary Nodule CT Image Auxiliary Detection Software Market Forecast (USD Billion), by GCC, 2018-2029
Figure 100: Middle East & Africa Pulmonary Nodule CT Image Auxiliary Detection Software Market Forecast (USD Billion), by South Africa, 2018-2029
Figure 101: Middle East & Africa Pulmonary Nodule CT Image Auxiliary Detection Software Market Forecast (USD Billion), by Rest of Middle East & Africa, 2018-2029
List of Tables
Table 1: Global Pulmonary Nodule CT Image Auxiliary Detection Software Market Revenue (USD Billion) Forecast, by Segment 1, 2018-2029
Table 2: Global Pulmonary Nodule CT Image Auxiliary Detection Software Market Revenue (USD Billion) Forecast, by Segment 2, 2018-2029
Table 3: Global Pulmonary Nodule CT Image Auxiliary Detection Software Market Revenue (USD Billion) Forecast, by Segment 3, 2018-2029
Table 4: Global Pulmonary Nodule CT Image Auxiliary Detection Software Market Revenue (USD Billion) Forecast, by Region, 2018-2029
Table 5: North America Pulmonary Nodule CT Image Auxiliary Detection Software Market Revenue (USD Billion) Forecast, by Segment 1, 2018-2029
Table 6: North America Pulmonary Nodule CT Image Auxiliary Detection Software Market Revenue (USD Billion) Forecast, by Segment 2, 2018-2029
Table 7: North America Pulmonary Nodule CT Image Auxiliary Detection Software Market Revenue (USD Billion) Forecast, by Segment 3, 2018-2029
Table 8: North America Pulmonary Nodule CT Image Auxiliary Detection Software Market Revenue (USD Billion) Forecast, by Country, 2018-2029
Table 9: Europe Pulmonary Nodule CT Image Auxiliary Detection Software Market Revenue (USD Billion) Forecast, by Segment 1, 2018-2029
Table 10: Europe Pulmonary Nodule CT Image Auxiliary Detection Software Market Revenue (USD Billion) Forecast, by Segment 2, 2018-2029
Table 11: Europe Pulmonary Nodule CT Image Auxiliary Detection Software Market Revenue (USD Billion) Forecast, by Segment 3, 2018-2029
Table 12: Europe Pulmonary Nodule CT Image Auxiliary Detection Software Market Revenue (USD Billion) Forecast, by Country, 2018-2029
Table 13: Latin America Pulmonary Nodule CT Image Auxiliary Detection Software Market Revenue (USD Billion) Forecast, by Segment 1, 2018-2029
Table 14: Latin America Pulmonary Nodule CT Image Auxiliary Detection Software Market Revenue (USD Billion) Forecast, by Segment 2, 2018-2029
Table 15: Latin America Pulmonary Nodule CT Image Auxiliary Detection Software Market Revenue (USD Billion) Forecast, by Segment 3, 2018-2029
Table 16: Latin America Pulmonary Nodule CT Image Auxiliary Detection Software Market Revenue (USD Billion) Forecast, by Country, 2018-2029
Table 17: Asia Pacific Pulmonary Nodule CT Image Auxiliary Detection Software Market Revenue (USD Billion) Forecast, by Segment 1, 2018-2029
Table 18: Asia Pacific Pulmonary Nodule CT Image Auxiliary Detection Software Market Revenue (USD Billion) Forecast, by Segment 2, 2018-2029
Table 19: Asia Pacific Pulmonary Nodule CT Image Auxiliary Detection Software Market Revenue (USD Billion) Forecast, by Segment 3, 2018-2029
Table 20: Asia Pacific Pulmonary Nodule CT Image Auxiliary Detection Software Market Revenue (USD Billion) Forecast, by Country, 2018-2029
Table 21: Middle East & Africa Pulmonary Nodule CT Image Auxiliary Detection Software Market Revenue (USD Billion) Forecast, by Segment 1, 2018-2029
Table 22: Middle East & Africa Pulmonary Nodule CT Image Auxiliary Detection Software Market Revenue (USD Billion) Forecast, by Segment 2, 2018-2029
Table 23: Middle East & Africa Pulmonary Nodule CT Image Auxiliary Detection Software Market Revenue (USD Billion) Forecast, by Segment 3, 2018-2029
Table 24: Middle East & Africa Pulmonary Nodule CT Image Auxiliary Detection Software Market Revenue (USD Billion) Forecast, by Country, 2018-2029
Research Process
Data Library Research are conducted by industry experts who offer insight on
industry structure, market segmentations technology assessment and competitive landscape (CL), and penetration, as well as on emerging trends. Their analysis is based on primary interviews (~ 80%) and secondary research (~ 20%) as well as years of professional expertise in their respective industries. Adding to this, by analysing historical trends and current market positions, our analysts predict where the market will be headed for the next five years. Furthermore, the varying trends of segment & categories geographically presented are also studied and the estimated based on the primary & secondary research.
In this particular report from the supply side Data Library Research has conducted primary surveys (interviews) with the key level executives (VP, CEO’s, Marketing Director, Business Development Manager
and SOFT) of the companies that active & prominent as well as the midsized organization
FIGURE 1: DLR RESEARH PROCESS
![research-methodology1]()
Primary Research
Extensive primary research was conducted to gain a deeper insight of the market and industry performance. The analysis is based on both primary and secondary research as well as years of professional expertise in the respective industries.
In addition to analysing current and historical trends, our analysts predict where the market is headed over the next five years.
It varies by segment for these categories geographically presented in the list of market tables. Speaking about this particular report we have conducted primary surveys (interviews) with the key level executives (VP, CEO’s, Marketing Director, Business Development Manager and many more) of the major players active in the market.
Secondary Research
Secondary research was mainly used to collect and identify information useful for the extensive, technical, market-oriented, and Friend’s study of the Global Extra Neutral Alcohol. It was also used to obtain key information about major players, market classification and segmentation according to the industry trends, geographical markets, and developments related to the market and technology perspectives. For this study, analysts have gathered information from various credible sources, such as annual reports, sec filings, journals, white papers, SOFT presentations, and company web sites.
Market Size Estimation
Both, top-down and bottom-up approaches were used to estimate and validate the size of the Global market and to estimate the size of various other dependent submarkets in the overall Extra Neutral Alcohol. The key players in the market were identified through secondary research and their market contributions in the respective geographies were determined through primary and secondary research.
Forecast Model
![research-methodology2]()