NOR Flash Chip Packaging and Testing Service Market Overview and Analysis
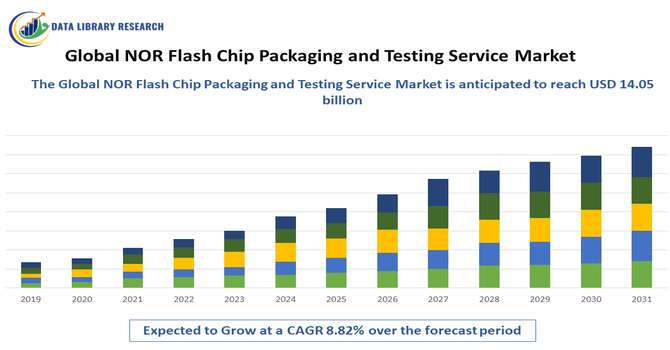
- The Global NOR Flash Chip Packaging and Testing Service Market is currently valued as USD 8.05 billion in 2025 and grow at a CAGR of 8.82% to reach USD 14.05 billion by 2035.
 Get Complete Analysis Of The Report - Download Updated Free Sample PDF
The Global NOR Flash Chip Packaging and Testing Service Market involves the production, packaging, and quality testing of NOR flash memory chips used in electronic devices for fast and reliable data storage. This market covers services that protect the delicate semiconductor chips through advanced packaging techniques and ensure their performance and reliability through rigorous testing processes. The growth of this market is driven by increasing demand for consumer electronics, automotive applications, and IoT devices, the market focuses on improving chip durability, speed, and efficiency. Key trends include the adoption of innovative packaging materials and automated testing technologies, which help manufacturers meet the growing requirements for miniaturization, enhanced performance, and cost-effective production in the semiconductor industry.
NOR Flash Chip Packaging and Testing Service Market Latest Trends
The Global NOR Flash Chip Packaging and Testing Service Market is witnessing several key trends, including the increasing adoption of advanced packaging technologies like wafer-level packaging and system-in-package to improve chip performance and miniaturization. Automation and AI-driven testing solutions are becoming more prevalent to enhance accuracy, reduce time, and lower costs. Growing demand for NOR flash memory in automotive, IoT, and consumer electronics is driving innovations in packaging materials that offer better heat dissipation and durability. Additionally, there is a focus on environmentally friendly and sustainable packaging processes. The market is also seeing collaboration between chip manufacturers and service providers to develop customized solutions that meet the evolving needs of high-performance and low-power memory applications.
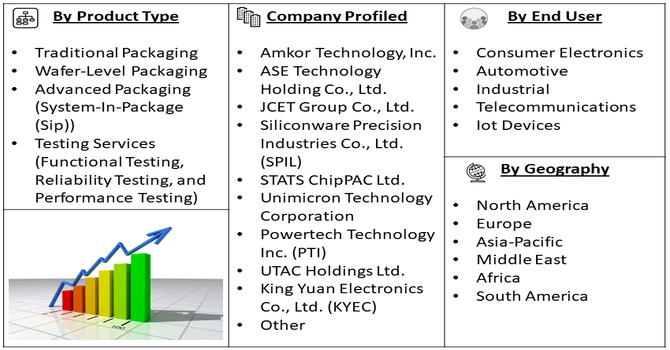
Segmentation: The Global NOR Flash Chip Packaging and Testing Service Market is segmented by Packaging Type (Traditional Packaging, Wafer-Level Packaging, and Advanced Packaging (System-In-Package (Sip)), Testing Services (Functional Testing, Reliability Testing, and Performance Testing), End-Use Industries (Consumer Electronics, Automotive, Industrial, Telecommunications, and Iot Devices) and Region (North America, Europe, Asia-Pacific, Latin America, Middle East & Africa). The report provides the value (in USD million) for the above segments.
For Detailed Market Segmentation - Get a Free Sample PDF
Market Drivers:
- Growing Demand from Consumer Electronics and IoT Devices
The increasing use of NOR flash memory chips in consumer electronics such as smartphones, tablets, and wearable devices is a major driver for the packaging and testing service market. These chips provide fast read speeds and reliable storage, which are essential for smooth device operation.
Additionally, the rapid expansion of IoT devices, which require compact, durable, and energy-efficient memory solutions, further boosts demand. For instance, in November 2024, Infineon introduced a radiation-hardened 512 Mbit QSPI NOR device designed for space systems, thereby expanding its memory portfolio to aerospace applications. The company’s strategy aimed to diversify its end markets to reduce revenue volatility and stabilize growth. As more smart gadgets enter the market, manufacturers seek advanced packaging and thorough testing services to ensure product performance and longevity. This growing reliance on NOR flash memory across diverse consumer and industrial applications fuels market growth and encourages innovations in packaging and testing technologies.
- Advancements in Packaging and Testing Technologies
Technological advancements in chip packaging and testing are driving growth in the NOR flash chip market. Innovations such as wafer-level packaging (WLP) and system-in-package (SiP) allow for smaller, faster, and more reliable chips, meeting the demand for miniaturization in modern electronics. Concurrently, automated and AI-powered testing solutions enhance accuracy, speed, and cost efficiency, reducing production time and improving yield.
In January 2025, Winbond and Infineon jointly released HYPERRAM 3.0, delivering 800 MB/s throughput aimed at IoT and automotive cluster applications. Their strategy focused on bundling complementary NOR and pSRAM products to enhance platform loyalty among system-on-chip manufacturers. These improvements not only lower manufacturing costs but also ensure higher quality and reliability, critical for applications in automotive, aerospace, and industrial sectors. As companies invest in cutting-edge packaging and testing methods, the market is expected to expand rapidly to keep pace with evolving industry requirements.
Market Restraints:
- High Costs and Complex Manufacturing Processes
The major restraint in the NOR flash chip packaging and testing market is the high cost and complexity involved in advanced packaging and testing processes. Techniques like wafer-level packaging and system-in-package require specialized equipment, skilled labor, and significant investment, which can increase production costs. Additionally, as chips become smaller and more complex, testing procedures grow more challenging, requiring sophisticated and expensive testing solutions. These factors can slow down production and limit adoption, especially among smaller manufacturers or in cost-sensitive markets. The high costs and technical challenges may hinder rapid market growth, as companies balance between innovation and affordability while meeting stringent quality standards.
Socio Economic Impact on NOR Flash Chip Packaging and Testing Service Market
The Global NOR Flash Chip Packaging and Testing Service Market has significant socio-economic impacts by supporting the growth of the semiconductor industry, which is vital for modern technology and innovation. The market drives job creation in high-tech manufacturing, research, and development, contributing to economic growth in key regions like Asia-Pacific, North America, and Europe. As NOR flash chips are crucial for consumer electronics, automotive systems, and IoT devices, advancements in packaging and testing improve product reliability and performance, enhancing everyday life and industrial efficiency. Furthermore, the push for advanced, energy-efficient memory solutions promotes sustainability and reduces electronic waste. Overall, the market fosters technological progress, boosts economic development, and supports the transition to smarter, more connected societies.
Segmental Analysis:
- Wafer-Level Packaging Segment is Expected to Witness Significant Growth Over the Forecast Period
The Wafer-Level Packaging (WLP) segment is set for substantial growth due to the escalating demand for smaller, thinner, and more power-efficient electronic devices, especially in consumer electronics and the Internet of Things (IoT). WLP offers a streamlined, cost-effective manufacturing process by integrating packaging, fabrication, and testing at the wafer level. This innovative approach significantly reduces the chip size and improves electrical performance and data transfer speed, which are critical for advanced applications like automotive systems and 5G communication components. The pursuit of miniaturization across all high-tech sectors is the primary commercial driver for this market's expansion.
- Performance Testing Segment is Expected to Witness Significant Growth Over the Forecast Period
Growth in the Performance Testing segment is directly tied to the increasing complexity and high-speed requirements of modern NOR Flash chips, particularly in industrial and automotive applications. As devices like ADAS (Advanced Driver-Assistance Systems) and edge-AI modules demand instant-boot reliability and ultra-low latency, rigorous performance testing becomes essential to ensure speed, endurance, and data integrity. The shift toward advanced protocols like Octal and xSPI interfaces in new chips necessitates sophisticated testing solutions to validate their higher bandwidth and real-time execution capabilities, driving up the market value of these specialized services.
- Telecommunications Segment is Expected to Witness Significant Growth Over the Forecast Period
The Telecommunications segment is poised for significant expansion, fueled by the global rollout and continuous development of 5G infrastructure. Modern telecom equipment—including base stations, network routers, and IoT communication modules—requires reliable, high-speed NOR Flash memory for critical firmware and quick boot-up processes. As communication systems grow more complex and data-intensive, the need for robust NOR Flash solutions that support rapid firmware updates and low-latency performance escalates. This infrastructure build-out, especially in emerging economies, is a powerful market driver for packaging and testing services tailored to high-reliability telecom components.
- Asia Pacific Region is Expected to Witness Significant Growth Over the Forecast Period
The Asia Pacific (APAC) region is forecasted to lead market growth, maintaining its position as the global hub for semiconductor manufacturing and electronics production. The region's dominance is underpinned by a robust ecosystem of leading semiconductor foundries, Outsourced Semiconductor Assembly and Test (OSAT) service providers, and major consumer electronics manufacturers (e.g., smartphones, wearables). Furthermore, rapid industrialization, massive investments in advanced automotive electronics (EVs and ADAS), and extensive 5G network deployments across countries like China, South Korea, and Taiwan are collectively creating overwhelming demand for NOR Flash chip packaging and testing services.
Strategic partnerships, mergers, and acquisitions are common as companies aim to enhance their service portfolios and geographic reach. For instance, in mArch 2025, GigaDevice, a leading semiconductor company specializing in flash memory, 32-bit microcontrollers (MCUs), sensors, analog products, and solutions, unveiled the GD25NE series of dual-power supply SPI NOR Flash, designed specifically for 1.2 V system-on-chip (SoC) applications. The GD25NE series strengthened GigaDevice’s strategic dual-power supply Flash roadmap by providing seamless compatibility with next-generation 1.2 V SoCs and eliminating the need for an external booster circuit. Offering higher performance and lower power consumption, the GD25NE series met the growing demand for advanced embedded storage, making it well-suited for wearable devices, healthcare, IoT, data center, and Edge AI applications. This launch positively impacted the APAC market by enabling the development of more energy-efficient, high-performance memory solutions, accelerating innovation in key sectors, and enhancing the region’s leadership in semiconductor technology.
| Report Matrics |
Details |
| Market Size Value |
USD 14.05 billion |
| Growth Rate |
CAGR of 8.82% |
| Forecast |
2026-2033 |
| Historical data |
2021-2024 |
| Base Year |
2025 |
| Report Coverage |
Forecasted revenue, company rating, competitive environment, growth drivers, and trends |
| Segment Coverage |
Type, Application, End-User, Geography |
| Regional Scope |
North America, Europe, Asia Pacific, Middle East |
| Customized scope |
Free customization of reports (With 3 months Analysis Support ) |
| To Learn More About This Report |
Request a Free Sample Copy |
NOR Flash Chip Packaging and Testing Service Market Competitive Landscape
The competitive landscape of the Global NOR Flash Chip Packaging and Testing Service Market is characterized by the presence of several key players striving to innovate and expand their capabilities. Leading semiconductor packaging companies and specialized testing service providers compete by investing in advanced technologies such as wafer-level packaging, system-in-package, and automated testing solutions to meet the growing demand for high-performance, reliable NOR flash memory. Additionally, firms focus on sustainability and cost-efficiency to differentiate themselves in a highly technical and rapidly evolving market. This competitive environment drives continuous innovation, improved quality, and customized solutions to serve diverse end-use industries like consumer electronics, automotive, and IoT.
The 20 major players for above market are:
- Amkor Technology, Inc.
- ASE Technology Holding Co., Ltd.
- JCET Group Co., Ltd.
- Siliconware Precision Industries Co., Ltd. (SPIL)
- STATS ChipPAC Ltd.
- Unimicron Technology Corporation
- Powertech Technology Inc. (PTI)
- UTAC Holdings Ltd.
- Hana Microelectronics Public Company Limited
- King Yuan Electronics Co., Ltd. (KYEC)
- JCET Group
- JCET Group Co., Ltd.
- ChipMOS Technologies Inc.
- Tongfu Microelectronics Co., Ltd.
- Tianshui Huatian Technology Co., Ltd.
- Texas Instruments Incorporated
- Samsung Electronics Co., Ltd.
- Micron Technology, Inc.
- Intel Corporation
- Western Digital Corporation
Recent News:
- In May 2025, Renesas Electronics Corporation, introduced a new high-performance microprocessor (MPU) in the RTOS-based RZ/A series to meet the growing demands of advanced human-machine interface (HMI) systems. The RZ/A3M MPU featured large SDRAM, SRAM, and RTOS support, enabling seamless execution of complex tasks and real-time graphical displays. It drove video and camera output on large LCD panels with resolutions up to 1280x800, addressing the display needs of next-generation home appliances, industrial and office automation, healthcare devices, and building control systems.
- In May 2025, Axiado Corporation, an AI-driven, hardware-anchored platform security solutions company, announced the next-generation Trusted Control/Compute Unit (TCU), the new Axiado AX3080. This product was the industry’s first integrated hardware security solution that combined Axiado’s TCU with memory and flash storage. By integrating DRAM, SPI Flash, and eMMC, the AX3080 enhanced platform security by eliminating potential attack surfaces, improving power efficiency, and reducing design complexity—all within a compact 25x25mm² package.
Frequently Asked Questions (FAQ) :
Q1. What are the main growth driving factors for this market?
The primary growth drivers stem from the massive increase in electronic devices across major industries. Key factors include the rising demand for high-reliability, fast-read memory in the automotive sector for Advanced Driver-Assistance Systems (ADAS) and infotainment. Furthermore, the explosive proliferation of IoT devices, smart wearables, and industrial automation fuels the need for NOR Flash, as its Execute-in-Place (XIP) capability and quick boot-up are essential for firmware storage in these compact, low-power applications. Advances in packaging and integration also enable smaller form factors, boosting the service market.
Q2. What are the main restraining factors for this market?
The market faces restraints primarily from competition from alternative memory technologies, particularly NAND flash and emerging non-volatile memory like MRAM. NAND is often preferred for applications requiring higher data density and has a lower cost per bit for large storage. Additionally, the complex and specialized manufacturing processes involved in NOR flash production, which require high precision and advanced technology, can lead to increased overall production costs, potentially hindering its scalability and adoption in certain price-sensitive applications.
Q3. Which segment is expected to witness high growth?
Based on end-user application, the Automotive Electronics and Industrial segments are expected to witness significant growth. The automotive sector, in particular, is rapidly adopting high-end NOR Flash for mission-critical applications like ADAS and electronic control units (ECUs), where fast read speed and high reliability are non-negotiable. Similarly, the Industrial segment, driven by Industry 4.0 and complex factory automation, also requires the durable, instant-boot memory that NOR Flash provides, leading to high growth for related packaging and testing services.
Q4. Who are the top major players for this market?
The market for NOR Flash chips and related services is dominated by a few key memory manufacturers and major Outsourced Semiconductor Assembly and Test (OSAT) service providers. Major chip players include Winbond Electronics Corp., Macronix International Co. Ltd., Micron Technology Inc., GigaDevice Semiconductor Inc., and Infineon Technologies AG. For the packaging and testing service market, significant global players in the OSAT space, who handle these services for the chip manufacturers, include firms like ASE Technology, Amkor Technology, and Siliconware Precision Industries (SPIL).
Q5. Which country is the largest player?
The Asia-Pacific (APAC) region is collectively the largest market player, holding the dominant share in both NOR Flash consumption and manufacturing. Within APAC, countries like China and Taiwan are central to the global supply chain, housing leading chip manufacturers (e.g., Winbond, Macronix, GigaDevice) and the majority of the world's semiconductor assembly and testing facilities. Their significant production capacity and high domestic demand for consumer electronics, automotive, and industrial applications establish APAC as the largest geographical player.
List of Figures
Figure 1: Global NOR Flash Chip Packaging and Testing Service Market Revenue Breakdown (USD Billion, %) by Region, 2023 & 2029
Figure 2: Global NOR Flash Chip Packaging and Testing Service Market Value Share (%), By Segment 1, 2023 & 2029
Figure 3: Global NOR Flash Chip Packaging and Testing Service Market Forecast (USD Billion), by Sub-Segment 1, 2018-2029
Figure 4: Global NOR Flash Chip Packaging and Testing Service Market Forecast (USD Billion), by Sub-Segment 2, 2018-2029
Figure 5: Global NOR Flash Chip Packaging and Testing Service Market Value Share (%), By Segment 2, 2023 & 2029
Figure 6: Global NOR Flash Chip Packaging and Testing Service Market Forecast (USD Billion), by Sub-Segment 1, 2018-2029
Figure 7: Global NOR Flash Chip Packaging and Testing Service Market Forecast (USD Billion), by Sub-Segment 2, 2018-2029
Figure 8: Global NOR Flash Chip Packaging and Testing Service Market Forecast (USD Billion), by Sub-Segment 3, 2018-2029
Figure 9: Global NOR Flash Chip Packaging and Testing Service Market Forecast (USD Billion), by Others, 2018-2029
Figure 10: Global NOR Flash Chip Packaging and Testing Service Market Value Share (%), By Segment 3, 2023 & 2029
Figure 11: Global NOR Flash Chip Packaging and Testing Service Market Forecast (USD Billion), by Sub-Segment 1, 2018-2029
Figure 12: Global NOR Flash Chip Packaging and Testing Service Market Forecast (USD Billion), by Sub-Segment 2, 2018-2029
Figure 13: Global NOR Flash Chip Packaging and Testing Service Market Forecast (USD Billion), by Sub-Segment 3, 2018-2029
Figure 14: Global NOR Flash Chip Packaging and Testing Service Market Forecast (USD Billion), by Others, 2018-2029
Figure 15: Global NOR Flash Chip Packaging and Testing Service Market Value (USD Billion), by Region, 2023 & 2029
Figure 16: North America NOR Flash Chip Packaging and Testing Service Market Value Share (%), By Segment 1, 2023 & 2029
Figure 17: North America NOR Flash Chip Packaging and Testing Service Market Forecast (USD Billion), by Sub-Segment 1, 2018-2029
Figure 18: North America NOR Flash Chip Packaging and Testing Service Market Forecast (USD Billion), by Sub-Segment 2, 2018-2029
Figure 19: North America NOR Flash Chip Packaging and Testing Service Market Value Share (%), By Segment 2, 2023 & 2029
Figure 20: North America NOR Flash Chip Packaging and Testing Service Market Forecast (USD Billion), by Sub-Segment 1, 2018-2029
Figure 21: North America NOR Flash Chip Packaging and Testing Service Market Forecast (USD Billion), by Sub-Segment 2, 2018-2029
Figure 22: North America NOR Flash Chip Packaging and Testing Service Market Forecast (USD Billion), by Sub-Segment 3, 2018-2029
Figure 23: North America NOR Flash Chip Packaging and Testing Service Market Forecast (USD Billion), by Others, 2018-2029
Figure 24: North America NOR Flash Chip Packaging and Testing Service Market Value Share (%), By Segment 3, 2023 & 2029
Figure 25: North America NOR Flash Chip Packaging and Testing Service Market Forecast (USD Billion), by Sub-Segment 1, 2018-2029
Figure 26: North America NOR Flash Chip Packaging and Testing Service Market Forecast (USD Billion), by Sub-Segment 2, 2018-2029
Figure 27: North America NOR Flash Chip Packaging and Testing Service Market Forecast (USD Billion), by Sub-Segment 3, 2018-2029
Figure 28: North America NOR Flash Chip Packaging and Testing Service Market Forecast (USD Billion), by Others, 2018-2029
Figure 29: North America NOR Flash Chip Packaging and Testing Service Market Forecast (USD Billion), by U.S., 2018-2029
Figure 30: North America NOR Flash Chip Packaging and Testing Service Market Forecast (USD Billion), by Canada, 2018-2029
Figure 31: Latin America NOR Flash Chip Packaging and Testing Service Market Value Share (%), By Segment 1, 2023 & 2029
Figure 32: Latin America NOR Flash Chip Packaging and Testing Service Market Forecast (USD Billion), by Sub-Segment 1, 2018-2029
Figure 33: Latin America NOR Flash Chip Packaging and Testing Service Market Forecast (USD Billion), by Sub-Segment 2, 2018-2029
Figure 34: Latin America NOR Flash Chip Packaging and Testing Service Market Value Share (%), By Segment 2, 2023 & 2029
Figure 35: Latin America NOR Flash Chip Packaging and Testing Service Market Forecast (USD Billion), by Sub-Segment 1, 2018-2029
Figure 36: Latin America NOR Flash Chip Packaging and Testing Service Market Forecast (USD Billion), by Sub-Segment 2, 2018-2029
Figure 37: Latin America NOR Flash Chip Packaging and Testing Service Market Forecast (USD Billion), by Sub-Segment 3, 2018-2029
Figure 38: Latin America NOR Flash Chip Packaging and Testing Service Market Forecast (USD Billion), by Others, 2018-2029
Figure 39: Latin America NOR Flash Chip Packaging and Testing Service Market Value Share (%), By Segment 3, 2023 & 2029
Figure 40: Latin America NOR Flash Chip Packaging and Testing Service Market Forecast (USD Billion), by Sub-Segment 1, 2018-2029
Figure 41: Latin America NOR Flash Chip Packaging and Testing Service Market Forecast (USD Billion), by Sub-Segment 2, 2018-2029
Figure 42: Latin America NOR Flash Chip Packaging and Testing Service Market Forecast (USD Billion), by Sub-Segment 3, 2018-2029
Figure 43: Latin America NOR Flash Chip Packaging and Testing Service Market Forecast (USD Billion), by Others, 2018-2029
Figure 44: Latin America NOR Flash Chip Packaging and Testing Service Market Forecast (USD Billion), by Brazil, 2018-2029
Figure 45: Latin America NOR Flash Chip Packaging and Testing Service Market Forecast (USD Billion), by Mexico, 2018-2029
Figure 46: Latin America NOR Flash Chip Packaging and Testing Service Market Forecast (USD Billion), by Rest of Latin America, 2018-2029
Figure 47: Europe NOR Flash Chip Packaging and Testing Service Market Value Share (%), By Segment 1, 2023 & 2029
Figure 48: Europe NOR Flash Chip Packaging and Testing Service Market Forecast (USD Billion), by Sub-Segment 1, 2018-2029
Figure 49: Europe NOR Flash Chip Packaging and Testing Service Market Forecast (USD Billion), by Sub-Segment 2, 2018-2029
Figure 50: Europe NOR Flash Chip Packaging and Testing Service Market Value Share (%), By Segment 2, 2023 & 2029
Figure 51: Europe NOR Flash Chip Packaging and Testing Service Market Forecast (USD Billion), by Sub-Segment 1, 2018-2029
Figure 52: Europe NOR Flash Chip Packaging and Testing Service Market Forecast (USD Billion), by Sub-Segment 2, 2018-2029
Figure 53: Europe NOR Flash Chip Packaging and Testing Service Market Forecast (USD Billion), by Sub-Segment 3, 2018-2029
Figure 54: Europe NOR Flash Chip Packaging and Testing Service Market Forecast (USD Billion), by Others, 2018-2029
Figure 55: Europe NOR Flash Chip Packaging and Testing Service Market Value Share (%), By Segment 3, 2023 & 2029
Figure 56: Europe NOR Flash Chip Packaging and Testing Service Market Forecast (USD Billion), by Sub-Segment 1, 2018-2029
Figure 57: Europe NOR Flash Chip Packaging and Testing Service Market Forecast (USD Billion), by Sub-Segment 2, 2018-2029
Figure 58: Europe NOR Flash Chip Packaging and Testing Service Market Forecast (USD Billion), by Sub-Segment 3, 2018-2029
Figure 59: Europe NOR Flash Chip Packaging and Testing Service Market Forecast (USD Billion), by Others, 2018-2029
Figure 60: Europe NOR Flash Chip Packaging and Testing Service Market Forecast (USD Billion), by U.K., 2018-2029
Figure 61: Europe NOR Flash Chip Packaging and Testing Service Market Forecast (USD Billion), by Germany, 2018-2029
Figure 62: Europe NOR Flash Chip Packaging and Testing Service Market Forecast (USD Billion), by France, 2018-2029
Figure 63: Europe NOR Flash Chip Packaging and Testing Service Market Forecast (USD Billion), by Italy, 2018-2029
Figure 64: Europe NOR Flash Chip Packaging and Testing Service Market Forecast (USD Billion), by Spain, 2018-2029
Figure 65: Europe NOR Flash Chip Packaging and Testing Service Market Forecast (USD Billion), by Russia, 2018-2029
Figure 66: Europe NOR Flash Chip Packaging and Testing Service Market Forecast (USD Billion), by Rest of Europe, 2018-2029
Figure 67: Asia Pacific NOR Flash Chip Packaging and Testing Service Market Value Share (%), By Segment 1, 2023 & 2029
Figure 68: Asia Pacific NOR Flash Chip Packaging and Testing Service Market Forecast (USD Billion), by Sub-Segment 1, 2018-2029
Figure 69: Asia Pacific NOR Flash Chip Packaging and Testing Service Market Forecast (USD Billion), by Sub-Segment 2, 2018-2029
Figure 70: Asia Pacific NOR Flash Chip Packaging and Testing Service Market Value Share (%), By Segment 2, 2023 & 2029
Figure 71: Asia Pacific NOR Flash Chip Packaging and Testing Service Market Forecast (USD Billion), by Sub-Segment 1, 2018-2029
Figure 72: Asia Pacific NOR Flash Chip Packaging and Testing Service Market Forecast (USD Billion), by Sub-Segment 2, 2018-2029
Figure 73: Asia Pacific NOR Flash Chip Packaging and Testing Service Market Forecast (USD Billion), by Sub-Segment 3, 2018-2029
Figure 74: Asia Pacific NOR Flash Chip Packaging and Testing Service Market Forecast (USD Billion), by Others, 2018-2029
Figure 75: Asia Pacific NOR Flash Chip Packaging and Testing Service Market Value Share (%), By Segment 3, 2023 & 2029
Figure 76: Asia Pacific NOR Flash Chip Packaging and Testing Service Market Forecast (USD Billion), by Sub-Segment 1, 2018-2029
Figure 77: Asia Pacific NOR Flash Chip Packaging and Testing Service Market Forecast (USD Billion), by Sub-Segment 2, 2018-2029
Figure 78: Asia Pacific NOR Flash Chip Packaging and Testing Service Market Forecast (USD Billion), by Sub-Segment 3, 2018-2029
Figure 79: Asia Pacific NOR Flash Chip Packaging and Testing Service Market Forecast (USD Billion), by Others, 2018-2029
Figure 80: Asia Pacific NOR Flash Chip Packaging and Testing Service Market Forecast (USD Billion), by China, 2018-2029
Figure 81: Asia Pacific NOR Flash Chip Packaging and Testing Service Market Forecast (USD Billion), by India, 2018-2029
Figure 82: Asia Pacific NOR Flash Chip Packaging and Testing Service Market Forecast (USD Billion), by Japan, 2018-2029
Figure 83: Asia Pacific NOR Flash Chip Packaging and Testing Service Market Forecast (USD Billion), by Australia, 2018-2029
Figure 84: Asia Pacific NOR Flash Chip Packaging and Testing Service Market Forecast (USD Billion), by Southeast Asia, 2018-2029
Figure 85: Asia Pacific NOR Flash Chip Packaging and Testing Service Market Forecast (USD Billion), by Rest of Asia Pacific, 2018-2029
Figure 86: Middle East & Africa NOR Flash Chip Packaging and Testing Service Market Value Share (%), By Segment 1, 2023 & 2029
Figure 87: Middle East & Africa NOR Flash Chip Packaging and Testing Service Market Forecast (USD Billion), by Sub-Segment 1, 2018-2029
Figure 88: Middle East & Africa NOR Flash Chip Packaging and Testing Service Market Forecast (USD Billion), by Sub-Segment 2, 2018-2029
Figure 89: Middle East & Africa NOR Flash Chip Packaging and Testing Service Market Value Share (%), By Segment 2, 2023 & 2029
Figure 90: Middle East & Africa NOR Flash Chip Packaging and Testing Service Market Forecast (USD Billion), by Sub-Segment 1, 2018-2029
Figure 91: Middle East & Africa NOR Flash Chip Packaging and Testing Service Market Forecast (USD Billion), by Sub-Segment 2, 2018-2029
Figure 92: Middle East & Africa NOR Flash Chip Packaging and Testing Service Market Forecast (USD Billion), by Sub-Segment 3, 2018-2029
Figure 93: Middle East & Africa NOR Flash Chip Packaging and Testing Service Market Forecast (USD Billion), by Others, 2018-2029
Figure 94: Middle East & Africa NOR Flash Chip Packaging and Testing Service Market Value Share (%), By Segment 3, 2023 & 2029
Figure 95: Middle East & Africa NOR Flash Chip Packaging and Testing Service Market Forecast (USD Billion), by Sub-Segment 1, 2018-2029
Figure 96: Middle East & Africa NOR Flash Chip Packaging and Testing Service Market Forecast (USD Billion), by Sub-Segment 2, 2018-2029
Figure 97: Middle East & Africa NOR Flash Chip Packaging and Testing Service Market Forecast (USD Billion), by Sub-Segment 3, 2018-2029
Figure 98: Middle East & Africa NOR Flash Chip Packaging and Testing Service Market Forecast (USD Billion), by Others, 2018-2029
Figure 99: Middle East & Africa NOR Flash Chip Packaging and Testing Service Market Forecast (USD Billion), by GCC, 2018-2029
Figure 100: Middle East & Africa NOR Flash Chip Packaging and Testing Service Market Forecast (USD Billion), by South Africa, 2018-2029
Figure 101: Middle East & Africa NOR Flash Chip Packaging and Testing Service Market Forecast (USD Billion), by Rest of Middle East & Africa, 2018-2029
List of Tables
Table 1: Global NOR Flash Chip Packaging and Testing Service Market Revenue (USD Billion) Forecast, by Segment 1, 2018-2029
Table 2: Global NOR Flash Chip Packaging and Testing Service Market Revenue (USD Billion) Forecast, by Segment 2, 2018-2029
Table 3: Global NOR Flash Chip Packaging and Testing Service Market Revenue (USD Billion) Forecast, by Segment 3, 2018-2029
Table 4: Global NOR Flash Chip Packaging and Testing Service Market Revenue (USD Billion) Forecast, by Region, 2018-2029
Table 5: North America NOR Flash Chip Packaging and Testing Service Market Revenue (USD Billion) Forecast, by Segment 1, 2018-2029
Table 6: North America NOR Flash Chip Packaging and Testing Service Market Revenue (USD Billion) Forecast, by Segment 2, 2018-2029
Table 7: North America NOR Flash Chip Packaging and Testing Service Market Revenue (USD Billion) Forecast, by Segment 3, 2018-2029
Table 8: North America NOR Flash Chip Packaging and Testing Service Market Revenue (USD Billion) Forecast, by Country, 2018-2029
Table 9: Europe NOR Flash Chip Packaging and Testing Service Market Revenue (USD Billion) Forecast, by Segment 1, 2018-2029
Table 10: Europe NOR Flash Chip Packaging and Testing Service Market Revenue (USD Billion) Forecast, by Segment 2, 2018-2029
Table 11: Europe NOR Flash Chip Packaging and Testing Service Market Revenue (USD Billion) Forecast, by Segment 3, 2018-2029
Table 12: Europe NOR Flash Chip Packaging and Testing Service Market Revenue (USD Billion) Forecast, by Country, 2018-2029
Table 13: Latin America NOR Flash Chip Packaging and Testing Service Market Revenue (USD Billion) Forecast, by Segment 1, 2018-2029
Table 14: Latin America NOR Flash Chip Packaging and Testing Service Market Revenue (USD Billion) Forecast, by Segment 2, 2018-2029
Table 15: Latin America NOR Flash Chip Packaging and Testing Service Market Revenue (USD Billion) Forecast, by Segment 3, 2018-2029
Table 16: Latin America NOR Flash Chip Packaging and Testing Service Market Revenue (USD Billion) Forecast, by Country, 2018-2029
Table 17: Asia Pacific NOR Flash Chip Packaging and Testing Service Market Revenue (USD Billion) Forecast, by Segment 1, 2018-2029
Table 18: Asia Pacific NOR Flash Chip Packaging and Testing Service Market Revenue (USD Billion) Forecast, by Segment 2, 2018-2029
Table 19: Asia Pacific NOR Flash Chip Packaging and Testing Service Market Revenue (USD Billion) Forecast, by Segment 3, 2018-2029
Table 20: Asia Pacific NOR Flash Chip Packaging and Testing Service Market Revenue (USD Billion) Forecast, by Country, 2018-2029
Table 21: Middle East & Africa NOR Flash Chip Packaging and Testing Service Market Revenue (USD Billion) Forecast, by Segment 1, 2018-2029
Table 22: Middle East & Africa NOR Flash Chip Packaging and Testing Service Market Revenue (USD Billion) Forecast, by Segment 2, 2018-2029
Table 23: Middle East & Africa NOR Flash Chip Packaging and Testing Service Market Revenue (USD Billion) Forecast, by Segment 3, 2018-2029
Table 24: Middle East & Africa NOR Flash Chip Packaging and Testing Service Market Revenue (USD Billion) Forecast, by Country, 2018-2029
Research Process
Data Library Research are conducted by industry experts who offer insight on
industry structure, market segmentations technology assessment and competitive landscape (CL), and penetration, as well as on emerging trends. Their analysis is based on primary interviews (~ 80%) and secondary research (~ 20%) as well as years of professional expertise in their respective industries. Adding to this, by analysing historical trends and current market positions, our analysts predict where the market will be headed for the next five years. Furthermore, the varying trends of segment & categories geographically presented are also studied and the estimated based on the primary & secondary research.
In this particular report from the supply side Data Library Research has conducted primary surveys (interviews) with the key level executives (VP, CEO’s, Marketing Director, Business Development Manager
and SOFT) of the companies that active & prominent as well as the midsized organization
FIGURE 1: DLR RESEARH PROCESS
![research-methodology1]()
Primary Research
Extensive primary research was conducted to gain a deeper insight of the market and industry performance. The analysis is based on both primary and secondary research as well as years of professional expertise in the respective industries.
In addition to analysing current and historical trends, our analysts predict where the market is headed over the next five years.
It varies by segment for these categories geographically presented in the list of market tables. Speaking about this particular report we have conducted primary surveys (interviews) with the key level executives (VP, CEO’s, Marketing Director, Business Development Manager and many more) of the major players active in the market.
Secondary Research
Secondary research was mainly used to collect and identify information useful for the extensive, technical, market-oriented, and Friend’s study of the Global Extra Neutral Alcohol. It was also used to obtain key information about major players, market classification and segmentation according to the industry trends, geographical markets, and developments related to the market and technology perspectives. For this study, analysts have gathered information from various credible sources, such as annual reports, sec filings, journals, white papers, SOFT presentations, and company web sites.
Market Size Estimation
Both, top-down and bottom-up approaches were used to estimate and validate the size of the Global market and to estimate the size of various other dependent submarkets in the overall Extra Neutral Alcohol. The key players in the market were identified through secondary research and their market contributions in the respective geographies were determined through primary and secondary research.
Forecast Model
![research-methodology2]()