Paper And Packaging Testing Instrument Market Overview and Analysis
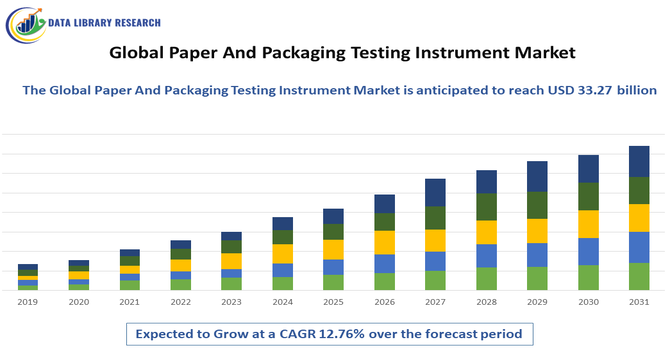
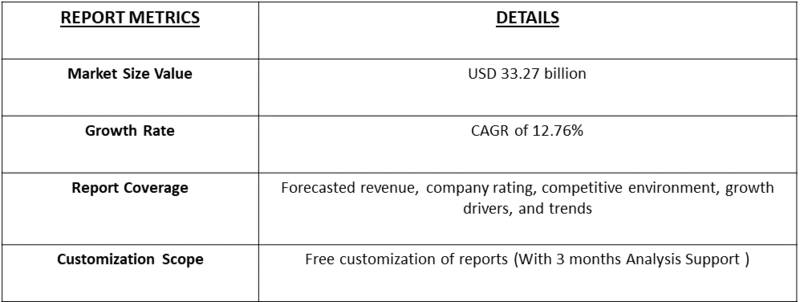
- The Global Paper and Packaging Testing Instrument Market size was estimated at USD 13.32 billion in 2026 and is predicted to be worth around USD 33.27 billion by 2033, growing with a CAGR of 12.76% from 2026-2033.
Get Complete Analysis Of The Report - Download Updated Free Sample PDF
The Global Paper and Packaging Testing Instrument Market encompasses devices and equipment designed to assess the physical, mechanical, and chemical properties of paper, cardboard, and packaging materials. These instruments measure parameters such as tensile strength, burst strength, grammage, thickness, folding endurance, moisture content, and barrier performance to ensure quality, durability, and compliance with industry standards. Rising demand for sustainable and recyclable packaging, increasing e-commerce shipments, and stringent regulatory requirements for food, pharmaceutical, and consumer goods packaging are driving market growth.
Paper And Packaging Testing Instrument Market Latest Trends
The global paper and packaging testing instrument market is witnessing strong growth due to increasing demand for sustainable, recyclable, and high-quality packaging materials. Automation and digitalization are key trends, with instruments offering real-time data analysis, remote monitoring, and integration with Industry 4.0 systems. Rising e-commerce and rapid growth in the food, pharmaceutical, and consumer goods sectors are driving the need for precise testing of strength, barrier properties, and durability. Additionally, regulatory compliance and sustainability standards are encouraging manufacturers to adopt advanced testing instruments, ensuring consistent product quality and meeting global environmental and safety requirements.
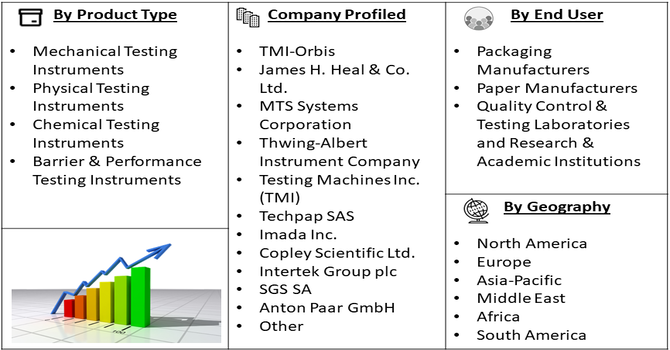
Segmentation: The Global Paper and Packaging Testing Instrument Market is segmented by Product Type (Mechanical Testing Instruments, Physical Testing Instruments, Chemical Testing Instruments and Barrier & Performance Testing Instruments), Material Type (Paper, Cardboard/Carton and Flexible Packaging Materials), End-User (Packaging Manufacturers, Paper Manufacturers, Quality Control & Testing Laboratories and Research & Academic Institutions), and Geography (North America, Europe, Asia-Pacific, Middle East and Africa, and South America). The report provides the value (in USD million) for the above segments.
For Detailed Market Segmentation - Get a Free Sample PDF
Market Drivers:
- Demand for High-Quality and Sustainable Packaging
The global paper and packaging testing instrument market is driven by the increasing demand for high-quality, sustainable packaging materials. Manufacturers are under pressure to ensure that packaging meets rigorous standards for durability, safety, and environmental compliance. Advanced testing instruments such as tensile testers, burst testers, and moisture analyzers allow producers to maintain consistent quality while adhering to sustainability initiatives. Governments and regulatory bodies worldwide are enforcing stricter guidelines on packaging materials, pushing companies to invest in accurate and reliable testing solutions. This growing focus on sustainable and high-performance packaging continues to fuel market expansion globally.
- Growth of E-Commerce and Logistics
The rapid growth of e-commerce and global logistics is another major driver for the paper and packaging testing instrument market. As online shopping volumes increase, the demand for durable packaging that protects products during transit is also rising. Businesses rely on testing instruments to evaluate packaging strength, compression resistance, and drop performance, ensuring products arrive undamaged. The need for efficient and reliable packaging solutions in supply chains encourages manufacturers to adopt advanced testing technologies. This trend is particularly prominent in regions with booming e-commerce sectors, where packaging performance directly impacts customer satisfaction and brand reputation, thereby driving market growth.
Market Restraints
Despite growth opportunities, the global paper and packaging testing instrument market faces significant restraints due to the high cost of advanced equipment. Instruments like automated tensile testers, multi-function testers, and environmental testing chambers involve substantial capital investment, which can be prohibitive for small and medium-sized enterprises. Maintenance, calibration, and training costs further increase the financial burden, limiting widespread adoption. In price-sensitive markets, companies may opt for manual or less sophisticated testing methods, reducing the overall demand for high-end instruments. These cost-related challenges slow market penetration, particularly in developing regions, and create a barrier for smaller players to fully leverage the benefits of advanced testing technologies.
Socioeconomic Impact on Paper And Packaging Testing Instrument Market
The market significantly impacts the global economy by supporting quality assurance in paper and packaging manufacturing. It creates employment opportunities for engineers, laboratory technicians, and R&D personnel. Improved testing ensures safer, more reliable packaging for pharmaceuticals, food, and consumer goods, protecting public health and fostering consumer confidence. Efficient packaging testing reduces material wastage, supporting sustainable manufacturing practices. Moreover, technological advancements in testing instruments drive innovation, productivity, and competitiveness within the packaging industry. Developing regions benefit from infrastructure investments in testing laboratories, contributing to industrial growth, skill development, and the adoption of international standards in paper and packaging production.
Segmental Analysis:
- Mechanical Testing Instruments segment is expected to witness highest growth over the forecast period
The mechanical testing instruments segment is anticipated to witness the highest growth over the forecast period due to increasing demand for quality control and material performance evaluation across industries. Advancements in technology, including automated and precise testing devices, are driving adoption in manufacturing, automotive, aerospace, and construction sectors. Rising awareness of product safety standards and regulatory compliance further fuels the market. Additionally, the need to assess mechanical properties such as tensile strength, hardness, and fatigue resistance is prompting industries to invest in advanced testing instruments. The integration of digital solutions and real-time monitoring is expected to accelerate market growth.
- Paper segment is expected to witness highest growth over the forecast period
The paper segment is projected to experience the highest growth during the forecast period, driven by rising demand in packaging, printing, and stationery applications. Growing e-commerce, retail, and foodservice industries are significantly contributing to increased consumption of paper-based products. Sustainability trends and the push for eco-friendly alternatives to plastic are boosting the adoption of paper packaging. Innovations in specialty papers for printing and industrial use are further expanding market potential. Additionally, government initiatives supporting recycling and the use of biodegradable materials are encouraging market growth. The combination of rising consumer awareness and industrial demand positions the paper segment for strong expansion.
- Packaging Manufacturers segment is expected to witness highest growth over the forecast period
The packaging manufacturers segment is expected to witness the highest growth over the forecast period, fueled by the booming e-commerce, food, and consumer goods industries. Increasing urbanization and disposable income are driving demand for innovative, convenient, and sustainable packaging solutions. Manufacturers are adopting advanced materials, automation, and smart packaging technologies to enhance product safety, shelf appeal, and supply chain efficiency. Growing emphasis on reducing plastic usage and increasing biodegradable and recyclable packaging solutions further strengthens market prospects. The trend toward customized and digitally connected packaging is also contributing to growth. Thus, robust industrial demand and consumer preference for sustainable options are key drivers
- Asia-Pacific Region is expected to witness highest growth over the forecast period
The Asia-Pacific region is expected to experience the highest growth over the forecast period due to rapid industrialization, urbanization, and rising consumer spending.
Expanding manufacturing sectors in countries such as China, India, Japan, and South Korea are boosting demand for machinery, materials, and testing instruments. For instance, in 2022, Cepi’s new laboratory-based test method for evaluating paper recyclability is expected to drive growth in the Asia-Pacific paper and packaging testing instrument market. By simulating industrial recycling processes, the method enables manufacturers to assess sustainability and circularity of paper products accurately. Developed in collaboration with industry stakeholders like 4evergreen, it enhances quality control, supports eco-friendly practices, and encourages adoption of advanced testing solutions across the region’s expanding paper and packaging industry.
The growth of e-commerce and packaged goods industries is driving consumption of packaging solutions. Additionally, supportive government policies, infrastructure development, and foreign investments are fueling regional market expansion. Rising technological adoption, coupled with increasing awareness of quality standards and sustainability, further strengthens market growth prospects. The Asia-Pacific region is poised to remain a global hub of industrial and economic activity.
To Learn More About This Report - Request a Free Sample Copy
Paper And Packaging Testing Instrument Market Competitive Landscape
The competitive landscape of the paper and packaging testing instrument market is moderately consolidated, with key players leading through product innovation, digital integration, and global distribution networks. Leading companies such as TMI-Orbis, James H. Heal & Co., MTS Systems, Testing Machines Inc., and Thwing-Albert Instrument Company compete by offering advanced mechanical, physical, and chemical testing solutions. Strategic partnerships, mergers, and acquisitions expand product portfolios and geographic reach.
The major players for above market are:
- TMI-Orbis
- James H. Heal & Co. Ltd.
- MTS Systems Corporation
- Thwing-Albert Instrument Company
- Testing Machines Inc. (TMI)
- Techpap SAS
- Imada Inc.
- Copley Scientific Ltd.
- Intertek Group plc
- SGS SA
- Anton Paar GmbH
- Labthink Instruments Co., Ltd.
- Taber Industries
- Lenzing Instruments GmbH
- QLab Instruments
- Shimadzu Corporation
- PCE Instruments
- Instron (Illinois Tool Works)
- Data Physics Instruments
- Bruker Corporation
Recent Development
- In 2023, ABB’s enhanced L&W Bending Tester is set to positively impact the global paper and packaging testing instrument market by offering more reliable, operator-independent bending resistance and stiffness measurements. Its user-friendly touchscreen, improved post-processing, and seamless integration with ABB’s Lab Management System and MES enable efficient quality data management. This advancement boosts testing accuracy, operational efficiency, and connectivity, driving adoption in paper and packaging industries worldwide and supporting overall market growth.
- In 2022, PACORR Testing Instruments’ new Box Compression Tester (Digital) is set to strengthen the global paper and packaging testing instrument market by enabling manufacturers to accurately assess the strength and quality of corrugated boxes. Compliant with international standards such as ASTM D642 and D4169, and equipped with advanced features for precise analysis, the tester enhances reliability, efficiency, and quality control, driving wider adoption across the paper and packaging industry worldwide.
Frequently Asked Questions (FAQ) :
Q1. What are the main growth-driving factors for this market?
The surge in e-commerce remains a primary driver, necessitating rigorous durability testing for transit packaging. Additionally, increasing consumer demand for sustainable materials is forcing manufacturers to adopt testing instruments to ensure eco-friendly alternatives meet strength standards. Stricter international regulations regarding food safety and pharmaceutical packaging integrity also mandate precise quality control.
Q2. What are the main restraining factors for this market?
High initial investment costs for advanced digital testing equipment can deter small-to-medium enterprises from upgrading their facilities. Furthermore, the volatility of raw material prices in the paper industry often leads to reduced capital expenditure for quality control departments. Technical complexities and the need for skilled personnel to operate sophisticated machinery also limit adoption.
Q3. Which segment is expected to witness high growth?
The packaging manufacturers segment is expected to witness the highest growth over the forecast period, driven by rising e-commerce, food, and consumer goods demand. Increasing focus on sustainable, biodegradable, and innovative packaging solutions, coupled with automation and smart technologies, is fueling market expansion and meeting evolving consumer and industrial requirements.
Q4. Who are the top major players for this market?
Key industry participants include Testing Machines Inc. (TMI), Industrial Physics, Instron, Thwing-Albert Instrument Company, and ZwickRoell. These companies specialize in high-precision tools such as burst testers, thickness gauges, and compression testers. They maintain market leadership through continuous innovation in digital data integration and automated testing software solutions.
Q5. Which country is the largest player?
China is currently the largest player in this market, fueled by its massive manufacturing sector and dominant role in global exports. The country’s rapid expansion of domestic paper production and its sophisticated e-commerce infrastructure drive the localized need for high-volume quality assurance testing instruments across various industrial packaging applications.
List of Figures
Figure 1: Global Paper And Packaging Testing Instrument Market Revenue Breakdown (USD Billion, %) by Region, 2022 & 2029
Figure 2: Global Paper And Packaging Testing Instrument Market Value Share (%), By Segment 1, 2022 & 2029
Figure 3: Global Paper And Packaging Testing Instrument Market Forecast (USD Billion), by Sub-Segment 1, 2018-2029
Figure 4: Global Paper And Packaging Testing Instrument Market Forecast (USD Billion), by Sub-Segment 2, 2018-2029
Figure 5: Global Paper And Packaging Testing Instrument Market Value Share (%), By Segment 2, 2022 & 2029
Figure 6: Global Paper And Packaging Testing Instrument Market Forecast (USD Billion), by Sub-Segment 1, 2018-2029
Figure 7: Global Paper And Packaging Testing Instrument Market Forecast (USD Billion), by Sub-Segment 2, 2018-2029
Figure 8: Global Paper And Packaging Testing Instrument Market Forecast (USD Billion), by Sub-Segment 3, 2018-2029
Figure 9: Global Paper And Packaging Testing Instrument Market Forecast (USD Billion), by Others, 2018-2029
Figure 10: Global Paper And Packaging Testing Instrument Market Value Share (%), By Segment 3, 2022 & 2029
Figure 11: Global Paper And Packaging Testing Instrument Market Forecast (USD Billion), by Sub-Segment 1, 2018-2029
Figure 12: Global Paper And Packaging Testing Instrument Market Forecast (USD Billion), by Sub-Segment 2, 2018-2029
Figure 13: Global Paper And Packaging Testing Instrument Market Forecast (USD Billion), by Sub-Segment 3, 2018-2029
Figure 14: Global Paper And Packaging Testing Instrument Market Forecast (USD Billion), by Others, 2018-2029
Figure 15: Global Paper And Packaging Testing Instrument Market Value (USD Billion), by Region, 2022 & 2029
Figure 16: North America Paper And Packaging Testing Instrument Market Value Share (%), By Segment 1, 2022 & 2029
Figure 17: North America Paper And Packaging Testing Instrument Market Forecast (USD Billion), by Sub-Segment 1, 2018-2029
Figure 18: North America Paper And Packaging Testing Instrument Market Forecast (USD Billion), by Sub-Segment 2, 2018-2029
Figure 19: North America Paper And Packaging Testing Instrument Market Value Share (%), By Segment 2, 2022 & 2029
Figure 20: North America Paper And Packaging Testing Instrument Market Forecast (USD Billion), by Sub-Segment 1, 2018-2029
Figure 21: North America Paper And Packaging Testing Instrument Market Forecast (USD Billion), by Sub-Segment 2, 2018-2029
Figure 22: North America Paper And Packaging Testing Instrument Market Forecast (USD Billion), by Sub-Segment 3, 2018-2029
Figure 23: North America Paper And Packaging Testing Instrument Market Forecast (USD Billion), by Others, 2018-2029
Figure 24: North America Paper And Packaging Testing Instrument Market Value Share (%), By Segment 3, 2022 & 2029
Figure 25: North America Paper And Packaging Testing Instrument Market Forecast (USD Billion), by Sub-Segment 1, 2018-2029
Figure 26: North America Paper And Packaging Testing Instrument Market Forecast (USD Billion), by Sub-Segment 2, 2018-2029
Figure 27: North America Paper And Packaging Testing Instrument Market Forecast (USD Billion), by Sub-Segment 3, 2018-2029
Figure 28: North America Paper And Packaging Testing Instrument Market Forecast (USD Billion), by Others, 2018-2029
Figure 29: North America Paper And Packaging Testing Instrument Market Forecast (USD Billion), by U.S., 2018-2029
Figure 30: North America Paper And Packaging Testing Instrument Market Forecast (USD Billion), by Canada, 2018-2029
Figure 31: Latin America Paper And Packaging Testing Instrument Market Value Share (%), By Segment 1, 2022 & 2029
Figure 32: Latin America Paper And Packaging Testing Instrument Market Forecast (USD Billion), by Sub-Segment 1, 2018-2029
Figure 33: Latin America Paper And Packaging Testing Instrument Market Forecast (USD Billion), by Sub-Segment 2, 2018-2029
Figure 34: Latin America Paper And Packaging Testing Instrument Market Value Share (%), By Segment 2, 2022 & 2029
Figure 35: Latin America Paper And Packaging Testing Instrument Market Forecast (USD Billion), by Sub-Segment 1, 2018-2029
Figure 36: Latin America Paper And Packaging Testing Instrument Market Forecast (USD Billion), by Sub-Segment 2, 2018-2029
Figure 37: Latin America Paper And Packaging Testing Instrument Market Forecast (USD Billion), by Sub-Segment 3, 2018-2029
Figure 38: Latin America Paper And Packaging Testing Instrument Market Forecast (USD Billion), by Others, 2018-2029
Figure 39: Latin America Paper And Packaging Testing Instrument Market Value Share (%), By Segment 3, 2022 & 2029
Figure 40: Latin America Paper And Packaging Testing Instrument Market Forecast (USD Billion), by Sub-Segment 1, 2018-2029
Figure 41: Latin America Paper And Packaging Testing Instrument Market Forecast (USD Billion), by Sub-Segment 2, 2018-2029
Figure 42: Latin America Paper And Packaging Testing Instrument Market Forecast (USD Billion), by Sub-Segment 3, 2018-2029
Figure 43: Latin America Paper And Packaging Testing Instrument Market Forecast (USD Billion), by Others, 2018-2029
Figure 44: Latin America Paper And Packaging Testing Instrument Market Forecast (USD Billion), by Brazil, 2018-2029
Figure 45: Latin America Paper And Packaging Testing Instrument Market Forecast (USD Billion), by Mexico, 2018-2029
Figure 46: Latin America Paper And Packaging Testing Instrument Market Forecast (USD Billion), by Rest of Latin America, 2018-2029
Figure 47: Europe Paper And Packaging Testing Instrument Market Value Share (%), By Segment 1, 2022 & 2029
Figure 48: Europe Paper And Packaging Testing Instrument Market Forecast (USD Billion), by Sub-Segment 1, 2018-2029
Figure 49: Europe Paper And Packaging Testing Instrument Market Forecast (USD Billion), by Sub-Segment 2, 2018-2029
Figure 50: Europe Paper And Packaging Testing Instrument Market Value Share (%), By Segment 2, 2022 & 2029
Figure 51: Europe Paper And Packaging Testing Instrument Market Forecast (USD Billion), by Sub-Segment 1, 2018-2029
Figure 52: Europe Paper And Packaging Testing Instrument Market Forecast (USD Billion), by Sub-Segment 2, 2018-2029
Figure 53: Europe Paper And Packaging Testing Instrument Market Forecast (USD Billion), by Sub-Segment 3, 2018-2029
Figure 54: Europe Paper And Packaging Testing Instrument Market Forecast (USD Billion), by Others, 2018-2029
Figure 55: Europe Paper And Packaging Testing Instrument Market Value Share (%), By Segment 3, 2022 & 2029
Figure 56: Europe Paper And Packaging Testing Instrument Market Forecast (USD Billion), by Sub-Segment 1, 2018-2029
Figure 57: Europe Paper And Packaging Testing Instrument Market Forecast (USD Billion), by Sub-Segment 2, 2018-2029
Figure 58: Europe Paper And Packaging Testing Instrument Market Forecast (USD Billion), by Sub-Segment 3, 2018-2029
Figure 59: Europe Paper And Packaging Testing Instrument Market Forecast (USD Billion), by Others, 2018-2029
Figure 60: Europe Paper And Packaging Testing Instrument Market Forecast (USD Billion), by U.K., 2018-2029
Figure 61: Europe Paper And Packaging Testing Instrument Market Forecast (USD Billion), by Germany, 2018-2029
Figure 62: Europe Paper And Packaging Testing Instrument Market Forecast (USD Billion), by France, 2018-2029
Figure 63: Europe Paper And Packaging Testing Instrument Market Forecast (USD Billion), by Italy, 2018-2029
Figure 64: Europe Paper And Packaging Testing Instrument Market Forecast (USD Billion), by Spain, 2018-2029
Figure 65: Europe Paper And Packaging Testing Instrument Market Forecast (USD Billion), by Russia, 2018-2029
Figure 66: Europe Paper And Packaging Testing Instrument Market Forecast (USD Billion), by Rest of Europe, 2018-2029
Figure 67: Asia Pacific Paper And Packaging Testing Instrument Market Value Share (%), By Segment 1, 2022 & 2029
Figure 68: Asia Pacific Paper And Packaging Testing Instrument Market Forecast (USD Billion), by Sub-Segment 1, 2018-2029
Figure 69: Asia Pacific Paper And Packaging Testing Instrument Market Forecast (USD Billion), by Sub-Segment 2, 2018-2029
Figure 70: Asia Pacific Paper And Packaging Testing Instrument Market Value Share (%), By Segment 2, 2022 & 2029
Figure 71: Asia Pacific Paper And Packaging Testing Instrument Market Forecast (USD Billion), by Sub-Segment 1, 2018-2029
Figure 72: Asia Pacific Paper And Packaging Testing Instrument Market Forecast (USD Billion), by Sub-Segment 2, 2018-2029
Figure 73: Asia Pacific Paper And Packaging Testing Instrument Market Forecast (USD Billion), by Sub-Segment 3, 2018-2029
Figure 74: Asia Pacific Paper And Packaging Testing Instrument Market Forecast (USD Billion), by Others, 2018-2029
Figure 75: Asia Pacific Paper And Packaging Testing Instrument Market Value Share (%), By Segment 3, 2022 & 2029
Figure 76: Asia Pacific Paper And Packaging Testing Instrument Market Forecast (USD Billion), by Sub-Segment 1, 2018-2029
Figure 77: Asia Pacific Paper And Packaging Testing Instrument Market Forecast (USD Billion), by Sub-Segment 2, 2018-2029
Figure 78: Asia Pacific Paper And Packaging Testing Instrument Market Forecast (USD Billion), by Sub-Segment 3, 2018-2029
Figure 79: Asia Pacific Paper And Packaging Testing Instrument Market Forecast (USD Billion), by Others, 2018-2029
Figure 80: Asia Pacific Paper And Packaging Testing Instrument Market Forecast (USD Billion), by China, 2018-2029
Figure 81: Asia Pacific Paper And Packaging Testing Instrument Market Forecast (USD Billion), by India, 2018-2029
Figure 82: Asia Pacific Paper And Packaging Testing Instrument Market Forecast (USD Billion), by Japan, 2018-2029
Figure 83: Asia Pacific Paper And Packaging Testing Instrument Market Forecast (USD Billion), by Australia, 2018-2029
Figure 84: Asia Pacific Paper And Packaging Testing Instrument Market Forecast (USD Billion), by Southeast Asia, 2018-2029
Figure 85: Asia Pacific Paper And Packaging Testing Instrument Market Forecast (USD Billion), by Rest of Asia Pacific, 2018-2029
Figure 86: Middle East & Africa Paper And Packaging Testing Instrument Market Value Share (%), By Segment 1, 2022 & 2029
Figure 87: Middle East & Africa Paper And Packaging Testing Instrument Market Forecast (USD Billion), by Sub-Segment 1, 2018-2029
Figure 88: Middle East & Africa Paper And Packaging Testing Instrument Market Forecast (USD Billion), by Sub-Segment 2, 2018-2029
Figure 89: Middle East & Africa Paper And Packaging Testing Instrument Market Value Share (%), By Segment 2, 2022 & 2029
Figure 90: Middle East & Africa Paper And Packaging Testing Instrument Market Forecast (USD Billion), by Sub-Segment 1, 2018-2029
Figure 91: Middle East & Africa Paper And Packaging Testing Instrument Market Forecast (USD Billion), by Sub-Segment 2, 2018-2029
Figure 92: Middle East & Africa Paper And Packaging Testing Instrument Market Forecast (USD Billion), by Sub-Segment 3, 2018-2029
Figure 93: Middle East & Africa Paper And Packaging Testing Instrument Market Forecast (USD Billion), by Others, 2018-2029
Figure 94: Middle East & Africa Paper And Packaging Testing Instrument Market Value Share (%), By Segment 3, 2022 & 2029
Figure 95: Middle East & Africa Paper And Packaging Testing Instrument Market Forecast (USD Billion), by Sub-Segment 1, 2018-2029
Figure 96: Middle East & Africa Paper And Packaging Testing Instrument Market Forecast (USD Billion), by Sub-Segment 2, 2018-2029
Figure 97: Middle East & Africa Paper And Packaging Testing Instrument Market Forecast (USD Billion), by Sub-Segment 3, 2018-2029
Figure 98: Middle East & Africa Paper And Packaging Testing Instrument Market Forecast (USD Billion), by Others, 2018-2029
Figure 99: Middle East & Africa Paper And Packaging Testing Instrument Market Forecast (USD Billion), by GCC, 2018-2029
Figure 100: Middle East & Africa Paper And Packaging Testing Instrument Market Forecast (USD Billion), by South Africa, 2018-2029
Figure 101: Middle East & Africa Paper And Packaging Testing Instrument Market Forecast (USD Billion), by Rest of Middle East & Africa, 2018-2029
List of Tables
Table 1: Global Paper And Packaging Testing Instrument Market Revenue (USD Billion) Forecast, by Segment 1, 2018-2029
Table 2: Global Paper And Packaging Testing Instrument Market Revenue (USD Billion) Forecast, by Segment 2, 2018-2029
Table 3: Global Paper And Packaging Testing Instrument Market Revenue (USD Billion) Forecast, by Segment 3, 2018-2029
Table 4: Global Paper And Packaging Testing Instrument Market Revenue (USD Billion) Forecast, by Region, 2018-2029
Table 5: North America Paper And Packaging Testing Instrument Market Revenue (USD Billion) Forecast, by Segment 1, 2018-2029
Table 6: North America Paper And Packaging Testing Instrument Market Revenue (USD Billion) Forecast, by Segment 2, 2018-2029
Table 7: North America Paper And Packaging Testing Instrument Market Revenue (USD Billion) Forecast, by Segment 3, 2018-2029
Table 8: North America Paper And Packaging Testing Instrument Market Revenue (USD Billion) Forecast, by Country, 2018-2029
Table 9: Europe Paper And Packaging Testing Instrument Market Revenue (USD Billion) Forecast, by Segment 1, 2018-2029
Table 10: Europe Paper And Packaging Testing Instrument Market Revenue (USD Billion) Forecast, by Segment 2, 2018-2029
Table 11: Europe Paper And Packaging Testing Instrument Market Revenue (USD Billion) Forecast, by Segment 3, 2018-2029
Table 12: Europe Paper And Packaging Testing Instrument Market Revenue (USD Billion) Forecast, by Country, 2018-2029
Table 13: Latin America Paper And Packaging Testing Instrument Market Revenue (USD Billion) Forecast, by Segment 1, 2018-2029
Table 14: Latin America Paper And Packaging Testing Instrument Market Revenue (USD Billion) Forecast, by Segment 2, 2018-2029
Table 15: Latin America Paper And Packaging Testing Instrument Market Revenue (USD Billion) Forecast, by Segment 3, 2018-2029
Table 16: Latin America Paper And Packaging Testing Instrument Market Revenue (USD Billion) Forecast, by Country, 2018-2029
Table 17: Asia Pacific Paper And Packaging Testing Instrument Market Revenue (USD Billion) Forecast, by Segment 1, 2018-2029
Table 18: Asia Pacific Paper And Packaging Testing Instrument Market Revenue (USD Billion) Forecast, by Segment 2, 2018-2029
Table 19: Asia Pacific Paper And Packaging Testing Instrument Market Revenue (USD Billion) Forecast, by Segment 3, 2018-2029
Table 20: Asia Pacific Paper And Packaging Testing Instrument Market Revenue (USD Billion) Forecast, by Country, 2018-2029
Table 21: Middle East & Africa Paper And Packaging Testing Instrument Market Revenue (USD Billion) Forecast, by Segment 1, 2018-2029
Table 22: Middle East & Africa Paper And Packaging Testing Instrument Market Revenue (USD Billion) Forecast, by Segment 2, 2018-2029
Table 23: Middle East & Africa Paper And Packaging Testing Instrument Market Revenue (USD Billion) Forecast, by Segment 3, 2018-2029
Table 24: Middle East & Africa Paper And Packaging Testing Instrument Market Revenue (USD Billion) Forecast, by Country, 2018-2029
Research Process
Data Library Research are conducted by industry experts who offer insight on
industry structure, market segmentations technology assessment and competitive landscape (CL), and penetration, as well as on emerging trends. Their analysis is based on primary interviews (~ 80%) and secondary research (~ 20%) as well as years of professional expertise in their respective industries. Adding to this, by analysing historical trends and current market positions, our analysts predict where the market will be headed for the next five years. Furthermore, the varying trends of segment & categories geographically presented are also studied and the estimated based on the primary & secondary research.
In this particular report from the supply side Data Library Research has conducted primary surveys (interviews) with the key level executives (VP, CEO’s, Marketing Director, Business Development Manager
and SOFT) of the companies that active & prominent as well as the midsized organization
FIGURE 1: DLR RESEARH PROCESS
![research-methodology1]()
Primary Research
Extensive primary research was conducted to gain a deeper insight of the market and industry performance. The analysis is based on both primary and secondary research as well as years of professional expertise in the respective industries.
In addition to analysing current and historical trends, our analysts predict where the market is headed over the next five years.
It varies by segment for these categories geographically presented in the list of market tables. Speaking about this particular report we have conducted primary surveys (interviews) with the key level executives (VP, CEO’s, Marketing Director, Business Development Manager and many more) of the major players active in the market.
Secondary Research
Secondary research was mainly used to collect and identify information useful for the extensive, technical, market-oriented, and Friend’s study of the Global Extra Neutral Alcohol. It was also used to obtain key information about major players, market classification and segmentation according to the industry trends, geographical markets, and developments related to the market and technology perspectives. For this study, analysts have gathered information from various credible sources, such as annual reports, sec filings, journals, white papers, SOFT presentations, and company web sites.
Market Size Estimation
Both, top-down and bottom-up approaches were used to estimate and validate the size of the Global market and to estimate the size of various other dependent submarkets in the overall Extra Neutral Alcohol. The key players in the market were identified through secondary research and their market contributions in the respective geographies were determined through primary and secondary research.
Forecast Model
![research-methodology2]()