Seafood Food Safety Testing Service Market Overview and Analysis
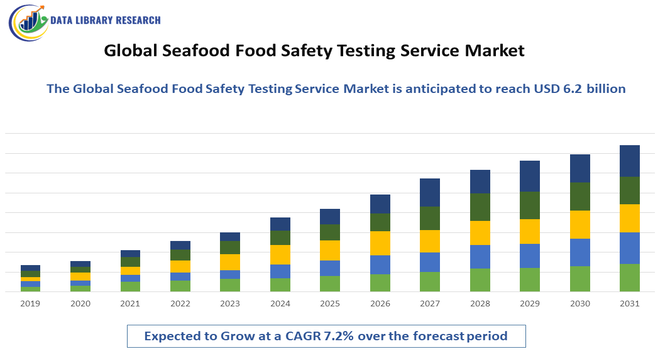
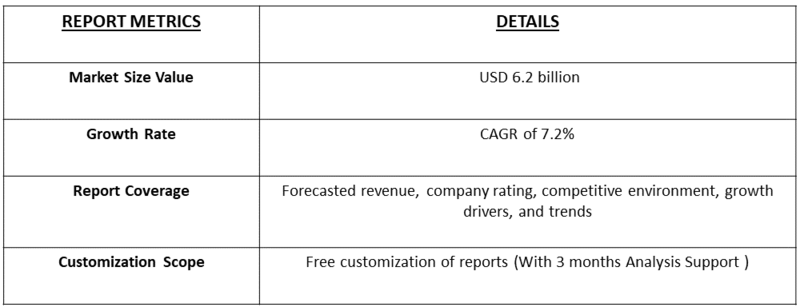
- The Seafood food safety testing service market is estimated at approximately USD 2.5 billion in 2025 and is forecast to reach around USD 6.2 billion by 2032, achieving a Compound Annual Growth Rate (CAGR) of about 7.2% over the forecast period.
Get Complete Analysis Of The Report - Download Updated Free Sample PDF
The Global Seafood Food Safety Testing Service Market is witnessing robust growth driven by increasing consumer awareness of seafood contamination and stringent government regulations on food safety. Rising incidences of foodborne illnesses and contamination from pathogens, heavy metals, and chemical residues have intensified demand for reliable testing services. Growth is further supported by expanding seafood trade globally, where compliance with international safety standards such as HACCP, ISO, and FDA guidelines is mandatory.
Seafood Food Safety Testing Service Market Latest Trends
The Global Seafood Food Safety Testing Service Market is being shaped by the rapid adoption of advanced and rapid testing technologies, such as PCR-based molecular diagnostics, immunoassays, and sensor-based methods that significantly reduce turnaround times while improving detection accuracy for pathogens, toxins, and chemical residues. There is also an increasing focus on digital traceability and blockchain solutions to enhance supply chain transparency and compliance with international standards, supporting export growth and consumer confidence in seafood products.
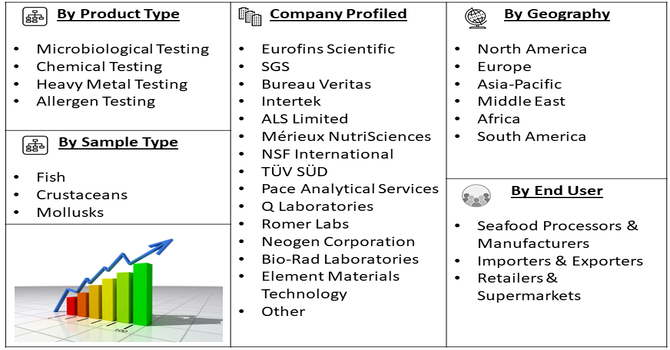
Segmentation: The Global Seafood Food Safety Testing Service Market is segmented by Test Type (Microbiological Testing, Chemical Testing, Heavy Metal Testing, Allergen Testing), Sample Type (Fish, Crustaceans, Mollusks), End-User (Seafood Processors & Manufacturers, Importers & Exporters, Retailers & Supermarkets), and Geography (North America, Europe, Asia-Pacific, Middle East and Africa, and South America). The report provides the value (in USD million) for the above segments.
For Detailed Market Segmentation - Get a Free Sample PDF
Market Drivers:
- Rising Consumer Awareness and Demand for Safe Seafood
A primary driver of the market is the increasing consumer awareness regarding seafood safety and the risks of foodborne illnesses. Contamination from pathogens, heavy metals, toxins, and chemical residues can cause severe health issues, prompting consumers to demand high-quality, safe, and traceable seafood products.
In September 2022, The Global Seafood Alliance launched a consumer-focused Best Aquaculture Practices (BAP) website to promote sustainably sourced seafood, educate on certification standards, and provide recipes. This initiative increased consumer awareness and demand for safe seafood, indirectly boosting the Global Seafood Food Safety Testing Service Market by encouraging stricter compliance and widespread adoption of testing practices. This has led seafood processors, retailers, and exporters to invest heavily in food safety testing services to ensure compliance, build consumer trust, and maintain brand reputation. The growing preference for tested and certified seafood products globally is significantly boosting market growth.
- Stringent Regulatory Compliance and International Trade Requirements
The seafood industry is heavily regulated, with strict safety standards imposed by authorities such as the FDA, EU Food Safety Authority, HACCP, and ISO. Exporters and importers are required to conduct regular testing to comply with international food safety regulations and avoid product recalls or trade restrictions. Increasing global seafood trade has further intensified the need for reliable testing services to meet country-specific standards and certification requirements. These regulatory mandates drive the adoption of advanced testing services, contributing strongly to the market’s expansion worldwide.
Market Restraints:
- High Operational Costs and Limited Affordability for Small Producers
Advanced seafood safety testing methods—such as PCR-based pathogen detection, isotope analysis for traceability, allergen testing, and LC-MS/MS for chemical residues—require costly equipment, certified laboratories, and trained specialists. These expenses significantly increase the cost per test, making it challenging for small and medium seafood processors, aquaculture farms, and local distributors to adopt routine testing. As a result, many smaller players either avoid comprehensive testing or opt for minimal compliance, restricting overall market penetration.
Socioeconomic Impact on Seafood Food Safety Testing Service Market
The Global Seafood Food Safety Testing Service Market had a significant socioeconomic impact by supporting public health, strengthening consumer confidence, and promoting fair trade practices across the seafood value chain. By reducing the risk of foodborne illnesses and allergen exposure, testing services lowered healthcare burdens and productivity losses associated with food safety incidents. The market also generated skilled employment opportunities in laboratories, quality assurance, and regulatory compliance, particularly in coastal and export-driven economies. Additionally, robust testing frameworks enabled small and large seafood producers to access international markets by meeting stringent safety standards, supporting income stability and economic growth.
Segmental Analysis:
- Microbiological Testing segment is expected to witness the highest growth over the forecast period
Microbiological testing holds a major share as it targets pathogens such as Salmonella, Listeria, Vibrio, and E. coli, which are the most frequent contaminants in seafood. With rising foodborne illness outbreaks and stringent global food safety regulations, this testing method is increasingly adopted to ensure compliance and protect consumer health.
Additionally, advancements in rapid microbiological testing technologies are enhancing detection accuracy and reducing turnaround times, enabling seafood producers to identify contamination earlier in the supply chain. This proactive approach minimizes product recalls, supports quality assurance programs, and strengthens consumer confidence in the safety of seafood products.
- Fish segment is expected to witness the highest growth over the forecast period
Fish dominates the sample type segment due to its high global consumption and extensive trade volume. As fish varieties are more prone to spoilage and microbial contamination, routine safety testing is critical, boosting demand for specialized laboratory services. Its susceptibility to rapid spoilage and microbial contamination necessitates frequent and rigorous safety testing, thereby increasing demand for specialized laboratory services and quality assurance measures.
- Seafood Processors & Manufacturers segment is expected to witness the highest growth over the forecast period
The seafood processors and manufacturers segment is expected to witness the highest growth over the forecast period, driven by rising demand for value-added seafood, improved cold-chain infrastructure, expanding export markets, and growing consumer preference for convenient, processed, and ready-to-cook seafood products worldwide.
Furthermore, increasing investments in processing technologies and automation are enabling seafood processors and manufacturers to enhance product quality, extend shelf life, and meet stringent safety standards. Supportive government initiatives and the expansion of modern retail channels are also contributing to the accelerated growth of this segment during the forecast period.
- North America segment is expected to witness the highest growth over the forecast period
North America remains a key growth region due to strict regulatory frameworks by FDA, CFIA, and other agencies, along with high consumer awareness regarding seafood safety. The region’s large-scale imports and established testing infrastructure further contribute to demand for seafood safety testing services.
In September 2025, Siemens Healthineers expanded its 3gAllergy assay menu with new component allergens, including peanut, wheat, and dust mite components, increasing total allergen availability on the IMMULITE system. This expansion positively impacted North America’s seafood food safety testing service market by strengthening allergen detection capabilities, supporting regulatory compliance, and driving demand for advanced, component-level allergen testing services.
Moreover, the presence of leading seafood testing laboratories and advanced analytical capabilities in North America strengthens market growth. Continuous monitoring of imported seafood, coupled with frequent inspections and recalls, encourages consistent testing adoption, while increasing consumption of processed and ready-to-eat seafood further elevates the need for comprehensive safety assurance across the supply chain.
To Learn More About This Report - Request a Free Sample Copy
Seafood Food Safety Testing Service Market Competitive Landscape
The competitive landscape is marked by a mix of large multinational testing and inspection firms, specialized food-safety laboratories, and emerging niche players focused on rapid and molecular testing. Market leaders compete on accreditation, geographic reach, and service breadth—offering microbiological, chemical, heavy-metal, and traceability testing—while investing in rapid diagnostics, on-site testing, and digital traceability integrations. Strategic partnerships with seafood processors, ports, and retailers, plus mergers and regional lab expansions, are common as companies seek to scale capacity, shorten turnaround times, and meet evolving regulatory and export requirements worldwide.
The major players for this market are:
- Eurofins Scientific
- SGS
- Bureau Veritas
- Intertek
- ALS Limited
- Mérieux NutriSciences
- NSF International
- TÜV SÜD
- Pace Analytical Services
- Q Laboratories
- Romer Labs
- Neogen Corporation
- Bio-Rad Laboratories
- Element Materials Technology
- Cotecna Inspection
- DNV
- TÜV Rheinland
- Microbac Laboratories
- Campden BRI
- FoodChain ID
Recent Development
- In October 2024, The FDA approved ALK-manufactured AccuTest allergy skin testing devices and allergen trays for allergy diagnosis, citing improved reliability due to lower device variability. This approval supported the Global Seafood Food Safety Testing Service Market by reinforcing the importance of accurate allergen detection, encouraging stricter compliance standards, and increasing demand for advanced testing services within seafood safety assurance frameworks.
- In July 2024, ALK, announced the licensing of a new line of ALK-branded allergy skin testing devices and allergen trays for allergy diagnosis. This development indirectly supported the Global Seafood Food Safety Testing Service Market by strengthening allergen detection awareness, encouraging stricter testing protocols, and reinforcing the importance of allergen safety compliance in seafood products.
Frequently Asked Questions (FAQ) :
Q1. What are the main growth-driving factors for this market?
The market is driven by increasing global seafood consumption and complex international trade routes. A key factor is the implementation of very strict regulations by governments, particularly in North America and Europe, to control pathogens, heavy metals like mercury, and dangerous marine biotoxins, ensuring consumer safety.
Q2. What are the main restraining factors for this market?
High operational costs pose a significant restraint, making advanced testing services expensive for many small-to-medium seafood processors and exporters, especially in developing nations. Additionally, the lack of universally standardized testing methods and the long time required for specialized analysis can slow down efficient supply chain management.
Q3. Which segment is expected to witness high growth?
The Asia-Pacific (APAC) region is expected to show the highest growth rate. This surge is due to the rapid expansion of aquaculture farming in countries like China and India, coupled with increasing regulatory pressure to meet the stringent export quality and safety standards required by global importing partners.
Q4. Who are the top major players for this market?
The market is dominated by major global Testing, Inspection, and Certification (TIC) companies. The top players include large multinational firms such as Eurofins Scientific, SGS S.A., and Intertek Group. These companies leverage their global network to offer comprehensive safety checks and supply chain auditing.
Q5. Which country is the largest player?
North America, driven primarily by the United States, holds the largest market share in terms of total testing service revenue. This leadership is sustained by highly active government agencies, like the FDA, and high consumer awareness, which necessitates continuous and rigorous safety testing across all imported and domestic seafood products.
List of Figures
Figure 1: Global Seafood Food Safety Testing Service Market Revenue Breakdown (USD Billion, %) by Region, 2022 & 2029
Figure 2: Global Seafood Food Safety Testing Service Market Value Share (%), By Segment 1, 2022 & 2029
Figure 3: Global Seafood Food Safety Testing Service Market Forecast (USD Billion), by Sub-Segment 1, 2018-2029
Figure 4: Global Seafood Food Safety Testing Service Market Forecast (USD Billion), by Sub-Segment 2, 2018-2029
Figure 5: Global Seafood Food Safety Testing Service Market Value Share (%), By Segment 2, 2022 & 2029
Figure 6: Global Seafood Food Safety Testing Service Market Forecast (USD Billion), by Sub-Segment 1, 2018-2029
Figure 7: Global Seafood Food Safety Testing Service Market Forecast (USD Billion), by Sub-Segment 2, 2018-2029
Figure 8: Global Seafood Food Safety Testing Service Market Forecast (USD Billion), by Sub-Segment 3, 2018-2029
Figure 9: Global Seafood Food Safety Testing Service Market Forecast (USD Billion), by Others, 2018-2029
Figure 10: Global Seafood Food Safety Testing Service Market Value Share (%), By Segment 3, 2022 & 2029
Figure 11: Global Seafood Food Safety Testing Service Market Forecast (USD Billion), by Sub-Segment 1, 2018-2029
Figure 12: Global Seafood Food Safety Testing Service Market Forecast (USD Billion), by Sub-Segment 2, 2018-2029
Figure 13: Global Seafood Food Safety Testing Service Market Forecast (USD Billion), by Sub-Segment 3, 2018-2029
Figure 14: Global Seafood Food Safety Testing Service Market Forecast (USD Billion), by Others, 2018-2029
Figure 15: Global Seafood Food Safety Testing Service Market Value (USD Billion), by Region, 2022 & 2029
Figure 16: North America Seafood Food Safety Testing Service Market Value Share (%), By Segment 1, 2022 & 2029
Figure 17: North America Seafood Food Safety Testing Service Market Forecast (USD Billion), by Sub-Segment 1, 2018-2029
Figure 18: North America Seafood Food Safety Testing Service Market Forecast (USD Billion), by Sub-Segment 2, 2018-2029
Figure 19: North America Seafood Food Safety Testing Service Market Value Share (%), By Segment 2, 2022 & 2029
Figure 20: North America Seafood Food Safety Testing Service Market Forecast (USD Billion), by Sub-Segment 1, 2018-2029
Figure 21: North America Seafood Food Safety Testing Service Market Forecast (USD Billion), by Sub-Segment 2, 2018-2029
Figure 22: North America Seafood Food Safety Testing Service Market Forecast (USD Billion), by Sub-Segment 3, 2018-2029
Figure 23: North America Seafood Food Safety Testing Service Market Forecast (USD Billion), by Others, 2018-2029
Figure 24: North America Seafood Food Safety Testing Service Market Value Share (%), By Segment 3, 2022 & 2029
Figure 25: North America Seafood Food Safety Testing Service Market Forecast (USD Billion), by Sub-Segment 1, 2018-2029
Figure 26: North America Seafood Food Safety Testing Service Market Forecast (USD Billion), by Sub-Segment 2, 2018-2029
Figure 27: North America Seafood Food Safety Testing Service Market Forecast (USD Billion), by Sub-Segment 3, 2018-2029
Figure 28: North America Seafood Food Safety Testing Service Market Forecast (USD Billion), by Others, 2018-2029
Figure 29: North America Seafood Food Safety Testing Service Market Forecast (USD Billion), by U.S., 2018-2029
Figure 30: North America Seafood Food Safety Testing Service Market Forecast (USD Billion), by Canada, 2018-2029
Figure 31: Latin America Seafood Food Safety Testing Service Market Value Share (%), By Segment 1, 2022 & 2029
Figure 32: Latin America Seafood Food Safety Testing Service Market Forecast (USD Billion), by Sub-Segment 1, 2018-2029
Figure 33: Latin America Seafood Food Safety Testing Service Market Forecast (USD Billion), by Sub-Segment 2, 2018-2029
Figure 34: Latin America Seafood Food Safety Testing Service Market Value Share (%), By Segment 2, 2022 & 2029
Figure 35: Latin America Seafood Food Safety Testing Service Market Forecast (USD Billion), by Sub-Segment 1, 2018-2029
Figure 36: Latin America Seafood Food Safety Testing Service Market Forecast (USD Billion), by Sub-Segment 2, 2018-2029
Figure 37: Latin America Seafood Food Safety Testing Service Market Forecast (USD Billion), by Sub-Segment 3, 2018-2029
Figure 38: Latin America Seafood Food Safety Testing Service Market Forecast (USD Billion), by Others, 2018-2029
Figure 39: Latin America Seafood Food Safety Testing Service Market Value Share (%), By Segment 3, 2022 & 2029
Figure 40: Latin America Seafood Food Safety Testing Service Market Forecast (USD Billion), by Sub-Segment 1, 2018-2029
Figure 41: Latin America Seafood Food Safety Testing Service Market Forecast (USD Billion), by Sub-Segment 2, 2018-2029
Figure 42: Latin America Seafood Food Safety Testing Service Market Forecast (USD Billion), by Sub-Segment 3, 2018-2029
Figure 43: Latin America Seafood Food Safety Testing Service Market Forecast (USD Billion), by Others, 2018-2029
Figure 44: Latin America Seafood Food Safety Testing Service Market Forecast (USD Billion), by Brazil, 2018-2029
Figure 45: Latin America Seafood Food Safety Testing Service Market Forecast (USD Billion), by Mexico, 2018-2029
Figure 46: Latin America Seafood Food Safety Testing Service Market Forecast (USD Billion), by Rest of Latin America, 2018-2029
Figure 47: Europe Seafood Food Safety Testing Service Market Value Share (%), By Segment 1, 2022 & 2029
Figure 48: Europe Seafood Food Safety Testing Service Market Forecast (USD Billion), by Sub-Segment 1, 2018-2029
Figure 49: Europe Seafood Food Safety Testing Service Market Forecast (USD Billion), by Sub-Segment 2, 2018-2029
Figure 50: Europe Seafood Food Safety Testing Service Market Value Share (%), By Segment 2, 2022 & 2029
Figure 51: Europe Seafood Food Safety Testing Service Market Forecast (USD Billion), by Sub-Segment 1, 2018-2029
Figure 52: Europe Seafood Food Safety Testing Service Market Forecast (USD Billion), by Sub-Segment 2, 2018-2029
Figure 53: Europe Seafood Food Safety Testing Service Market Forecast (USD Billion), by Sub-Segment 3, 2018-2029
Figure 54: Europe Seafood Food Safety Testing Service Market Forecast (USD Billion), by Others, 2018-2029
Figure 55: Europe Seafood Food Safety Testing Service Market Value Share (%), By Segment 3, 2022 & 2029
Figure 56: Europe Seafood Food Safety Testing Service Market Forecast (USD Billion), by Sub-Segment 1, 2018-2029
Figure 57: Europe Seafood Food Safety Testing Service Market Forecast (USD Billion), by Sub-Segment 2, 2018-2029
Figure 58: Europe Seafood Food Safety Testing Service Market Forecast (USD Billion), by Sub-Segment 3, 2018-2029
Figure 59: Europe Seafood Food Safety Testing Service Market Forecast (USD Billion), by Others, 2018-2029
Figure 60: Europe Seafood Food Safety Testing Service Market Forecast (USD Billion), by U.K., 2018-2029
Figure 61: Europe Seafood Food Safety Testing Service Market Forecast (USD Billion), by Germany, 2018-2029
Figure 62: Europe Seafood Food Safety Testing Service Market Forecast (USD Billion), by France, 2018-2029
Figure 63: Europe Seafood Food Safety Testing Service Market Forecast (USD Billion), by Italy, 2018-2029
Figure 64: Europe Seafood Food Safety Testing Service Market Forecast (USD Billion), by Spain, 2018-2029
Figure 65: Europe Seafood Food Safety Testing Service Market Forecast (USD Billion), by Russia, 2018-2029
Figure 66: Europe Seafood Food Safety Testing Service Market Forecast (USD Billion), by Rest of Europe, 2018-2029
Figure 67: Asia Pacific Seafood Food Safety Testing Service Market Value Share (%), By Segment 1, 2022 & 2029
Figure 68: Asia Pacific Seafood Food Safety Testing Service Market Forecast (USD Billion), by Sub-Segment 1, 2018-2029
Figure 69: Asia Pacific Seafood Food Safety Testing Service Market Forecast (USD Billion), by Sub-Segment 2, 2018-2029
Figure 70: Asia Pacific Seafood Food Safety Testing Service Market Value Share (%), By Segment 2, 2022 & 2029
Figure 71: Asia Pacific Seafood Food Safety Testing Service Market Forecast (USD Billion), by Sub-Segment 1, 2018-2029
Figure 72: Asia Pacific Seafood Food Safety Testing Service Market Forecast (USD Billion), by Sub-Segment 2, 2018-2029
Figure 73: Asia Pacific Seafood Food Safety Testing Service Market Forecast (USD Billion), by Sub-Segment 3, 2018-2029
Figure 74: Asia Pacific Seafood Food Safety Testing Service Market Forecast (USD Billion), by Others, 2018-2029
Figure 75: Asia Pacific Seafood Food Safety Testing Service Market Value Share (%), By Segment 3, 2022 & 2029
Figure 76: Asia Pacific Seafood Food Safety Testing Service Market Forecast (USD Billion), by Sub-Segment 1, 2018-2029
Figure 77: Asia Pacific Seafood Food Safety Testing Service Market Forecast (USD Billion), by Sub-Segment 2, 2018-2029
Figure 78: Asia Pacific Seafood Food Safety Testing Service Market Forecast (USD Billion), by Sub-Segment 3, 2018-2029
Figure 79: Asia Pacific Seafood Food Safety Testing Service Market Forecast (USD Billion), by Others, 2018-2029
Figure 80: Asia Pacific Seafood Food Safety Testing Service Market Forecast (USD Billion), by China, 2018-2029
Figure 81: Asia Pacific Seafood Food Safety Testing Service Market Forecast (USD Billion), by India, 2018-2029
Figure 82: Asia Pacific Seafood Food Safety Testing Service Market Forecast (USD Billion), by Japan, 2018-2029
Figure 83: Asia Pacific Seafood Food Safety Testing Service Market Forecast (USD Billion), by Australia, 2018-2029
Figure 84: Asia Pacific Seafood Food Safety Testing Service Market Forecast (USD Billion), by Southeast Asia, 2018-2029
Figure 85: Asia Pacific Seafood Food Safety Testing Service Market Forecast (USD Billion), by Rest of Asia Pacific, 2018-2029
Figure 86: Middle East & Africa Seafood Food Safety Testing Service Market Value Share (%), By Segment 1, 2022 & 2029
Figure 87: Middle East & Africa Seafood Food Safety Testing Service Market Forecast (USD Billion), by Sub-Segment 1, 2018-2029
Figure 88: Middle East & Africa Seafood Food Safety Testing Service Market Forecast (USD Billion), by Sub-Segment 2, 2018-2029
Figure 89: Middle East & Africa Seafood Food Safety Testing Service Market Value Share (%), By Segment 2, 2022 & 2029
Figure 90: Middle East & Africa Seafood Food Safety Testing Service Market Forecast (USD Billion), by Sub-Segment 1, 2018-2029
Figure 91: Middle East & Africa Seafood Food Safety Testing Service Market Forecast (USD Billion), by Sub-Segment 2, 2018-2029
Figure 92: Middle East & Africa Seafood Food Safety Testing Service Market Forecast (USD Billion), by Sub-Segment 3, 2018-2029
Figure 93: Middle East & Africa Seafood Food Safety Testing Service Market Forecast (USD Billion), by Others, 2018-2029
Figure 94: Middle East & Africa Seafood Food Safety Testing Service Market Value Share (%), By Segment 3, 2022 & 2029
Figure 95: Middle East & Africa Seafood Food Safety Testing Service Market Forecast (USD Billion), by Sub-Segment 1, 2018-2029
Figure 96: Middle East & Africa Seafood Food Safety Testing Service Market Forecast (USD Billion), by Sub-Segment 2, 2018-2029
Figure 97: Middle East & Africa Seafood Food Safety Testing Service Market Forecast (USD Billion), by Sub-Segment 3, 2018-2029
Figure 98: Middle East & Africa Seafood Food Safety Testing Service Market Forecast (USD Billion), by Others, 2018-2029
Figure 99: Middle East & Africa Seafood Food Safety Testing Service Market Forecast (USD Billion), by GCC, 2018-2029
Figure 100: Middle East & Africa Seafood Food Safety Testing Service Market Forecast (USD Billion), by South Africa, 2018-2029
Figure 101: Middle East & Africa Seafood Food Safety Testing Service Market Forecast (USD Billion), by Rest of Middle East & Africa, 2018-2029
List of Tables
Table 1: Global Seafood Food Safety Testing Service Market Revenue (USD Billion) Forecast, by Segment 1, 2018-2029
Table 2: Global Seafood Food Safety Testing Service Market Revenue (USD Billion) Forecast, by Segment 2, 2018-2029
Table 3: Global Seafood Food Safety Testing Service Market Revenue (USD Billion) Forecast, by Segment 3, 2018-2029
Table 4: Global Seafood Food Safety Testing Service Market Revenue (USD Billion) Forecast, by Region, 2018-2029
Table 5: North America Seafood Food Safety Testing Service Market Revenue (USD Billion) Forecast, by Segment 1, 2018-2029
Table 6: North America Seafood Food Safety Testing Service Market Revenue (USD Billion) Forecast, by Segment 2, 2018-2029
Table 7: North America Seafood Food Safety Testing Service Market Revenue (USD Billion) Forecast, by Segment 3, 2018-2029
Table 8: North America Seafood Food Safety Testing Service Market Revenue (USD Billion) Forecast, by Country, 2018-2029
Table 9: Europe Seafood Food Safety Testing Service Market Revenue (USD Billion) Forecast, by Segment 1, 2018-2029
Table 10: Europe Seafood Food Safety Testing Service Market Revenue (USD Billion) Forecast, by Segment 2, 2018-2029
Table 11: Europe Seafood Food Safety Testing Service Market Revenue (USD Billion) Forecast, by Segment 3, 2018-2029
Table 12: Europe Seafood Food Safety Testing Service Market Revenue (USD Billion) Forecast, by Country, 2018-2029
Table 13: Latin America Seafood Food Safety Testing Service Market Revenue (USD Billion) Forecast, by Segment 1, 2018-2029
Table 14: Latin America Seafood Food Safety Testing Service Market Revenue (USD Billion) Forecast, by Segment 2, 2018-2029
Table 15: Latin America Seafood Food Safety Testing Service Market Revenue (USD Billion) Forecast, by Segment 3, 2018-2029
Table 16: Latin America Seafood Food Safety Testing Service Market Revenue (USD Billion) Forecast, by Country, 2018-2029
Table 17: Asia Pacific Seafood Food Safety Testing Service Market Revenue (USD Billion) Forecast, by Segment 1, 2018-2029
Table 18: Asia Pacific Seafood Food Safety Testing Service Market Revenue (USD Billion) Forecast, by Segment 2, 2018-2029
Table 19: Asia Pacific Seafood Food Safety Testing Service Market Revenue (USD Billion) Forecast, by Segment 3, 2018-2029
Table 20: Asia Pacific Seafood Food Safety Testing Service Market Revenue (USD Billion) Forecast, by Country, 2018-2029
Table 21: Middle East & Africa Seafood Food Safety Testing Service Market Revenue (USD Billion) Forecast, by Segment 1, 2018-2029
Table 22: Middle East & Africa Seafood Food Safety Testing Service Market Revenue (USD Billion) Forecast, by Segment 2, 2018-2029
Table 23: Middle East & Africa Seafood Food Safety Testing Service Market Revenue (USD Billion) Forecast, by Segment 3, 2018-2029
Table 24: Middle East & Africa Seafood Food Safety Testing Service Market Revenue (USD Billion) Forecast, by Country, 2018-2029
Research Process
Data Library Research are conducted by industry experts who offer insight on
industry structure, market segmentations technology assessment and competitive landscape (CL), and penetration, as well as on emerging trends. Their analysis is based on primary interviews (~ 80%) and secondary research (~ 20%) as well as years of professional expertise in their respective industries. Adding to this, by analysing historical trends and current market positions, our analysts predict where the market will be headed for the next five years. Furthermore, the varying trends of segment & categories geographically presented are also studied and the estimated based on the primary & secondary research.
In this particular report from the supply side Data Library Research has conducted primary surveys (interviews) with the key level executives (VP, CEO’s, Marketing Director, Business Development Manager
and SOFT) of the companies that active & prominent as well as the midsized organization
FIGURE 1: DLR RESEARH PROCESS
![research-methodology1]()
Primary Research
Extensive primary research was conducted to gain a deeper insight of the market and industry performance. The analysis is based on both primary and secondary research as well as years of professional expertise in the respective industries.
In addition to analysing current and historical trends, our analysts predict where the market is headed over the next five years.
It varies by segment for these categories geographically presented in the list of market tables. Speaking about this particular report we have conducted primary surveys (interviews) with the key level executives (VP, CEO’s, Marketing Director, Business Development Manager and many more) of the major players active in the market.
Secondary Research
Secondary research was mainly used to collect and identify information useful for the extensive, technical, market-oriented, and Friend’s study of the Global Extra Neutral Alcohol. It was also used to obtain key information about major players, market classification and segmentation according to the industry trends, geographical markets, and developments related to the market and technology perspectives. For this study, analysts have gathered information from various credible sources, such as annual reports, sec filings, journals, white papers, SOFT presentations, and company web sites.
Market Size Estimation
Both, top-down and bottom-up approaches were used to estimate and validate the size of the Global market and to estimate the size of various other dependent submarkets in the overall Extra Neutral Alcohol. The key players in the market were identified through secondary research and their market contributions in the respective geographies were determined through primary and secondary research.
Forecast Model
![research-methodology2]()