Highly Accelerated Life Testing (HALT) Market Overview and Analysis:
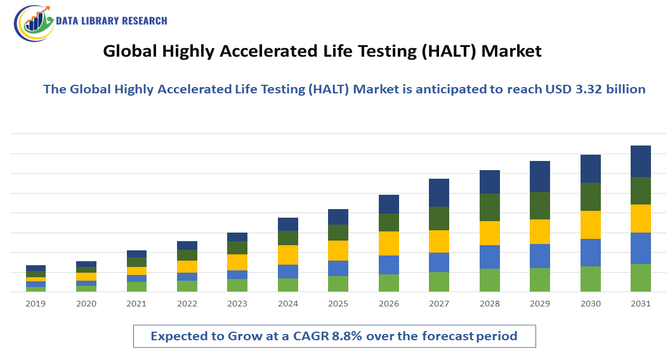
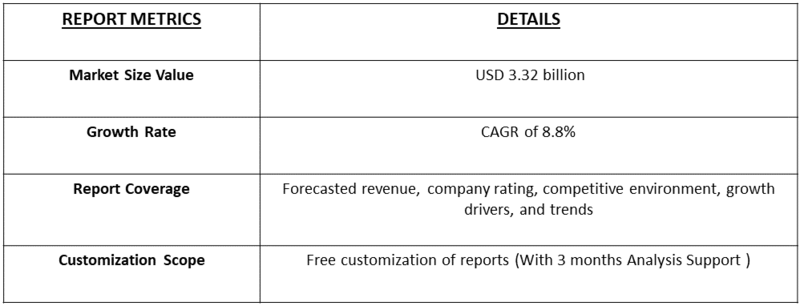
- The Global Highly Accelerated Life Testing (HALT) and Highly Accelerated Stress Screening (HASS) testing services market was valued at around USD 0.66 billion in 2025 and is forecast to reach approximately USD 3.32 billion by 2032. This growth is driven by the demand for high-quality, durable products across aerospace and electronics industries, projecting a robust Compound Annual Growth Rate (CAGR) of about 8.8% from 2025 to 2032.
Get Complete Analysis Of The Report - Download Updated Free Sample PDF
The growth of the Global HALT Market is primarily driven by the rising need for rapid product reliability validation, increasing complexity of electronic components, and the push for shorter development cycles across sectors such as aerospace, automotive, consumer electronics, and semiconductors. Additionally, growing emphasis on minimizing product failure rates, improving quality assurance, and accelerating time-to-market further fuels the adoption of HALT systems globally.
Highly Accelerated Life Testing (HALT) Market Latest Trends
Global Highly Accelerated Life Testing (HALT) market include the integration of IoT and AI-driven analytics into HALT test systems, enabling real-time data collection, remote monitoring, and predictive failure detection. There’s also a growing shift toward compact, miniaturized HALT chambers designed to test small electronic components and semiconductor devices, which helps manufacturers in sectors like consumer electronics and medical devices optimize space and cost.
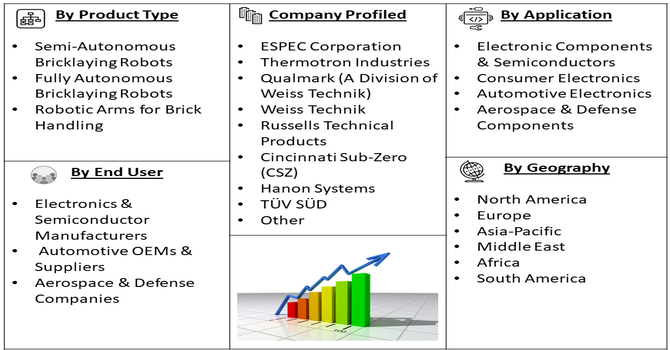
Segmentation: Global Highly Accelerated Life Testing (HALT) Market is segmented By Component (HALT Chambers, Vibration Systems, Temperature Cycling Systems, Software & Control Systems), Offering (Equipment, HALT Testing Services, Maintenance & Calibration Services), Application (Electronic Components & Semiconductors, Consumer Electronics, Automotive Electronics, Aerospace & Defense Components), End User Industry (Electronics & Semiconductor Manufacturers, Automotive OEMs & Suppliers, Aerospace & Defense Companies), and Geography (North America, Europe, Asia-Pacific, Middle East and Africa, and South America). The report provides the value (in USD million) for the above segments.
For Detailed Market Segmentation - Get a Free Sample PDF
Market Drivers:
- Rising Complexity of Electronic Products and the Need for Early-Stage Failure Detection
The rapid evolution of electronic components—such as integrated circuits, sensors, microprocessors, and power electronics—has significantly increased design complexity, making products more susceptible to performance deviations and hidden defects. As industries push for miniaturization, higher power density, and multifunctional designs, traditional reliability testing methods are no longer sufficient to reveal early-life weaknesses.
HALT provides an accelerated method to expose design flaws, workmanship defects, and material limitations at the prototype stage by subjecting products to extreme thermal, vibration, and stress conditions. This capability helps manufacturers strengthen product robustness before mass production, reduce warranty claims, and prevent costly field failures. As quality and reliability become core competitive differentiators in electronics, aerospace, automotive, and medical industries, the demand for HALT solutions continues to rise sharply.
- Increasing Regulatory and Quality Compliance Requirements Across Critical Industries
Industries such as aerospace & defense, automotive electronics, medical devices, and telecom equipment are governed by stringent safety, performance, and durability standards. Regulatory bodies—including the FDA, ISO, IEC, SAE, and DO-160—require manufacturers to validate product reliability under harsh environmental conditions before commercial deployment. HALT plays a vital role in meeting these compliance expectations by enabling rapid identification of operational limits, margin weaknesses, and catastrophic failure points. For sectors where reliability is mission-critical, such as avionics systems, automotive ADAS electronics, and implantable medical devices, HALT helps ensure products meet strict lifecycle and safety thresholds. As global regulatory frameworks tighten and industries adopt a “zero-defect” approach, the demand for accelerated reliability testing methodologies like HALT is growing rapidly, driving sustained market expansion.
Market Restraints:
- High Initial Investment and Operational Costs
The growth of the Global HALT Market is constrained by several key factors, primarily the high initial investment and operational costs associated with advanced HALT chambers and testing systems. These test environments require sophisticated thermal cycling, vibration equipment, and control systems, making them too expensive for small and medium-sized manufacturers. Additionally, lack of standardization in HALT procedures across industries limits adoption, as companies may hesitate to invest in a process that is not mandated by regulatory bodies or universally accepted reliability frameworks.
Socio-Economic Impact on Highly Accelerated Life Testing (HALT) Market
The global Highly Accelerated Life Testing (HALT) market has significant socioeconomic impacts by improving the reliability and durability of products across industries such as electronics, automotive, aerospace, and consumer goods. By detecting failures early, HALT reduces warranty costs, minimizes product recalls, and enhances customer satisfaction. It also supports innovation, job creation in testing and engineering, and efficient use of resources, contributing to economic growth and sustainability while ensuring safer, longer-lasting products for society.
Segmental Analysis:
- HALT Chambers segment is expected to witness highest growth over the forecast period
HALT chambers represent the most critical component of the market, as they enable accelerated stress testing through extreme temperature and vibration conditions. These chambers are widely adopted across electronics, automotive, and aerospace industries due to their ability to quickly uncover design flaws, thermal weaknesses, and latent failures during product development. Their growing sophistication—such as improved thermal ramp rates and multi-axis vibration capabilities—is driving strong demand for advanced reliability testing infrastructure.
- HALT Testing Services segment is expected to witness highest growth over the forecast period
HALT testing services are witnessing rising adoption, especially among small and mid-sized manufacturers that lack in-house reliability laboratories. These service providers offer specialized testing expertise, certified facilities, and access to high-end HALT chambers, making it cost-effective for companies to validate new products. The trend toward outsourcing reliability verification, combined with faster product launch cycles, is accelerating the growth of this segment.
- Electronic Components & Semiconductors segment is expected to witness highest growth over the forecast period
Electronic components and semiconductors dominate HALT applications, driven by the need to ensure high durability and performance in increasingly miniaturized and complex devices. Semiconductor companies rely heavily on HALT to detect early-life failures, evaluate material resilience, and validate next-generation chips and boards used in high-demand applications such as 5G, IoT, EVs, and AI systems. The rapid pace of innovation in this sector continues to boost HALT adoption.
- Electronics & Semiconductor Manufacturers segment is expected to witness highest growth over the forecast period
Electronics and semiconductor manufacturers represent the largest end-user group, as they face stringent reliability standards and shorter product development windows. With the rise of advanced electronics in consumer devices, automotive systems, and industrial automation, these companies increasingly integrate HALT into their R&D cycles to reduce field failure rates and warranty costs. Continuous product innovation in this industry ensures sustained demand for HALT solutions.
- North America segment is expected to witness highest growth over the forecast period
North America holds a leading position in the HALT market, supported by strong technological infrastructure, a large base of electronics and aerospace manufacturers, and widespread adoption of advanced reliability engineering practices. The presence of major HALT equipment providers and testing laboratories further strengthens regional growth. Regulatory pressures for product reliability and the push toward accelerated product qualification continue to enhance market expansion in the region.
Moreover, The HALT market in North America is further propelled by increasing investment in research and development, particularly in sectors like automotive, aerospace, and consumer electronics, where product reliability is critical. Companies are adopting HALT to shorten development cycles, reduce costs associated with field failures, and improve overall product quality. Collaboration between industry leaders, testing service providers, and academic institutions fosters innovation in testing methodologies, ensuring faster, more accurate identification of design weaknesses. This ecosystem not only strengthens the regional HALT market but also sets industry benchmarks for reliability standards globally, reinforcing North America’s leadership in accelerated life testing technologies.
To Learn More About This Report - Request a Free Sample Copy
Highly Accelerated Life Testing (HALT) Market Competitive Landscape
The competitive landscape of the Global Highly Accelerated Life Testing (HALT) Market is characterized by a mix of established reliability equipment manufacturers, specialized testing service providers, and advanced environmental chamber developers. Leading companies are focusing on expanding their HALT chamber capabilities, integrating IoT-enabled monitoring, enhancing vibration systems, and offering comprehensive service packages that include calibration and certification. Strategic partnerships with semiconductor, aerospace, and automotive OEMs, along with investments in next-generation stress-testing technologies, are strengthening market positions.
- ESPEC Corporation
- Thermotron Industries
- Qualmark (A Division of Weiss Technik)
- Weiss Technik
- Russells Technical Products
- Cincinnati Sub-Zero (CSZ)
- Hanon Systems
- Unholtz-Dickie Corporation
- Dow-Key Microwave Corporation
- NTS (National Technical Systems)
- Intertek Group
- TÜV SÜD
- Eurofins Scientific
- SGS SA
- Element Materials Technology
- Microtek Laboratories
- Envisys Technologies
- Associated Environmental Systems (AES)
- PZLTech
- Darwin Chambers
Recent Development
- In November 2025, Enerin raised EUR 15 million in a Series A led by Climentum Capital, The Footprint Firm, Johnson Controls, and Move Energy, with additional participation from PSV Hafnium and Momentum. The funding supported development of high-temperature heat pump technologies, enhancing temperature cycling systems and indirectly driving growth in the global Highly Accelerated Life Testing (HALT) market through improved reliability testing applications.
- In November 2025, Wolfspeed, Inc. announced its 1200V SiC six-pack power modules, featuring advanced Gen 4 SiC MOSFET technology and innovative packaging. The modules offered three times greater power cycling capability and 15% higher inverter current in a standard footprint, enhancing temperature cycling systems and indirectly boosting demand for Highly Accelerated Life Testing (HALT) to ensure reliability and performance.
Frequently Asked Questions (FAQ) :
Q1. What are the main growth-driving factors for this market?
The main driver is the growing pressure on manufacturers to quickly launch highly reliable, defect-free products, especially in complex sectors like automotive, aerospace, and consumer electronics. HALT significantly cuts down the time-to-market by rapidly identifying design and manufacturing weaknesses early in the development cycle, reducing expensive recalls and warranty costs down the line.
Q2. What are the main restraining factors for this market?
A primary restraint is the high initial investment cost required for purchasing and maintaining specialized HALT chambers and vibration systems. Furthermore, HALT requires highly trained technical personnel to properly execute the intense testing sequences and accurately interpret the resulting data, which poses a barrier for smaller or less specialized companies entering the market.
Q3. Which segment is expected to witness high growth?
The Electronics and Electrical segment is expected to dominate and witness the highest growth. This is due to the constant proliferation of electronic devices (from smartphones to complex IoT sensors) and the increasing complexity of their components. Manufacturers in this sector heavily rely on HALT to validate product robustness under combined thermal and vibration stresses before mass production.
Q4. Who are the top major players for this market?
The market includes specialized testing equipment manufacturers and third-party service providers. Key players include major testing and certification companies like Intertek, SGS, and NTS, which offer HALT/HASS services. Equipment producers like ESPEC North America and Delserro Engineering Solutions also play a critical role in providing the necessary advanced test chambers.
Q5. Which country is the largest player?
The United States holds the largest market share, predominantly within the North American region. This is driven by its strong presence in highly regulated industries like aerospace, defense, and advanced semiconductors, all of which mandate rigorous reliability testing. The early adoption and widespread use of quality assurance standards in these sectors solidify its leading position.
List of Figures
Figure 1: Global Highly Accelerated Life Testing (HALT) Market Revenue Breakdown (USD Billion, %) by Region, 2022 & 2029
Figure 2: Global Highly Accelerated Life Testing (HALT) Market Value Share (%), By Segment 1, 2022 & 2029
Figure 3: Global Highly Accelerated Life Testing (HALT) Market Forecast (USD Billion), by Sub-Segment 1, 2018-2029
Figure 4: Global Highly Accelerated Life Testing (HALT) Market Forecast (USD Billion), by Sub-Segment 2, 2018-2029
Figure 5: Global Highly Accelerated Life Testing (HALT) Market Value Share (%), By Segment 2, 2022 & 2029
Figure 6: Global Highly Accelerated Life Testing (HALT) Market Forecast (USD Billion), by Sub-Segment 1, 2018-2029
Figure 7: Global Highly Accelerated Life Testing (HALT) Market Forecast (USD Billion), by Sub-Segment 2, 2018-2029
Figure 8: Global Highly Accelerated Life Testing (HALT) Market Forecast (USD Billion), by Sub-Segment 3, 2018-2029
Figure 9: Global Highly Accelerated Life Testing (HALT) Market Forecast (USD Billion), by Others, 2018-2029
Figure 10: Global Highly Accelerated Life Testing (HALT) Market Value Share (%), By Segment 3, 2022 & 2029
Figure 11: Global Highly Accelerated Life Testing (HALT) Market Forecast (USD Billion), by Sub-Segment 1, 2018-2029
Figure 12: Global Highly Accelerated Life Testing (HALT) Market Forecast (USD Billion), by Sub-Segment 2, 2018-2029
Figure 13: Global Highly Accelerated Life Testing (HALT) Market Forecast (USD Billion), by Sub-Segment 3, 2018-2029
Figure 14: Global Highly Accelerated Life Testing (HALT) Market Forecast (USD Billion), by Others, 2018-2029
Figure 15: Global Highly Accelerated Life Testing (HALT) Market Value (USD Billion), by Region, 2022 & 2029
Figure 16: North America Highly Accelerated Life Testing (HALT) Market Value Share (%), By Segment 1, 2022 & 2029
Figure 17: North America Highly Accelerated Life Testing (HALT) Market Forecast (USD Billion), by Sub-Segment 1, 2018-2029
Figure 18: North America Highly Accelerated Life Testing (HALT) Market Forecast (USD Billion), by Sub-Segment 2, 2018-2029
Figure 19: North America Highly Accelerated Life Testing (HALT) Market Value Share (%), By Segment 2, 2022 & 2029
Figure 20: North America Highly Accelerated Life Testing (HALT) Market Forecast (USD Billion), by Sub-Segment 1, 2018-2029
Figure 21: North America Highly Accelerated Life Testing (HALT) Market Forecast (USD Billion), by Sub-Segment 2, 2018-2029
Figure 22: North America Highly Accelerated Life Testing (HALT) Market Forecast (USD Billion), by Sub-Segment 3, 2018-2029
Figure 23: North America Highly Accelerated Life Testing (HALT) Market Forecast (USD Billion), by Others, 2018-2029
Figure 24: North America Highly Accelerated Life Testing (HALT) Market Value Share (%), By Segment 3, 2022 & 2029
Figure 25: North America Highly Accelerated Life Testing (HALT) Market Forecast (USD Billion), by Sub-Segment 1, 2018-2029
Figure 26: North America Highly Accelerated Life Testing (HALT) Market Forecast (USD Billion), by Sub-Segment 2, 2018-2029
Figure 27: North America Highly Accelerated Life Testing (HALT) Market Forecast (USD Billion), by Sub-Segment 3, 2018-2029
Figure 28: North America Highly Accelerated Life Testing (HALT) Market Forecast (USD Billion), by Others, 2018-2029
Figure 29: North America Highly Accelerated Life Testing (HALT) Market Forecast (USD Billion), by U.S., 2018-2029
Figure 30: North America Highly Accelerated Life Testing (HALT) Market Forecast (USD Billion), by Canada, 2018-2029
Figure 31: Latin America Highly Accelerated Life Testing (HALT) Market Value Share (%), By Segment 1, 2022 & 2029
Figure 32: Latin America Highly Accelerated Life Testing (HALT) Market Forecast (USD Billion), by Sub-Segment 1, 2018-2029
Figure 33: Latin America Highly Accelerated Life Testing (HALT) Market Forecast (USD Billion), by Sub-Segment 2, 2018-2029
Figure 34: Latin America Highly Accelerated Life Testing (HALT) Market Value Share (%), By Segment 2, 2022 & 2029
Figure 35: Latin America Highly Accelerated Life Testing (HALT) Market Forecast (USD Billion), by Sub-Segment 1, 2018-2029
Figure 36: Latin America Highly Accelerated Life Testing (HALT) Market Forecast (USD Billion), by Sub-Segment 2, 2018-2029
Figure 37: Latin America Highly Accelerated Life Testing (HALT) Market Forecast (USD Billion), by Sub-Segment 3, 2018-2029
Figure 38: Latin America Highly Accelerated Life Testing (HALT) Market Forecast (USD Billion), by Others, 2018-2029
Figure 39: Latin America Highly Accelerated Life Testing (HALT) Market Value Share (%), By Segment 3, 2022 & 2029
Figure 40: Latin America Highly Accelerated Life Testing (HALT) Market Forecast (USD Billion), by Sub-Segment 1, 2018-2029
Figure 41: Latin America Highly Accelerated Life Testing (HALT) Market Forecast (USD Billion), by Sub-Segment 2, 2018-2029
Figure 42: Latin America Highly Accelerated Life Testing (HALT) Market Forecast (USD Billion), by Sub-Segment 3, 2018-2029
Figure 43: Latin America Highly Accelerated Life Testing (HALT) Market Forecast (USD Billion), by Others, 2018-2029
Figure 44: Latin America Highly Accelerated Life Testing (HALT) Market Forecast (USD Billion), by Brazil, 2018-2029
Figure 45: Latin America Highly Accelerated Life Testing (HALT) Market Forecast (USD Billion), by Mexico, 2018-2029
Figure 46: Latin America Highly Accelerated Life Testing (HALT) Market Forecast (USD Billion), by Rest of Latin America, 2018-2029
Figure 47: Europe Highly Accelerated Life Testing (HALT) Market Value Share (%), By Segment 1, 2022 & 2029
Figure 48: Europe Highly Accelerated Life Testing (HALT) Market Forecast (USD Billion), by Sub-Segment 1, 2018-2029
Figure 49: Europe Highly Accelerated Life Testing (HALT) Market Forecast (USD Billion), by Sub-Segment 2, 2018-2029
Figure 50: Europe Highly Accelerated Life Testing (HALT) Market Value Share (%), By Segment 2, 2022 & 2029
Figure 51: Europe Highly Accelerated Life Testing (HALT) Market Forecast (USD Billion), by Sub-Segment 1, 2018-2029
Figure 52: Europe Highly Accelerated Life Testing (HALT) Market Forecast (USD Billion), by Sub-Segment 2, 2018-2029
Figure 53: Europe Highly Accelerated Life Testing (HALT) Market Forecast (USD Billion), by Sub-Segment 3, 2018-2029
Figure 54: Europe Highly Accelerated Life Testing (HALT) Market Forecast (USD Billion), by Others, 2018-2029
Figure 55: Europe Highly Accelerated Life Testing (HALT) Market Value Share (%), By Segment 3, 2022 & 2029
Figure 56: Europe Highly Accelerated Life Testing (HALT) Market Forecast (USD Billion), by Sub-Segment 1, 2018-2029
Figure 57: Europe Highly Accelerated Life Testing (HALT) Market Forecast (USD Billion), by Sub-Segment 2, 2018-2029
Figure 58: Europe Highly Accelerated Life Testing (HALT) Market Forecast (USD Billion), by Sub-Segment 3, 2018-2029
Figure 59: Europe Highly Accelerated Life Testing (HALT) Market Forecast (USD Billion), by Others, 2018-2029
Figure 60: Europe Highly Accelerated Life Testing (HALT) Market Forecast (USD Billion), by U.K., 2018-2029
Figure 61: Europe Highly Accelerated Life Testing (HALT) Market Forecast (USD Billion), by Germany, 2018-2029
Figure 62: Europe Highly Accelerated Life Testing (HALT) Market Forecast (USD Billion), by France, 2018-2029
Figure 63: Europe Highly Accelerated Life Testing (HALT) Market Forecast (USD Billion), by Italy, 2018-2029
Figure 64: Europe Highly Accelerated Life Testing (HALT) Market Forecast (USD Billion), by Spain, 2018-2029
Figure 65: Europe Highly Accelerated Life Testing (HALT) Market Forecast (USD Billion), by Russia, 2018-2029
Figure 66: Europe Highly Accelerated Life Testing (HALT) Market Forecast (USD Billion), by Rest of Europe, 2018-2029
Figure 67: Asia Pacific Highly Accelerated Life Testing (HALT) Market Value Share (%), By Segment 1, 2022 & 2029
Figure 68: Asia Pacific Highly Accelerated Life Testing (HALT) Market Forecast (USD Billion), by Sub-Segment 1, 2018-2029
Figure 69: Asia Pacific Highly Accelerated Life Testing (HALT) Market Forecast (USD Billion), by Sub-Segment 2, 2018-2029
Figure 70: Asia Pacific Highly Accelerated Life Testing (HALT) Market Value Share (%), By Segment 2, 2022 & 2029
Figure 71: Asia Pacific Highly Accelerated Life Testing (HALT) Market Forecast (USD Billion), by Sub-Segment 1, 2018-2029
Figure 72: Asia Pacific Highly Accelerated Life Testing (HALT) Market Forecast (USD Billion), by Sub-Segment 2, 2018-2029
Figure 73: Asia Pacific Highly Accelerated Life Testing (HALT) Market Forecast (USD Billion), by Sub-Segment 3, 2018-2029
Figure 74: Asia Pacific Highly Accelerated Life Testing (HALT) Market Forecast (USD Billion), by Others, 2018-2029
Figure 75: Asia Pacific Highly Accelerated Life Testing (HALT) Market Value Share (%), By Segment 3, 2022 & 2029
Figure 76: Asia Pacific Highly Accelerated Life Testing (HALT) Market Forecast (USD Billion), by Sub-Segment 1, 2018-2029
Figure 77: Asia Pacific Highly Accelerated Life Testing (HALT) Market Forecast (USD Billion), by Sub-Segment 2, 2018-2029
Figure 78: Asia Pacific Highly Accelerated Life Testing (HALT) Market Forecast (USD Billion), by Sub-Segment 3, 2018-2029
Figure 79: Asia Pacific Highly Accelerated Life Testing (HALT) Market Forecast (USD Billion), by Others, 2018-2029
Figure 80: Asia Pacific Highly Accelerated Life Testing (HALT) Market Forecast (USD Billion), by China, 2018-2029
Figure 81: Asia Pacific Highly Accelerated Life Testing (HALT) Market Forecast (USD Billion), by India, 2018-2029
Figure 82: Asia Pacific Highly Accelerated Life Testing (HALT) Market Forecast (USD Billion), by Japan, 2018-2029
Figure 83: Asia Pacific Highly Accelerated Life Testing (HALT) Market Forecast (USD Billion), by Australia, 2018-2029
Figure 84: Asia Pacific Highly Accelerated Life Testing (HALT) Market Forecast (USD Billion), by Southeast Asia, 2018-2029
Figure 85: Asia Pacific Highly Accelerated Life Testing (HALT) Market Forecast (USD Billion), by Rest of Asia Pacific, 2018-2029
Figure 86: Middle East & Africa Highly Accelerated Life Testing (HALT) Market Value Share (%), By Segment 1, 2022 & 2029
Figure 87: Middle East & Africa Highly Accelerated Life Testing (HALT) Market Forecast (USD Billion), by Sub-Segment 1, 2018-2029
Figure 88: Middle East & Africa Highly Accelerated Life Testing (HALT) Market Forecast (USD Billion), by Sub-Segment 2, 2018-2029
Figure 89: Middle East & Africa Highly Accelerated Life Testing (HALT) Market Value Share (%), By Segment 2, 2022 & 2029
Figure 90: Middle East & Africa Highly Accelerated Life Testing (HALT) Market Forecast (USD Billion), by Sub-Segment 1, 2018-2029
Figure 91: Middle East & Africa Highly Accelerated Life Testing (HALT) Market Forecast (USD Billion), by Sub-Segment 2, 2018-2029
Figure 92: Middle East & Africa Highly Accelerated Life Testing (HALT) Market Forecast (USD Billion), by Sub-Segment 3, 2018-2029
Figure 93: Middle East & Africa Highly Accelerated Life Testing (HALT) Market Forecast (USD Billion), by Others, 2018-2029
Figure 94: Middle East & Africa Highly Accelerated Life Testing (HALT) Market Value Share (%), By Segment 3, 2022 & 2029
Figure 95: Middle East & Africa Highly Accelerated Life Testing (HALT) Market Forecast (USD Billion), by Sub-Segment 1, 2018-2029
Figure 96: Middle East & Africa Highly Accelerated Life Testing (HALT) Market Forecast (USD Billion), by Sub-Segment 2, 2018-2029
Figure 97: Middle East & Africa Highly Accelerated Life Testing (HALT) Market Forecast (USD Billion), by Sub-Segment 3, 2018-2029
Figure 98: Middle East & Africa Highly Accelerated Life Testing (HALT) Market Forecast (USD Billion), by Others, 2018-2029
Figure 99: Middle East & Africa Highly Accelerated Life Testing (HALT) Market Forecast (USD Billion), by GCC, 2018-2029
Figure 100: Middle East & Africa Highly Accelerated Life Testing (HALT) Market Forecast (USD Billion), by South Africa, 2018-2029
Figure 101: Middle East & Africa Highly Accelerated Life Testing (HALT) Market Forecast (USD Billion), by Rest of Middle East & Africa, 2018-2029
List of Tables
Table 1: Global Highly Accelerated Life Testing (HALT) Market Revenue (USD Billion) Forecast, by Segment 1, 2018-2029
Table 2: Global Highly Accelerated Life Testing (HALT) Market Revenue (USD Billion) Forecast, by Segment 2, 2018-2029
Table 3: Global Highly Accelerated Life Testing (HALT) Market Revenue (USD Billion) Forecast, by Segment 3, 2018-2029
Table 4: Global Highly Accelerated Life Testing (HALT) Market Revenue (USD Billion) Forecast, by Region, 2018-2029
Table 5: North America Highly Accelerated Life Testing (HALT) Market Revenue (USD Billion) Forecast, by Segment 1, 2018-2029
Table 6: North America Highly Accelerated Life Testing (HALT) Market Revenue (USD Billion) Forecast, by Segment 2, 2018-2029
Table 7: North America Highly Accelerated Life Testing (HALT) Market Revenue (USD Billion) Forecast, by Segment 3, 2018-2029
Table 8: North America Highly Accelerated Life Testing (HALT) Market Revenue (USD Billion) Forecast, by Country, 2018-2029
Table 9: Europe Highly Accelerated Life Testing (HALT) Market Revenue (USD Billion) Forecast, by Segment 1, 2018-2029
Table 10: Europe Highly Accelerated Life Testing (HALT) Market Revenue (USD Billion) Forecast, by Segment 2, 2018-2029
Table 11: Europe Highly Accelerated Life Testing (HALT) Market Revenue (USD Billion) Forecast, by Segment 3, 2018-2029
Table 12: Europe Highly Accelerated Life Testing (HALT) Market Revenue (USD Billion) Forecast, by Country, 2018-2029
Table 13: Latin America Highly Accelerated Life Testing (HALT) Market Revenue (USD Billion) Forecast, by Segment 1, 2018-2029
Table 14: Latin America Highly Accelerated Life Testing (HALT) Market Revenue (USD Billion) Forecast, by Segment 2, 2018-2029
Table 15: Latin America Highly Accelerated Life Testing (HALT) Market Revenue (USD Billion) Forecast, by Segment 3, 2018-2029
Table 16: Latin America Highly Accelerated Life Testing (HALT) Market Revenue (USD Billion) Forecast, by Country, 2018-2029
Table 17: Asia Pacific Highly Accelerated Life Testing (HALT) Market Revenue (USD Billion) Forecast, by Segment 1, 2018-2029
Table 18: Asia Pacific Highly Accelerated Life Testing (HALT) Market Revenue (USD Billion) Forecast, by Segment 2, 2018-2029
Table 19: Asia Pacific Highly Accelerated Life Testing (HALT) Market Revenue (USD Billion) Forecast, by Segment 3, 2018-2029
Table 20: Asia Pacific Highly Accelerated Life Testing (HALT) Market Revenue (USD Billion) Forecast, by Country, 2018-2029
Table 21: Middle East & Africa Highly Accelerated Life Testing (HALT) Market Revenue (USD Billion) Forecast, by Segment 1, 2018-2029
Table 22: Middle East & Africa Highly Accelerated Life Testing (HALT) Market Revenue (USD Billion) Forecast, by Segment 2, 2018-2029
Table 23: Middle East & Africa Highly Accelerated Life Testing (HALT) Market Revenue (USD Billion) Forecast, by Segment 3, 2018-2029
Table 24: Middle East & Africa Highly Accelerated Life Testing (HALT) Market Revenue (USD Billion) Forecast, by Country, 2018-2029
Research Process
Data Library Research are conducted by industry experts who offer insight on
industry structure, market segmentations technology assessment and competitive landscape (CL), and penetration, as well as on emerging trends. Their analysis is based on primary interviews (~ 80%) and secondary research (~ 20%) as well as years of professional expertise in their respective industries. Adding to this, by analysing historical trends and current market positions, our analysts predict where the market will be headed for the next five years. Furthermore, the varying trends of segment & categories geographically presented are also studied and the estimated based on the primary & secondary research.
In this particular report from the supply side Data Library Research has conducted primary surveys (interviews) with the key level executives (VP, CEO’s, Marketing Director, Business Development Manager
and SOFT) of the companies that active & prominent as well as the midsized organization
FIGURE 1: DLR RESEARH PROCESS
![research-methodology1]()
Primary Research
Extensive primary research was conducted to gain a deeper insight of the market and industry performance. The analysis is based on both primary and secondary research as well as years of professional expertise in the respective industries.
In addition to analysing current and historical trends, our analysts predict where the market is headed over the next five years.
It varies by segment for these categories geographically presented in the list of market tables. Speaking about this particular report we have conducted primary surveys (interviews) with the key level executives (VP, CEO’s, Marketing Director, Business Development Manager and many more) of the major players active in the market.
Secondary Research
Secondary research was mainly used to collect and identify information useful for the extensive, technical, market-oriented, and Friend’s study of the Global Extra Neutral Alcohol. It was also used to obtain key information about major players, market classification and segmentation according to the industry trends, geographical markets, and developments related to the market and technology perspectives. For this study, analysts have gathered information from various credible sources, such as annual reports, sec filings, journals, white papers, SOFT presentations, and company web sites.
Market Size Estimation
Both, top-down and bottom-up approaches were used to estimate and validate the size of the Global market and to estimate the size of various other dependent submarkets in the overall Extra Neutral Alcohol. The key players in the market were identified through secondary research and their market contributions in the respective geographies were determined through primary and secondary research.
Forecast Model
![research-methodology2]()