Netupitant and Palonosetron Hydrochloride Capsules Market Overview and Analysis
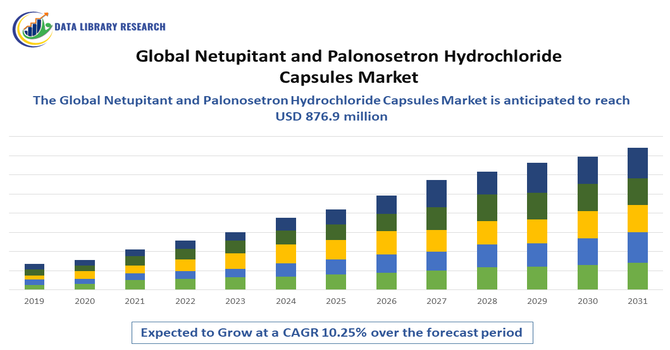
- The Global Netupitant and Palonosetron Hydrochloride Capsules Market size was valued at USD 436.8 million in 2024 and is projected to reach USD 876.9 million by 2032, exhibiting a CAGR of 10.25% from 2025 to 2032.
Get Complete Analysis Of The Report - Download Updated Free Sample PDF
The Global Netupitant and Palonosetron Hydrochloride Capsules Market encompasses the production, distribution, and commercialization of combination antiemetic therapies used to prevent chemotherapy-induced nausea and vomiting, driven by rising cancer prevalence and supportive care demand worldwide. @@@@ This growth is further supported by the increasing prevalence of cancer, which leads to a higher number of chemotherapy treatments and, consequently, a greater need for effective antiemetic solutions. Additionally, the development of generic versions and the expansion of healthcare infrastructure in emerging markets are making these medications more accessible, thereby broadening their adoption. As the demand for effective CINV management continues to rise, the market for Netupitant and Palonosetron Hydrochloride Capsules is poised for sustained growth in the coming years.
Netupitant and Palonosetron Hydrochloride Capsules Market Latest Trends
The Global Netupitant and Palonosetron Hydrochloride Capsules Market is witnessing significant evolution, driven by the increasing adoption of combination therapies for the effective management of chemotherapy-induced nausea and vomiting (CINV). The dual mechanism of action of netupitant and palonosetron offers comprehensive relief, enhancing patient outcomes and encouraging higher utilization in clinical settings. At the same time, the introduction of generic versions is improving accessibility and affordability, particularly in emerging markets, thereby expanding the patient base. Advances in drug delivery technologies, such as extended-release formulations, are further enhancing efficacy and patient compliance, which is contributing to broader market penetration. Strategic collaborations and partnerships among pharmaceutical companies are facilitating wider distribution and co-development of these therapies, while favorable regulatory approvals and supportive reimbursement policies are enabling easier adoption by healthcare providers. Collectively, these factors are driving robust market growth and positioning the Netupitant and Palonosetron Hydrochloride Capsules Market for sustained expansion in the coming years.
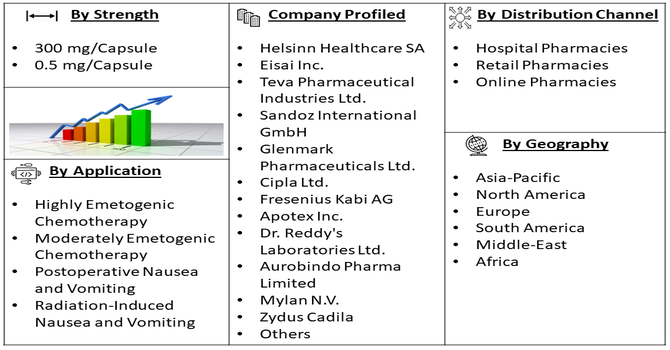
Segmentation: Global Netupitant and Palonosetron Hydrochloride is segmented By Dosage Strength (300 mg/Capsule, 0.5 mg/Capsule), By Application (Highly Emetogenic Chemotherapy, Moderately Emetogenic Chemotherapy, Postoperative Nausea and Vomiting, Radiation-Induced Nausea and Vomiting), By Distribution Channel (Hospital Pharmacies, Retail Pharmacies, Online Pharmacies), and Geography (North America, Europe, Asia-Pacific, Middle East and Africa, and South America). The report provides the value (in USD million) for the above segments.
For Detailed Market Segmentation - Get a Free Sample PDF
Market Drivers:
- Rising Incidence of Cancer and Chemotherapy Treatments
A primary driver of the Global Netupitant and Palonosetron Hydrochloride Market is the increasing prevalence of cancer worldwide, which leads to a higher number of chemotherapy treatments. Chemotherapy-induced nausea and vomiting (CINV) is one of the most common and distressing side effects for patients undergoing cancer therapy, creating strong demand for effective antiemetic medications. Netupitant and palonosetron hydrochloride capsules, with their dual mechanism of action, are widely recognized for preventing both acute and delayed CINV, driving their adoption among oncologists and healthcare providers globally.
For instance, in 2025, WHO reported that in 2020, cancer caused nearly 10 million deaths globally, with the highest number of new cases reported for breast cancer (2.26 million), followed by lung (2.21 million), colon and rectum (1.93 million), prostate (1.41 million), non-melanoma skin (1.20 million), and stomach cancer (1.09 million). This rising incidence of cancer has increased the demand for chemotherapy treatments, subsequently driving growth in the global Netupitant and Palonosetron Hydrochloride Capsules market, as these combination therapies are essential for preventing chemotherapy-induced nausea and vomiting, improving patient adherence, comfort, and overall treatment outcomes.
- Advancements in Combination Therapies and Drug Accessibility
The development and adoption of combination therapies, where netupitant is paired with palonosetron, provide more comprehensive relief from CINV compared to single-agent treatments. This combination therapy improves patient compliance and treatment outcomes, which has increased its acceptance in clinical practice. Additionally, the introduction of generic versions and expansion of healthcare infrastructure in emerging markets has improved accessibility and affordability, further fueling market growth by broadening the patient base.
In May 2025, Verastem Oncology announced that the FDA approved AVMAPKI FAKZYNJA CO-PACK (avutometinib capsules and defactinib tablets) for adults with KRAS-mutated recurrent low-grade serous ovarian cancer who previously received systemic therapy. As the first FDA-approved therapy for this condition, the approval—granted under accelerated pathways—enhances access to targeted combination treatments. Such advancements in oral combination therapies drive innovation, increase drug accessibility, and indirectly boost demand for supportive care products, including Netupitant and Palonosetron Hydrochloride Capsules, in chemotherapy management.
Market Restraints:
- High Cost of the Combination Therapy
The high cost of the combination therapy, which can limit accessibility, especially in price-sensitive and emerging markets. Despite its efficacy, the treatment may be less affordable for patients without adequate insurance coverage or reimbursement, restricting widespread adoption. Additionally, potential side effects, such as headache, constipation, or fatigue, can impact patient compliance and deter some healthcare providers from prescribing it routinely. Regulatory complexities across different regions also pose challenges, as varying approval processes, stringent clinical trial requirements, and differences in labeling or dosing guidelines can delay product launch and market penetration. Collectively, these factors act as key restraints, slowing the overall growth of the netupitant and palonosetron hydrochloride capsules market despite the rising demand for effective antiemetic therapies.
Socio Economic Impact on Netupitant and Palonosetron Hydrochloride Capsules Market
The global Netupitant and Palonosetron Hydrochloride Capsules market has significant socio-economic implications by improving the quality of life for cancer patients through effective prevention of chemotherapy-induced nausea and vomiting (CINV). By reducing the frequency and severity of CINV, these therapies lower hospitalization rates, minimize the need for additional medical interventions, and decrease overall healthcare costs. Improved patient well-being also supports faster recovery, adherence to treatment protocols, and sustained workforce productivity, indirectly benefiting economies. The market drives pharmaceutical innovation, research, and development, generating employment across manufacturing, distribution, and clinical sectors. Furthermore, increased accessibility to these combination therapies strengthens healthcare systems, promotes equitable treatment, and enhances public health outcomes, particularly in regions with rising cancer prevalence.
Segmental Analysis:
- 300 mg dosage strength segment is expected to witness highest growth over the forecast period
The 300 mg dosage strength segment is expected to witness significant growth, primarily because it is widely prescribed for patients undergoing highly emetogenic chemotherapy (HEC), where the risk of severe nausea and vomiting is high. This higher dosage effectively combines the NK1 receptor antagonist (netupitant) with the 5-HT3 receptor antagonist (palonosetron) to provide comprehensive relief from both acute and delayed chemotherapy-induced nausea and vomiting (CINV). Its effectiveness in reducing the severity of CINV ensures better patient compliance and improves quality of life during cancer treatment, making it a preferred choice among oncologists and healthcare providers globally.
- Highly Emetogenic Chemotherapy segment is expected to witness highest growth over the forecast period
The HEC segment dominates the market due to the critical need for effective management of nausea and vomiting associated with high-risk chemotherapy drugs such as cisplatin. Patients receiving HEC are particularly susceptible to both acute (within 24 hours) and delayed (24–120 hours) CINV. Netupitant and palonosetron hydrochloride capsules are highly effective in controlling these symptoms, reducing hospital visits, and minimizing the risk of treatment interruption. The increasing number of cancer cases requiring HEC across North America, Europe, and Asia-Pacific further supports the rapid adoption of these capsules in this application segment.
- Hospital Pharmacies segment is expected to witness highest growth over the forecast period
Hospital pharmacies represent the largest and fastest-growing distribution channel for netupitant and palonosetron hydrochloride capsules. Since chemotherapy treatments are primarily administered in hospital or clinical settings, these pharmacies serve as the main point of access for patients. Hospital pharmacies provide controlled dispensing, ensure proper dosage administration, and facilitate integration with oncologists’ treatment protocols. Additionally, hospitals often benefit from bulk procurement agreements with manufacturers, making this channel cost-effective and reliable for both healthcare providers and patients.
- North America region is expected to witness highest growth over the forecast period
North America is expected to witness the highest growth over the forecast period in the Global Netupitant and Palonosetron Hydrochloride Capsules Market. This robust growth is driven by the region’s high prevalence of cancer and the widespread use of highly emetogenic chemotherapy regimens, which significantly increase the demand for effective antiemetic therapies.
Advanced healthcare infrastructure, well-established oncology treatment centers, and strong reimbursement policies further support the adoption of netupitant and palonosetron hydrochloride capsules. Additionally, growing awareness among patients and healthcare providers regarding the management of chemotherapy-induced nausea and vomiting (CINV) has led to increased preference for combination therapies with proven efficacy. The presence of leading pharmaceutical companies, availability of generic versions, and stringent regulatory frameworks also contribute to the region’s market dominance, positioning North America as the fastest-growing region for these capsules globally.
| Report Matrics |
Details |
| Market Size Value |
USD 876.9 billion |
| Growth Rate |
CAGR of 10.25% |
| Forecast |
2026-2033 |
| Historical data |
2021-2024 |
| Base Year |
2025 |
| Report Coverage |
Forecasted revenue, company rating, competitive environment, growth drivers, and trends |
| Segment Coverage |
Type, Application, End-User, Geography |
| Regional Scope |
North America, Europe, Asia Pacific, Middle East |
| Customized scope |
Free customization of reports (With 3 months Analysis Support ) |
| To Learn More About This Report |
Request a Free Sample Copy |
Netupitant and Palonosetron Hydrochloride Capsules Market Competitive Landscape
The global market for Netupitant and Palonosetron Hydrochloride Capsules is characterized by a competitive landscape comprising both established pharmaceutical companies and emerging players. Key industry participants are actively engaged in the development, manufacturing, and commercialization of these combination therapies to address chemotherapy-induced nausea and vomiting (CINV). Market growth is driven by increasing cancer incidence worldwide and rising awareness of effective supportive care treatments. Innovations in formulation, improved drug efficacy, and expanding approvals for various cancer types further boost demand. Additionally, strategic partnerships, mergers, and acquisitions among pharmaceutical companies are accelerating product availability and geographic reach. However, challenges such as high treatment costs and stringent regulatory requirements continue to impact market dynamics.
Key Players:
- Helsinn Healthcare SA
- Eisai Inc.
- Teva Pharmaceutical Industries Ltd.
- Sandoz International GmbH
- Glenmark Pharmaceuticals Ltd.
- Cipla Ltd.
- Fresenius Kabi AG
- Apotex Inc.
- Dr. Reddy's Laboratories Ltd.
- Aurobindo Pharma Limited
- Mylan N.V.
- Zydus Cadila
- Sun Pharmaceutical Industries Ltd.
- Lupin Pharmaceuticals Inc.
- Alkem Laboratories Ltd.
- Hetero Drugs Ltd.
- Torrent Pharmaceuticals Ltd.
- Cadila Pharmaceuticals Ltd.
- Biocon Limited
- Intas Pharmaceuticals Ltd.
Recent Development
- In 2025, A study published by the Journal of Clinical Oncology reported that, among 312 patients with stage III–IVa nasopharyngeal carcinoma undergoing chemotherapy, oral NEPA demonstrated significantly higher complete response and nausea control rates compared with the APR + PALO regimen. The treatment was well tolerated, with mild adverse effects, showing that Netupitant and Palonosetron Hydrochloride Capsules offered superior, long-lasting antiemetic efficacy and improved patients’ overall comfort and nutritional status.
- In 2024, Fosun Pharma focused on developing innovative drugs and high-value medical devices, generating RMB41.07 billion in revenue and RMB2.77 billion in net profit—a 16.08% YoY rise. The company improved operational efficiency with RMB4.48 billion cash flow, up 31.13% YoY, through lean management and cost control. This enhanced efficiency and profitability positively impacted the production, distribution, and global availability of Netupitant and Palonosetron Hydrochloride Capsules.
Frequently Asked Questions (FAQ) :
Q1. What the main growth driving factors for this market?
The primary growth drivers are the rising global incidence of cancer and the subsequent increase in patients undergoing chemotherapy. This fuels the demand for effective supportive care like Netupitant and Palonosetron fixed-dose combination (FDC) capsules, which efficiently prevent chemotherapy-induced nausea and vomiting (CINV). Furthermore, the drug's superior efficacy in controlling both acute and delayed CINV, along with the increasing preference for convenient oral formulations, also significantly propels market expansion.
Q2. What are the main restraining factors for this market?
One key restraining factor is the high cost of CINV drugs like Netupitant-Palonosetron FDC, which can limit accessibility, particularly in developing and low-income regions. Another challenge includes the availability of alternative antiemetic medications and generic versions, leading to increased market competition. Also, contraindications for use in patients with severe renal or hepatic impairment, and the potential for drug-drug interactions, can restrict the eligible patient pool.
Q3. Which segment is expected to witness high growth?
Geographically, the Asia-Pacific (APAC) region is often projected to witness the fastest Compound Annual Growth Rate (CAGR). This high growth is attributed to the rapidly increasing cancer prevalence, significant improvements in healthcare access, and rising adoption of advanced supportive cancer treatments like Netupitant-Palonosetron FDC in countries across the region. The online pharmacy distribution channel is also expected to show fast growth due to consumer preference for convenience.
Q4. Who are the top major players for this market?
The Netupitant and Palonosetron Hydrochloride Capsules market is led by key pharmaceutical players. Major companies in this space include Helsinn Group (Helsinn Birex Pharmaceuticals Ltd.) and Heron Therapeutics, Inc., as well as firms like Acacia Pharma and Eisai Pharmaceutical Pvt Ltd. These companies focus on research, development, and strategic partnerships to maintain and expand their market presence globally.
Q5. Which country is the largest player?
North America, primarily driven by the United States, is consistently reported as the largest regional market in terms of revenue share for Netupitant and Palonosetron FDC. This dominance is due to the region's high cancer incidence rates, well-established and advanced healthcare infrastructure, strong prescription volume, and favorable reimbursement policies that support the use of premium antiemetic combination therapies.
List of Figures
Figure 1: Global Netupitant and Palonosetron Hydrochloride Capsules Market Revenue Breakdown (USD Billion, %) by Region, 2022 & 2029
Figure 2: Global Netupitant and Palonosetron Hydrochloride Capsules Market Value Share (%), By Segment 1, 2022 & 2029
Figure 3: Global Netupitant and Palonosetron Hydrochloride Capsules Market Forecast (USD Billion), by Sub-Segment 1, 2018-2029
Figure 4: Global Netupitant and Palonosetron Hydrochloride Capsules Market Forecast (USD Billion), by Sub-Segment 2, 2018-2029
Figure 5: Global Netupitant and Palonosetron Hydrochloride Capsules Market Value Share (%), By Segment 2, 2022 & 2029
Figure 6: Global Netupitant and Palonosetron Hydrochloride Capsules Market Forecast (USD Billion), by Sub-Segment 1, 2018-2029
Figure 7: Global Netupitant and Palonosetron Hydrochloride Capsules Market Forecast (USD Billion), by Sub-Segment 2, 2018-2029
Figure 8: Global Netupitant and Palonosetron Hydrochloride Capsules Market Forecast (USD Billion), by Sub-Segment 3, 2018-2029
Figure 9: Global Netupitant and Palonosetron Hydrochloride Capsules Market Forecast (USD Billion), by Others, 2018-2029
Figure 10: Global Netupitant and Palonosetron Hydrochloride Capsules Market Value Share (%), By Segment 3, 2022 & 2029
Figure 11: Global Netupitant and Palonosetron Hydrochloride Capsules Market Forecast (USD Billion), by Sub-Segment 1, 2018-2029
Figure 12: Global Netupitant and Palonosetron Hydrochloride Capsules Market Forecast (USD Billion), by Sub-Segment 2, 2018-2029
Figure 13: Global Netupitant and Palonosetron Hydrochloride Capsules Market Forecast (USD Billion), by Sub-Segment 3, 2018-2029
Figure 14: Global Netupitant and Palonosetron Hydrochloride Capsules Market Forecast (USD Billion), by Others, 2018-2029
Figure 15: Global Netupitant and Palonosetron Hydrochloride Capsules Market Value (USD Billion), by Region, 2022 & 2029
Figure 16: North America Netupitant and Palonosetron Hydrochloride Capsules Market Value Share (%), By Segment 1, 2022 & 2029
Figure 17: North America Netupitant and Palonosetron Hydrochloride Capsules Market Forecast (USD Billion), by Sub-Segment 1, 2018-2029
Figure 18: North America Netupitant and Palonosetron Hydrochloride Capsules Market Forecast (USD Billion), by Sub-Segment 2, 2018-2029
Figure 19: North America Netupitant and Palonosetron Hydrochloride Capsules Market Value Share (%), By Segment 2, 2022 & 2029
Figure 20: North America Netupitant and Palonosetron Hydrochloride Capsules Market Forecast (USD Billion), by Sub-Segment 1, 2018-2029
Figure 21: North America Netupitant and Palonosetron Hydrochloride Capsules Market Forecast (USD Billion), by Sub-Segment 2, 2018-2029
Figure 22: North America Netupitant and Palonosetron Hydrochloride Capsules Market Forecast (USD Billion), by Sub-Segment 3, 2018-2029
Figure 23: North America Netupitant and Palonosetron Hydrochloride Capsules Market Forecast (USD Billion), by Others, 2018-2029
Figure 24: North America Netupitant and Palonosetron Hydrochloride Capsules Market Value Share (%), By Segment 3, 2022 & 2029
Figure 25: North America Netupitant and Palonosetron Hydrochloride Capsules Market Forecast (USD Billion), by Sub-Segment 1, 2018-2029
Figure 26: North America Netupitant and Palonosetron Hydrochloride Capsules Market Forecast (USD Billion), by Sub-Segment 2, 2018-2029
Figure 27: North America Netupitant and Palonosetron Hydrochloride Capsules Market Forecast (USD Billion), by Sub-Segment 3, 2018-2029
Figure 28: North America Netupitant and Palonosetron Hydrochloride Capsules Market Forecast (USD Billion), by Others, 2018-2029
Figure 29: North America Netupitant and Palonosetron Hydrochloride Capsules Market Forecast (USD Billion), by U.S., 2018-2029
Figure 30: North America Netupitant and Palonosetron Hydrochloride Capsules Market Forecast (USD Billion), by Canada, 2018-2029
Figure 31: Latin America Netupitant and Palonosetron Hydrochloride Capsules Market Value Share (%), By Segment 1, 2022 & 2029
Figure 32: Latin America Netupitant and Palonosetron Hydrochloride Capsules Market Forecast (USD Billion), by Sub-Segment 1, 2018-2029
Figure 33: Latin America Netupitant and Palonosetron Hydrochloride Capsules Market Forecast (USD Billion), by Sub-Segment 2, 2018-2029
Figure 34: Latin America Netupitant and Palonosetron Hydrochloride Capsules Market Value Share (%), By Segment 2, 2022 & 2029
Figure 35: Latin America Netupitant and Palonosetron Hydrochloride Capsules Market Forecast (USD Billion), by Sub-Segment 1, 2018-2029
Figure 36: Latin America Netupitant and Palonosetron Hydrochloride Capsules Market Forecast (USD Billion), by Sub-Segment 2, 2018-2029
Figure 37: Latin America Netupitant and Palonosetron Hydrochloride Capsules Market Forecast (USD Billion), by Sub-Segment 3, 2018-2029
Figure 38: Latin America Netupitant and Palonosetron Hydrochloride Capsules Market Forecast (USD Billion), by Others, 2018-2029
Figure 39: Latin America Netupitant and Palonosetron Hydrochloride Capsules Market Value Share (%), By Segment 3, 2022 & 2029
Figure 40: Latin America Netupitant and Palonosetron Hydrochloride Capsules Market Forecast (USD Billion), by Sub-Segment 1, 2018-2029
Figure 41: Latin America Netupitant and Palonosetron Hydrochloride Capsules Market Forecast (USD Billion), by Sub-Segment 2, 2018-2029
Figure 42: Latin America Netupitant and Palonosetron Hydrochloride Capsules Market Forecast (USD Billion), by Sub-Segment 3, 2018-2029
Figure 43: Latin America Netupitant and Palonosetron Hydrochloride Capsules Market Forecast (USD Billion), by Others, 2018-2029
Figure 44: Latin America Netupitant and Palonosetron Hydrochloride Capsules Market Forecast (USD Billion), by Brazil, 2018-2029
Figure 45: Latin America Netupitant and Palonosetron Hydrochloride Capsules Market Forecast (USD Billion), by Mexico, 2018-2029
Figure 46: Latin America Netupitant and Palonosetron Hydrochloride Capsules Market Forecast (USD Billion), by Rest of Latin America, 2018-2029
Figure 47: Europe Netupitant and Palonosetron Hydrochloride Capsules Market Value Share (%), By Segment 1, 2022 & 2029
Figure 48: Europe Netupitant and Palonosetron Hydrochloride Capsules Market Forecast (USD Billion), by Sub-Segment 1, 2018-2029
Figure 49: Europe Netupitant and Palonosetron Hydrochloride Capsules Market Forecast (USD Billion), by Sub-Segment 2, 2018-2029
Figure 50: Europe Netupitant and Palonosetron Hydrochloride Capsules Market Value Share (%), By Segment 2, 2022 & 2029
Figure 51: Europe Netupitant and Palonosetron Hydrochloride Capsules Market Forecast (USD Billion), by Sub-Segment 1, 2018-2029
Figure 52: Europe Netupitant and Palonosetron Hydrochloride Capsules Market Forecast (USD Billion), by Sub-Segment 2, 2018-2029
Figure 53: Europe Netupitant and Palonosetron Hydrochloride Capsules Market Forecast (USD Billion), by Sub-Segment 3, 2018-2029
Figure 54: Europe Netupitant and Palonosetron Hydrochloride Capsules Market Forecast (USD Billion), by Others, 2018-2029
Figure 55: Europe Netupitant and Palonosetron Hydrochloride Capsules Market Value Share (%), By Segment 3, 2022 & 2029
Figure 56: Europe Netupitant and Palonosetron Hydrochloride Capsules Market Forecast (USD Billion), by Sub-Segment 1, 2018-2029
Figure 57: Europe Netupitant and Palonosetron Hydrochloride Capsules Market Forecast (USD Billion), by Sub-Segment 2, 2018-2029
Figure 58: Europe Netupitant and Palonosetron Hydrochloride Capsules Market Forecast (USD Billion), by Sub-Segment 3, 2018-2029
Figure 59: Europe Netupitant and Palonosetron Hydrochloride Capsules Market Forecast (USD Billion), by Others, 2018-2029
Figure 60: Europe Netupitant and Palonosetron Hydrochloride Capsules Market Forecast (USD Billion), by U.K., 2018-2029
Figure 61: Europe Netupitant and Palonosetron Hydrochloride Capsules Market Forecast (USD Billion), by Germany, 2018-2029
Figure 62: Europe Netupitant and Palonosetron Hydrochloride Capsules Market Forecast (USD Billion), by France, 2018-2029
Figure 63: Europe Netupitant and Palonosetron Hydrochloride Capsules Market Forecast (USD Billion), by Italy, 2018-2029
Figure 64: Europe Netupitant and Palonosetron Hydrochloride Capsules Market Forecast (USD Billion), by Spain, 2018-2029
Figure 65: Europe Netupitant and Palonosetron Hydrochloride Capsules Market Forecast (USD Billion), by Russia, 2018-2029
Figure 66: Europe Netupitant and Palonosetron Hydrochloride Capsules Market Forecast (USD Billion), by Rest of Europe, 2018-2029
Figure 67: Asia Pacific Netupitant and Palonosetron Hydrochloride Capsules Market Value Share (%), By Segment 1, 2022 & 2029
Figure 68: Asia Pacific Netupitant and Palonosetron Hydrochloride Capsules Market Forecast (USD Billion), by Sub-Segment 1, 2018-2029
Figure 69: Asia Pacific Netupitant and Palonosetron Hydrochloride Capsules Market Forecast (USD Billion), by Sub-Segment 2, 2018-2029
Figure 70: Asia Pacific Netupitant and Palonosetron Hydrochloride Capsules Market Value Share (%), By Segment 2, 2022 & 2029
Figure 71: Asia Pacific Netupitant and Palonosetron Hydrochloride Capsules Market Forecast (USD Billion), by Sub-Segment 1, 2018-2029
Figure 72: Asia Pacific Netupitant and Palonosetron Hydrochloride Capsules Market Forecast (USD Billion), by Sub-Segment 2, 2018-2029
Figure 73: Asia Pacific Netupitant and Palonosetron Hydrochloride Capsules Market Forecast (USD Billion), by Sub-Segment 3, 2018-2029
Figure 74: Asia Pacific Netupitant and Palonosetron Hydrochloride Capsules Market Forecast (USD Billion), by Others, 2018-2029
Figure 75: Asia Pacific Netupitant and Palonosetron Hydrochloride Capsules Market Value Share (%), By Segment 3, 2022 & 2029
Figure 76: Asia Pacific Netupitant and Palonosetron Hydrochloride Capsules Market Forecast (USD Billion), by Sub-Segment 1, 2018-2029
Figure 77: Asia Pacific Netupitant and Palonosetron Hydrochloride Capsules Market Forecast (USD Billion), by Sub-Segment 2, 2018-2029
Figure 78: Asia Pacific Netupitant and Palonosetron Hydrochloride Capsules Market Forecast (USD Billion), by Sub-Segment 3, 2018-2029
Figure 79: Asia Pacific Netupitant and Palonosetron Hydrochloride Capsules Market Forecast (USD Billion), by Others, 2018-2029
Figure 80: Asia Pacific Netupitant and Palonosetron Hydrochloride Capsules Market Forecast (USD Billion), by China, 2018-2029
Figure 81: Asia Pacific Netupitant and Palonosetron Hydrochloride Capsules Market Forecast (USD Billion), by India, 2018-2029
Figure 82: Asia Pacific Netupitant and Palonosetron Hydrochloride Capsules Market Forecast (USD Billion), by Japan, 2018-2029
Figure 83: Asia Pacific Netupitant and Palonosetron Hydrochloride Capsules Market Forecast (USD Billion), by Australia, 2018-2029
Figure 84: Asia Pacific Netupitant and Palonosetron Hydrochloride Capsules Market Forecast (USD Billion), by Southeast Asia, 2018-2029
Figure 85: Asia Pacific Netupitant and Palonosetron Hydrochloride Capsules Market Forecast (USD Billion), by Rest of Asia Pacific, 2018-2029
Figure 86: Middle East & Africa Netupitant and Palonosetron Hydrochloride Capsules Market Value Share (%), By Segment 1, 2022 & 2029
Figure 87: Middle East & Africa Netupitant and Palonosetron Hydrochloride Capsules Market Forecast (USD Billion), by Sub-Segment 1, 2018-2029
Figure 88: Middle East & Africa Netupitant and Palonosetron Hydrochloride Capsules Market Forecast (USD Billion), by Sub-Segment 2, 2018-2029
Figure 89: Middle East & Africa Netupitant and Palonosetron Hydrochloride Capsules Market Value Share (%), By Segment 2, 2022 & 2029
Figure 90: Middle East & Africa Netupitant and Palonosetron Hydrochloride Capsules Market Forecast (USD Billion), by Sub-Segment 1, 2018-2029
Figure 91: Middle East & Africa Netupitant and Palonosetron Hydrochloride Capsules Market Forecast (USD Billion), by Sub-Segment 2, 2018-2029
Figure 92: Middle East & Africa Netupitant and Palonosetron Hydrochloride Capsules Market Forecast (USD Billion), by Sub-Segment 3, 2018-2029
Figure 93: Middle East & Africa Netupitant and Palonosetron Hydrochloride Capsules Market Forecast (USD Billion), by Others, 2018-2029
Figure 94: Middle East & Africa Netupitant and Palonosetron Hydrochloride Capsules Market Value Share (%), By Segment 3, 2022 & 2029
Figure 95: Middle East & Africa Netupitant and Palonosetron Hydrochloride Capsules Market Forecast (USD Billion), by Sub-Segment 1, 2018-2029
Figure 96: Middle East & Africa Netupitant and Palonosetron Hydrochloride Capsules Market Forecast (USD Billion), by Sub-Segment 2, 2018-2029
Figure 97: Middle East & Africa Netupitant and Palonosetron Hydrochloride Capsules Market Forecast (USD Billion), by Sub-Segment 3, 2018-2029
Figure 98: Middle East & Africa Netupitant and Palonosetron Hydrochloride Capsules Market Forecast (USD Billion), by Others, 2018-2029
Figure 99: Middle East & Africa Netupitant and Palonosetron Hydrochloride Capsules Market Forecast (USD Billion), by GCC, 2018-2029
Figure 100: Middle East & Africa Netupitant and Palonosetron Hydrochloride Capsules Market Forecast (USD Billion), by South Africa, 2018-2029
Figure 101: Middle East & Africa Netupitant and Palonosetron Hydrochloride Capsules Market Forecast (USD Billion), by Rest of Middle East & Africa, 2018-2029
List of Tables
Table 1: Global Netupitant and Palonosetron Hydrochloride Capsules Market Revenue (USD Billion) Forecast, by Segment 1, 2018-2029
Table 2: Global Netupitant and Palonosetron Hydrochloride Capsules Market Revenue (USD Billion) Forecast, by Segment 2, 2018-2029
Table 3: Global Netupitant and Palonosetron Hydrochloride Capsules Market Revenue (USD Billion) Forecast, by Segment 3, 2018-2029
Table 4: Global Netupitant and Palonosetron Hydrochloride Capsules Market Revenue (USD Billion) Forecast, by Region, 2018-2029
Table 5: North America Netupitant and Palonosetron Hydrochloride Capsules Market Revenue (USD Billion) Forecast, by Segment 1, 2018-2029
Table 6: North America Netupitant and Palonosetron Hydrochloride Capsules Market Revenue (USD Billion) Forecast, by Segment 2, 2018-2029
Table 7: North America Netupitant and Palonosetron Hydrochloride Capsules Market Revenue (USD Billion) Forecast, by Segment 3, 2018-2029
Table 8: North America Netupitant and Palonosetron Hydrochloride Capsules Market Revenue (USD Billion) Forecast, by Country, 2018-2029
Table 9: Europe Netupitant and Palonosetron Hydrochloride Capsules Market Revenue (USD Billion) Forecast, by Segment 1, 2018-2029
Table 10: Europe Netupitant and Palonosetron Hydrochloride Capsules Market Revenue (USD Billion) Forecast, by Segment 2, 2018-2029
Table 11: Europe Netupitant and Palonosetron Hydrochloride Capsules Market Revenue (USD Billion) Forecast, by Segment 3, 2018-2029
Table 12: Europe Netupitant and Palonosetron Hydrochloride Capsules Market Revenue (USD Billion) Forecast, by Country, 2018-2029
Table 13: Latin America Netupitant and Palonosetron Hydrochloride Capsules Market Revenue (USD Billion) Forecast, by Segment 1, 2018-2029
Table 14: Latin America Netupitant and Palonosetron Hydrochloride Capsules Market Revenue (USD Billion) Forecast, by Segment 2, 2018-2029
Table 15: Latin America Netupitant and Palonosetron Hydrochloride Capsules Market Revenue (USD Billion) Forecast, by Segment 3, 2018-2029
Table 16: Latin America Netupitant and Palonosetron Hydrochloride Capsules Market Revenue (USD Billion) Forecast, by Country, 2018-2029
Table 17: Asia Pacific Netupitant and Palonosetron Hydrochloride Capsules Market Revenue (USD Billion) Forecast, by Segment 1, 2018-2029
Table 18: Asia Pacific Netupitant and Palonosetron Hydrochloride Capsules Market Revenue (USD Billion) Forecast, by Segment 2, 2018-2029
Table 19: Asia Pacific Netupitant and Palonosetron Hydrochloride Capsules Market Revenue (USD Billion) Forecast, by Segment 3, 2018-2029
Table 20: Asia Pacific Netupitant and Palonosetron Hydrochloride Capsules Market Revenue (USD Billion) Forecast, by Country, 2018-2029
Table 21: Middle East & Africa Netupitant and Palonosetron Hydrochloride Capsules Market Revenue (USD Billion) Forecast, by Segment 1, 2018-2029
Table 22: Middle East & Africa Netupitant and Palonosetron Hydrochloride Capsules Market Revenue (USD Billion) Forecast, by Segment 2, 2018-2029
Table 23: Middle East & Africa Netupitant and Palonosetron Hydrochloride Capsules Market Revenue (USD Billion) Forecast, by Segment 3, 2018-2029
Table 24: Middle East & Africa Netupitant and Palonosetron Hydrochloride Capsules Market Revenue (USD Billion) Forecast, by Country, 2018-2029
Research Process
Data Library Research are conducted by industry experts who offer insight on
industry structure, market segmentations technology assessment and competitive landscape (CL), and penetration, as well as on emerging trends. Their analysis is based on primary interviews (~ 80%) and secondary research (~ 20%) as well as years of professional expertise in their respective industries. Adding to this, by analysing historical trends and current market positions, our analysts predict where the market will be headed for the next five years. Furthermore, the varying trends of segment & categories geographically presented are also studied and the estimated based on the primary & secondary research.
In this particular report from the supply side Data Library Research has conducted primary surveys (interviews) with the key level executives (VP, CEO’s, Marketing Director, Business Development Manager
and SOFT) of the companies that active & prominent as well as the midsized organization
FIGURE 1: DLR RESEARH PROCESS
![research-methodology1]()
Primary Research
Extensive primary research was conducted to gain a deeper insight of the market and industry performance. The analysis is based on both primary and secondary research as well as years of professional expertise in the respective industries.
In addition to analysing current and historical trends, our analysts predict where the market is headed over the next five years.
It varies by segment for these categories geographically presented in the list of market tables. Speaking about this particular report we have conducted primary surveys (interviews) with the key level executives (VP, CEO’s, Marketing Director, Business Development Manager and many more) of the major players active in the market.
Secondary Research
Secondary research was mainly used to collect and identify information useful for the extensive, technical, market-oriented, and Friend’s study of the Global Extra Neutral Alcohol. It was also used to obtain key information about major players, market classification and segmentation according to the industry trends, geographical markets, and developments related to the market and technology perspectives. For this study, analysts have gathered information from various credible sources, such as annual reports, sec filings, journals, white papers, SOFT presentations, and company web sites.
Market Size Estimation
Both, top-down and bottom-up approaches were used to estimate and validate the size of the Global market and to estimate the size of various other dependent submarkets in the overall Extra Neutral Alcohol. The key players in the market were identified through secondary research and their market contributions in the respective geographies were determined through primary and secondary research.
Forecast Model
![research-methodology2]()