Oocyte Vitrification Solutions Market Overview and Analysis
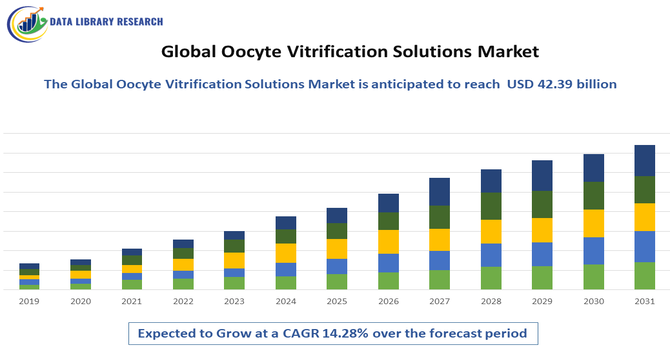
- The Global Oocyte Vitrification Solutions Market size is anticipated to grow from USD 10.12 billion in 2025 to USD 42.39 billion by 2032, achieving a CAGR of 14.28% from 2025-2032.
Get Complete Analysis Of The Report - Download Updated Free Sample PDF
The Global Oocyte Vitrification Solutions Market refers to the worldwide industry of cryopreservation technologies, devices, and solutions used to freeze and store human eggs (oocytes) for assisted reproduction, fertility preservation, and research, driving advancements in reproductive medicine.
The Global Oocyte Vitrification Solutions Market is witnessing strong growth driven by rising demand for fertility preservation among women due to career planning, delayed pregnancies, and increasing infertility rates caused by lifestyle changes, stress, and medical conditions such as endometriosis and PCOS. Advancements in cryopreservation technologies, higher success rates of vitrification compared to traditional slow-freezing, and increasing adoption across IVF clinics and egg-freezing programs are accelerating market expansion.
Oocyte Vitrification Solutions Market Latest Trends:
Latest trends in the global oocyte vitrification solutions market include the broader acceptance of egg-freezing for social and elective reasons, not just medical infertility or oncofertility preservation, supported by improved success rates of vitrification over older slow-freezing methods. Technological advances are also shifting the market, with development of more efficient vitrification kits and devices, container designs that improve stability, and cryopreservation protocols that enhance post-thaw survival of oocytes and thus increase confidence among clinicians and patients.
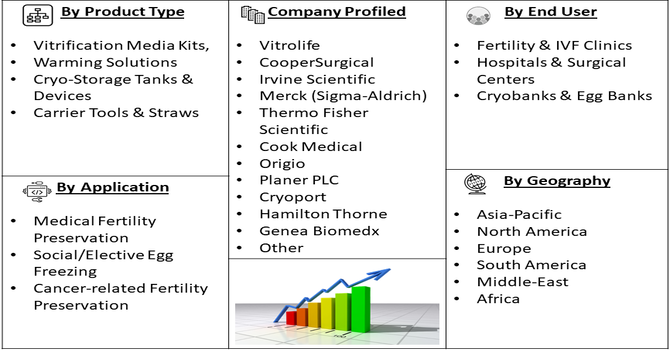
Segmentation: Global Oocyte Vitrification Solutions Market is segmented By Product Type (Vitrification Media Kits, Warming Solutions, Cryo-Storage Tanks & Devices, Carrier Tools & Straws), Procedure (In-Vitro Fertilization (IVF), Intracytoplasmic Sperm Injection, Egg Banking & Preservation), End User (Fertility & IVF Clinics, Hospitals & Surgical Centers, Cryobanks & Egg Banks), Application (Medical Fertility Preservation, Social/Elective Egg Freezing, Cancer-related Fertility Preservation), and Geography (North America, Europe, Asia-Pacific, Middle East and Africa, and South America). The report provides the value (in USD million) for the above segments.
For Detailed Market Segmentation - Get a Free Sample PDF
Market Drivers:
- Rising Demand for Elective Fertility Preservation and Delayed Childbearing
Growing trends of late motherhood driven by career priorities, lifestyle changes, financial planning, and personal choice are significantly boosting the demand for oocyte freezing solutions. Increasing awareness about reproductive aging, improvements in success rates of egg freezing, and expanding social egg-freezing programs by fertility clinics and employers offering fertility benefits are further accelerating market growth. The rising number of women opting to preserve fertility in their 20s and early 30s is pushing IVF centers to adopt advanced vitrification media and cryo-storage systems, supporting strong market expansion.
- Increasing Oncofertility Procedures and Medical Fertility Preservation Programs
Cancer incidence among women of reproductive age continues to rise, and chemotherapy or radiation often compromises future fertility. This has driven rapid adoption of oocyte vitrification as a standard-of-care fertility preservation method for oncology patients. National health programs, insurance coverage improvements in developed economies, and guidelines from reproductive health authorities endorsing pre-treatment egg freezing are strengthening market demand. Technological advancements in cryoprotectants and ultra-rapid freezing protocols are enabling higher survival rates of cancer patients’ oocytes post-thaw, fueling use in fertility clinics and cryobanks globally.
Market Restraints
High treatment costs associated with egg freezing cycles, storage fees, and vitrification media remain a major barrier, particularly in developing economies with limited reimbursement support. Ethical and regulatory uncertainties surrounding elective fertility preservation, gamete storage duration, and embryo manipulation also challenge market expansion. Limited awareness in low- and middle-income regions and disparities in access to ART facilities reduce uptake among the broader population. Additionally, technical challenges including variability in survival rates depending on lab expertise, reliance on skilled embryologists, and risks of oocyte damage during freezing or thawing constrain outcomes and discourage some patients. Concerns about long-term maternal and neonatal safety outcomes in elective egg freezing further influence decision-making, slowing widespread adoption.
Socio Economic Impact on Oocyte Vitrification Solutions Market
Oocyte vitrification profoundly impacts modern society by offering women reproductive autonomy, allowing them to delay childbearing for career, education, or financial stability without facing age-related fertility decline. Economically, this market fuels a multi-billion dollar industry, driving investment in Assisted Reproductive Technologies (ART) and creating specialized jobs in IVF clinics and biobanks. Societally, while it addresses the growing trend of delayed parenthood, the high cost of the procedure (often $8,000–$20,000 per cycle) creates a significant socioeconomic disparity, making this "fertility insurance" primarily accessible to women from higher-income brackets. Furthermore, it raises ethical debates regarding the long-term storage of gametes and potential pressure on young women to freeze their eggs.
Segmental Analysis:
- Vitrification Media Kits segment is expected to witness highest growth over the forecast period
The vitrification media kits segment is expected to dominate the market, driven by their crucial role in ensuring successful oocyte cryopreservation and thawing. With improved formulations offering higher cell survival rates, reduced ice crystal formation, and optimized cryoprotectant concentrations, these kits enhance post-thaw viability and fertilization success. Ongoing R&D to develop GMP-certified, non-toxic, ready-to-use kits designed for standardized lab workflows is boosting adoption in IVF centers globally.
- In-Vitro Fertilization (IVF) segment is expected to witness highest growth over the forecast period
In-Vitro Fertilization (IVF) represents the leading procedure segment, supported by rising infertility rates, delayed family planning, and increasing preference for assisted reproductive technologies. The integration of vitrified oocytes into IVF cycles improves flexibility for both fresh and frozen cycles and allows better ovarian stimulation planning. Growing success rates and wider insurance coverage in certain regions are further accelerating demand for IVF-linked vitrification services.
- Fertility & IVF Clinics segment is expected to witness highest growth over the forecast period
Fertility & IVF clinics constitute the largest end-user segment, as they are primary providers of egg freezing services, embryo culture, and ART treatments. These clinics extensively rely on vitrification solutions for oocyte banking, donor egg programs, and IVF cycle optimization. Expansion of IVF networks, rising patient volume, strategic clinic partnerships with cryobanks, and adoption of automated cryostorage technologies strengthen this segment’s growth trajectory.
- North America is expected to witness highest growth over the forecast period
North America holds a significant share and is projected to grow steadily due to high ART acceptance rates, strong healthcare infrastructure, supportive reimbursement trends for fertility preservation, and widespread awareness of egg-freezing options. The region also benefits from advanced cryobank networks, growing numbers of fertility clinics, and technological innovation driven by leading reproductive medicine research institutions.
In June 2025, FIGO launched a landmark special section in the International Journal of Gynecology & Obstetrics (IJGO), highlighting oncofertility cryopreservation, a key intersection of oncology and reproductive medicine. Curated by the FIGO Committee on Reproductive Medicine, Endocrinology, and Infertility, the collection provided best-practice guidance for preserving fertility in cancer patients of reproductive age. Addressing gaps in awareness, access, and infrastructure, this initiative strengthened global clinical standards and positively impacted the Global Oocyte Vitrification Solutions Market by driving demand in this region for advanced fertility preservation technologies.
Similarly in October 2025, an article published titled, “Efficacy and safety of a one-step warming protocol of vitrified blastocyst stage embryos”, reported a retrospective cohort study evaluated the impact of a one-step warming protocol versus traditional multi-step warming on 1,402 vitrified-warmed blastocysts from 989 patients across three clinics. Results demonstrated comparable survival, clinical pregnancy, and ongoing pregnancy rates across all subgroups, including maternal age, embryo quality, day of vitrification, and fertilization method. These findings validated the efficiency and reliability of the one-step approach, reinforcing adoption of streamlined protocols and positively influencing the Global Oocyte Vitrification Solutions Market by supporting demand for simplified, effective embryo warming technologies. Thus, all such factors are driving the growth of above market in this region.
| Report Matrics |
Details |
| Market Size Value |
USD 42.39 billion |
| Growth Rate |
CAGR of 14.28% |
| Forecast |
2026-2033 |
| Historical data |
2021-2024 |
| Base Year |
2025 |
| Report Coverage |
Forecasted revenue, company rating, competitive environment, growth drivers, and trends |
| Segment Coverage |
Type, Application, End-User, Geography |
| Regional Scope |
North America, Europe, Asia Pacific, Middle East |
| Customized scope |
Free customization of reports (With 3 months Analysis Support ) |
| To Learn More About This Report |
Request a Free Sample Copy |
Oocyte Vitrification Solutions Market Competitive Landscape:
The market is populated by specialized reproductive-health suppliers, cryopreservation kit manufacturers, cryobanking service providers and laboratory-equipment firms competing on vitrification efficacy, regulatory compliance, ease-of-use, and clinic partnerships.
Key Players:
- Vitrolife
- CooperSurgical
- Irvine Scientific
- Merck (Sigma-Aldrich)
- Thermo Fisher Scientific
- Cook Medical
- Origio
- Planer PLC
- Cryoport
- Hamilton Thorne
- Genea Biomedx
- Minitube International
- BioLife Solutions
- Esco Lifesciences
- CryoSave
- California Cryobank
- CryoTech (Cryogenic equipment suppliers)
- CryoPro Systems
- CellBank (cryostorage service providers)
- Cryologic (cryopreservation consumables suppliers)
Recent Development
- In September 2025, Overture Life, a innovator in modernizing IVF to enhance reproductive freedom, announced the launch of its European preorder waitlist for DaVitri, the world’s first automated vitrification platform. The initiative ensured that IVF clinics across Europe were among the first to adopt DaVitri, enabling them to minimize manual workloads for embryologists, reduce operator variability, and deliver faster, more consistent, and higher-quality procedures—strengthening Overture Life’s position as a key driver of automation and innovation in reproductive healthcare.
- In May 2025, Overture Life, a pioneer in modernizing IVF to enhance reproductive freedom, announced the launch of its DaVitri platform for fertility preservation in Brazil’s IVF clinics, following ANVISA’s clearance as a Class I medical device. With this approval, Brazil became the sixth country in South and Central America to adopt DaVitri, after its recent debut in Peru. Embryologists across these regions utilized DaVitri to automate vitrification, standardize delicate procedures, and improve consistency, ultimately reducing the number of IVF cycles needed for successful pregnancies.
Frequently Asked Questions (FAQ) :
Q1. What are the main growth driving factors for this market?
Key growth drivers include the increasing trend of delayed childbearing, as more women prioritize their careers and education, leading to greater demand for fertility preservation. A rising global incidence of infertility, coupled with growing public awareness and acceptance of Assisted Reproductive Technologies (ART) like In-Vitro Fertilization (IVF), also strongly fuels the market. Furthermore, supportive policies by companies and governments covering egg freezing expenses contribute significantly.
Q2. What are the main restraining factors for this market?
The main limitations are the high cost associated with the oocyte vitrification procedure and the overall IVF treatment, making it inaccessible to many. Also, the market faces strict and complex ethical and regulatory hurdles concerning the storage, ownership, and destruction of reproductive material, which varies significantly by country. The need for highly specialized and trained personnel to perform the delicate procedures can also restrict market expansion.
Q3. Which segment is expected to witness high growth?
The Kits and Consumables segment is expected to witness particularly high growth. This is because vitrification procedures, which include the rapid freezing of oocytes, rely heavily on specialized, single-use solutions, straws, and media to ensure high success rates and cell viability. The increasing number of IVF cycles performed globally directly drives the consumption of these essential, proprietary kits and consumables.
Q4. Who are the top major players for this market?
The market is led by companies specializing in fertility and life sciences equipment. Top major players include Vitrolife AB, The Cooper Companies (CooperSurgical), Cook Group (Cook Medical), and Kitazato Corporation. These companies provide a comprehensive portfolio of media, cryopreservation devices, and consumables crucial for the vitrification process. Their dominance is based on technological advancements, strong regulatory approvals, and extensive distribution networks in IVF clinics.
Q5. Which country is the largest player?
Europe, as a region, and specifically the United States within North America, are often cited as the largest market players by revenue. Europe's dominance is attributed to high historical adoption of ART and advanced healthcare infrastructure, with countries like Germany and the UK being major contributors. The United States also holds a substantial share due to high IVF adoption, significant investment in research, and rising demand for elective fertility preservation.
List of Figures
Figure 1: Global Oocyte Vitrification Solutions Market Revenue Breakdown (USD Billion, %) by Region, 2022 & 2029
Figure 2: Global Oocyte Vitrification Solutions Market Value Share (%), By Segment 1, 2022 & 2029
Figure 3: Global Oocyte Vitrification Solutions Market Forecast (USD Billion), by Sub-Segment 1, 2018-2029
Figure 4: Global Oocyte Vitrification Solutions Market Forecast (USD Billion), by Sub-Segment 2, 2018-2029
Figure 5: Global Oocyte Vitrification Solutions Market Value Share (%), By Segment 2, 2022 & 2029
Figure 6: Global Oocyte Vitrification Solutions Market Forecast (USD Billion), by Sub-Segment 1, 2018-2029
Figure 7: Global Oocyte Vitrification Solutions Market Forecast (USD Billion), by Sub-Segment 2, 2018-2029
Figure 8: Global Oocyte Vitrification Solutions Market Forecast (USD Billion), by Sub-Segment 3, 2018-2029
Figure 9: Global Oocyte Vitrification Solutions Market Forecast (USD Billion), by Others, 2018-2029
Figure 10: Global Oocyte Vitrification Solutions Market Value Share (%), By Segment 3, 2022 & 2029
Figure 11: Global Oocyte Vitrification Solutions Market Forecast (USD Billion), by Sub-Segment 1, 2018-2029
Figure 12: Global Oocyte Vitrification Solutions Market Forecast (USD Billion), by Sub-Segment 2, 2018-2029
Figure 13: Global Oocyte Vitrification Solutions Market Forecast (USD Billion), by Sub-Segment 3, 2018-2029
Figure 14: Global Oocyte Vitrification Solutions Market Forecast (USD Billion), by Others, 2018-2029
Figure 15: Global Oocyte Vitrification Solutions Market Value (USD Billion), by Region, 2022 & 2029
Figure 16: North America Oocyte Vitrification Solutions Market Value Share (%), By Segment 1, 2022 & 2029
Figure 17: North America Oocyte Vitrification Solutions Market Forecast (USD Billion), by Sub-Segment 1, 2018-2029
Figure 18: North America Oocyte Vitrification Solutions Market Forecast (USD Billion), by Sub-Segment 2, 2018-2029
Figure 19: North America Oocyte Vitrification Solutions Market Value Share (%), By Segment 2, 2022 & 2029
Figure 20: North America Oocyte Vitrification Solutions Market Forecast (USD Billion), by Sub-Segment 1, 2018-2029
Figure 21: North America Oocyte Vitrification Solutions Market Forecast (USD Billion), by Sub-Segment 2, 2018-2029
Figure 22: North America Oocyte Vitrification Solutions Market Forecast (USD Billion), by Sub-Segment 3, 2018-2029
Figure 23: North America Oocyte Vitrification Solutions Market Forecast (USD Billion), by Others, 2018-2029
Figure 24: North America Oocyte Vitrification Solutions Market Value Share (%), By Segment 3, 2022 & 2029
Figure 25: North America Oocyte Vitrification Solutions Market Forecast (USD Billion), by Sub-Segment 1, 2018-2029
Figure 26: North America Oocyte Vitrification Solutions Market Forecast (USD Billion), by Sub-Segment 2, 2018-2029
Figure 27: North America Oocyte Vitrification Solutions Market Forecast (USD Billion), by Sub-Segment 3, 2018-2029
Figure 28: North America Oocyte Vitrification Solutions Market Forecast (USD Billion), by Others, 2018-2029
Figure 29: North America Oocyte Vitrification Solutions Market Forecast (USD Billion), by U.S., 2018-2029
Figure 30: North America Oocyte Vitrification Solutions Market Forecast (USD Billion), by Canada, 2018-2029
Figure 31: Latin America Oocyte Vitrification Solutions Market Value Share (%), By Segment 1, 2022 & 2029
Figure 32: Latin America Oocyte Vitrification Solutions Market Forecast (USD Billion), by Sub-Segment 1, 2018-2029
Figure 33: Latin America Oocyte Vitrification Solutions Market Forecast (USD Billion), by Sub-Segment 2, 2018-2029
Figure 34: Latin America Oocyte Vitrification Solutions Market Value Share (%), By Segment 2, 2022 & 2029
Figure 35: Latin America Oocyte Vitrification Solutions Market Forecast (USD Billion), by Sub-Segment 1, 2018-2029
Figure 36: Latin America Oocyte Vitrification Solutions Market Forecast (USD Billion), by Sub-Segment 2, 2018-2029
Figure 37: Latin America Oocyte Vitrification Solutions Market Forecast (USD Billion), by Sub-Segment 3, 2018-2029
Figure 38: Latin America Oocyte Vitrification Solutions Market Forecast (USD Billion), by Others, 2018-2029
Figure 39: Latin America Oocyte Vitrification Solutions Market Value Share (%), By Segment 3, 2022 & 2029
Figure 40: Latin America Oocyte Vitrification Solutions Market Forecast (USD Billion), by Sub-Segment 1, 2018-2029
Figure 41: Latin America Oocyte Vitrification Solutions Market Forecast (USD Billion), by Sub-Segment 2, 2018-2029
Figure 42: Latin America Oocyte Vitrification Solutions Market Forecast (USD Billion), by Sub-Segment 3, 2018-2029
Figure 43: Latin America Oocyte Vitrification Solutions Market Forecast (USD Billion), by Others, 2018-2029
Figure 44: Latin America Oocyte Vitrification Solutions Market Forecast (USD Billion), by Brazil, 2018-2029
Figure 45: Latin America Oocyte Vitrification Solutions Market Forecast (USD Billion), by Mexico, 2018-2029
Figure 46: Latin America Oocyte Vitrification Solutions Market Forecast (USD Billion), by Rest of Latin America, 2018-2029
Figure 47: Europe Oocyte Vitrification Solutions Market Value Share (%), By Segment 1, 2022 & 2029
Figure 48: Europe Oocyte Vitrification Solutions Market Forecast (USD Billion), by Sub-Segment 1, 2018-2029
Figure 49: Europe Oocyte Vitrification Solutions Market Forecast (USD Billion), by Sub-Segment 2, 2018-2029
Figure 50: Europe Oocyte Vitrification Solutions Market Value Share (%), By Segment 2, 2022 & 2029
Figure 51: Europe Oocyte Vitrification Solutions Market Forecast (USD Billion), by Sub-Segment 1, 2018-2029
Figure 52: Europe Oocyte Vitrification Solutions Market Forecast (USD Billion), by Sub-Segment 2, 2018-2029
Figure 53: Europe Oocyte Vitrification Solutions Market Forecast (USD Billion), by Sub-Segment 3, 2018-2029
Figure 54: Europe Oocyte Vitrification Solutions Market Forecast (USD Billion), by Others, 2018-2029
Figure 55: Europe Oocyte Vitrification Solutions Market Value Share (%), By Segment 3, 2022 & 2029
Figure 56: Europe Oocyte Vitrification Solutions Market Forecast (USD Billion), by Sub-Segment 1, 2018-2029
Figure 57: Europe Oocyte Vitrification Solutions Market Forecast (USD Billion), by Sub-Segment 2, 2018-2029
Figure 58: Europe Oocyte Vitrification Solutions Market Forecast (USD Billion), by Sub-Segment 3, 2018-2029
Figure 59: Europe Oocyte Vitrification Solutions Market Forecast (USD Billion), by Others, 2018-2029
Figure 60: Europe Oocyte Vitrification Solutions Market Forecast (USD Billion), by U.K., 2018-2029
Figure 61: Europe Oocyte Vitrification Solutions Market Forecast (USD Billion), by Germany, 2018-2029
Figure 62: Europe Oocyte Vitrification Solutions Market Forecast (USD Billion), by France, 2018-2029
Figure 63: Europe Oocyte Vitrification Solutions Market Forecast (USD Billion), by Italy, 2018-2029
Figure 64: Europe Oocyte Vitrification Solutions Market Forecast (USD Billion), by Spain, 2018-2029
Figure 65: Europe Oocyte Vitrification Solutions Market Forecast (USD Billion), by Russia, 2018-2029
Figure 66: Europe Oocyte Vitrification Solutions Market Forecast (USD Billion), by Rest of Europe, 2018-2029
Figure 67: Asia Pacific Oocyte Vitrification Solutions Market Value Share (%), By Segment 1, 2022 & 2029
Figure 68: Asia Pacific Oocyte Vitrification Solutions Market Forecast (USD Billion), by Sub-Segment 1, 2018-2029
Figure 69: Asia Pacific Oocyte Vitrification Solutions Market Forecast (USD Billion), by Sub-Segment 2, 2018-2029
Figure 70: Asia Pacific Oocyte Vitrification Solutions Market Value Share (%), By Segment 2, 2022 & 2029
Figure 71: Asia Pacific Oocyte Vitrification Solutions Market Forecast (USD Billion), by Sub-Segment 1, 2018-2029
Figure 72: Asia Pacific Oocyte Vitrification Solutions Market Forecast (USD Billion), by Sub-Segment 2, 2018-2029
Figure 73: Asia Pacific Oocyte Vitrification Solutions Market Forecast (USD Billion), by Sub-Segment 3, 2018-2029
Figure 74: Asia Pacific Oocyte Vitrification Solutions Market Forecast (USD Billion), by Others, 2018-2029
Figure 75: Asia Pacific Oocyte Vitrification Solutions Market Value Share (%), By Segment 3, 2022 & 2029
Figure 76: Asia Pacific Oocyte Vitrification Solutions Market Forecast (USD Billion), by Sub-Segment 1, 2018-2029
Figure 77: Asia Pacific Oocyte Vitrification Solutions Market Forecast (USD Billion), by Sub-Segment 2, 2018-2029
Figure 78: Asia Pacific Oocyte Vitrification Solutions Market Forecast (USD Billion), by Sub-Segment 3, 2018-2029
Figure 79: Asia Pacific Oocyte Vitrification Solutions Market Forecast (USD Billion), by Others, 2018-2029
Figure 80: Asia Pacific Oocyte Vitrification Solutions Market Forecast (USD Billion), by China, 2018-2029
Figure 81: Asia Pacific Oocyte Vitrification Solutions Market Forecast (USD Billion), by India, 2018-2029
Figure 82: Asia Pacific Oocyte Vitrification Solutions Market Forecast (USD Billion), by Japan, 2018-2029
Figure 83: Asia Pacific Oocyte Vitrification Solutions Market Forecast (USD Billion), by Australia, 2018-2029
Figure 84: Asia Pacific Oocyte Vitrification Solutions Market Forecast (USD Billion), by Southeast Asia, 2018-2029
Figure 85: Asia Pacific Oocyte Vitrification Solutions Market Forecast (USD Billion), by Rest of Asia Pacific, 2018-2029
Figure 86: Middle East & Africa Oocyte Vitrification Solutions Market Value Share (%), By Segment 1, 2022 & 2029
Figure 87: Middle East & Africa Oocyte Vitrification Solutions Market Forecast (USD Billion), by Sub-Segment 1, 2018-2029
Figure 88: Middle East & Africa Oocyte Vitrification Solutions Market Forecast (USD Billion), by Sub-Segment 2, 2018-2029
Figure 89: Middle East & Africa Oocyte Vitrification Solutions Market Value Share (%), By Segment 2, 2022 & 2029
Figure 90: Middle East & Africa Oocyte Vitrification Solutions Market Forecast (USD Billion), by Sub-Segment 1, 2018-2029
Figure 91: Middle East & Africa Oocyte Vitrification Solutions Market Forecast (USD Billion), by Sub-Segment 2, 2018-2029
Figure 92: Middle East & Africa Oocyte Vitrification Solutions Market Forecast (USD Billion), by Sub-Segment 3, 2018-2029
Figure 93: Middle East & Africa Oocyte Vitrification Solutions Market Forecast (USD Billion), by Others, 2018-2029
Figure 94: Middle East & Africa Oocyte Vitrification Solutions Market Value Share (%), By Segment 3, 2022 & 2029
Figure 95: Middle East & Africa Oocyte Vitrification Solutions Market Forecast (USD Billion), by Sub-Segment 1, 2018-2029
Figure 96: Middle East & Africa Oocyte Vitrification Solutions Market Forecast (USD Billion), by Sub-Segment 2, 2018-2029
Figure 97: Middle East & Africa Oocyte Vitrification Solutions Market Forecast (USD Billion), by Sub-Segment 3, 2018-2029
Figure 98: Middle East & Africa Oocyte Vitrification Solutions Market Forecast (USD Billion), by Others, 2018-2029
Figure 99: Middle East & Africa Oocyte Vitrification Solutions Market Forecast (USD Billion), by GCC, 2018-2029
Figure 100: Middle East & Africa Oocyte Vitrification Solutions Market Forecast (USD Billion), by South Africa, 2018-2029
Figure 101: Middle East & Africa Oocyte Vitrification Solutions Market Forecast (USD Billion), by Rest of Middle East & Africa, 2018-2029
List of Tables
Table 1: Global Oocyte Vitrification Solutions Market Revenue (USD Billion) Forecast, by Segment 1, 2018-2029
Table 2: Global Oocyte Vitrification Solutions Market Revenue (USD Billion) Forecast, by Segment 2, 2018-2029
Table 3: Global Oocyte Vitrification Solutions Market Revenue (USD Billion) Forecast, by Segment 3, 2018-2029
Table 4: Global Oocyte Vitrification Solutions Market Revenue (USD Billion) Forecast, by Region, 2018-2029
Table 5: North America Oocyte Vitrification Solutions Market Revenue (USD Billion) Forecast, by Segment 1, 2018-2029
Table 6: North America Oocyte Vitrification Solutions Market Revenue (USD Billion) Forecast, by Segment 2, 2018-2029
Table 7: North America Oocyte Vitrification Solutions Market Revenue (USD Billion) Forecast, by Segment 3, 2018-2029
Table 8: North America Oocyte Vitrification Solutions Market Revenue (USD Billion) Forecast, by Country, 2018-2029
Table 9: Europe Oocyte Vitrification Solutions Market Revenue (USD Billion) Forecast, by Segment 1, 2018-2029
Table 10: Europe Oocyte Vitrification Solutions Market Revenue (USD Billion) Forecast, by Segment 2, 2018-2029
Table 11: Europe Oocyte Vitrification Solutions Market Revenue (USD Billion) Forecast, by Segment 3, 2018-2029
Table 12: Europe Oocyte Vitrification Solutions Market Revenue (USD Billion) Forecast, by Country, 2018-2029
Table 13: Latin America Oocyte Vitrification Solutions Market Revenue (USD Billion) Forecast, by Segment 1, 2018-2029
Table 14: Latin America Oocyte Vitrification Solutions Market Revenue (USD Billion) Forecast, by Segment 2, 2018-2029
Table 15: Latin America Oocyte Vitrification Solutions Market Revenue (USD Billion) Forecast, by Segment 3, 2018-2029
Table 16: Latin America Oocyte Vitrification Solutions Market Revenue (USD Billion) Forecast, by Country, 2018-2029
Table 17: Asia Pacific Oocyte Vitrification Solutions Market Revenue (USD Billion) Forecast, by Segment 1, 2018-2029
Table 18: Asia Pacific Oocyte Vitrification Solutions Market Revenue (USD Billion) Forecast, by Segment 2, 2018-2029
Table 19: Asia Pacific Oocyte Vitrification Solutions Market Revenue (USD Billion) Forecast, by Segment 3, 2018-2029
Table 20: Asia Pacific Oocyte Vitrification Solutions Market Revenue (USD Billion) Forecast, by Country, 2018-2029
Table 21: Middle East & Africa Oocyte Vitrification Solutions Market Revenue (USD Billion) Forecast, by Segment 1, 2018-2029
Table 22: Middle East & Africa Oocyte Vitrification Solutions Market Revenue (USD Billion) Forecast, by Segment 2, 2018-2029
Table 23: Middle East & Africa Oocyte Vitrification Solutions Market Revenue (USD Billion) Forecast, by Segment 3, 2018-2029
Table 24: Middle East & Africa Oocyte Vitrification Solutions Market Revenue (USD Billion) Forecast, by Country, 2018-2029
Research Process
Data Library Research are conducted by industry experts who offer insight on
industry structure, market segmentations technology assessment and competitive landscape (CL), and penetration, as well as on emerging trends. Their analysis is based on primary interviews (~ 80%) and secondary research (~ 20%) as well as years of professional expertise in their respective industries. Adding to this, by analysing historical trends and current market positions, our analysts predict where the market will be headed for the next five years. Furthermore, the varying trends of segment & categories geographically presented are also studied and the estimated based on the primary & secondary research.
In this particular report from the supply side Data Library Research has conducted primary surveys (interviews) with the key level executives (VP, CEO’s, Marketing Director, Business Development Manager
and SOFT) of the companies that active & prominent as well as the midsized organization
FIGURE 1: DLR RESEARH PROCESS
![research-methodology1]()
Primary Research
Extensive primary research was conducted to gain a deeper insight of the market and industry performance. The analysis is based on both primary and secondary research as well as years of professional expertise in the respective industries.
In addition to analysing current and historical trends, our analysts predict where the market is headed over the next five years.
It varies by segment for these categories geographically presented in the list of market tables. Speaking about this particular report we have conducted primary surveys (interviews) with the key level executives (VP, CEO’s, Marketing Director, Business Development Manager and many more) of the major players active in the market.
Secondary Research
Secondary research was mainly used to collect and identify information useful for the extensive, technical, market-oriented, and Friend’s study of the Global Extra Neutral Alcohol. It was also used to obtain key information about major players, market classification and segmentation according to the industry trends, geographical markets, and developments related to the market and technology perspectives. For this study, analysts have gathered information from various credible sources, such as annual reports, sec filings, journals, white papers, SOFT presentations, and company web sites.
Market Size Estimation
Both, top-down and bottom-up approaches were used to estimate and validate the size of the Global market and to estimate the size of various other dependent submarkets in the overall Extra Neutral Alcohol. The key players in the market were identified through secondary research and their market contributions in the respective geographies were determined through primary and secondary research.
Forecast Model
![research-methodology2]()