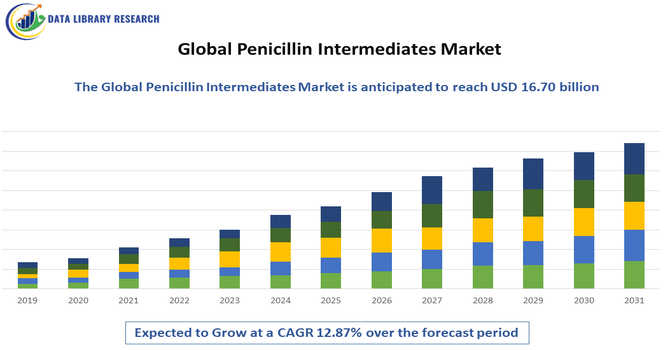
The global market for Penicillin Intermediates was valued at USD 12.43 billion in the year 2026 and is projected to reach a revised size of USD 16.70 billion in 2033, growing with a CAGR of 12.87% from 2026-2033.
Get Complete Analysis Of The Report - Download Updated Free Sample PDF
The Global Penicillin Intermediates Market refers to the worldwide trade and production of chemical compounds used as precursors in the manufacture of penicillin antibiotics. These intermediates, such as 6 aminopenicillanic acid (6 APA) and its derivatives, are essential in synthesizing various penicillin family drugs. Demand is driven by the pharmaceutical industry’s ongoing need for effective antibiotics to treat bacterial infections. Market growth is supported by rising global healthcare expenditure, increasing prevalence of infectious diseases, and expansion of generic drug manufacturing. However, regulatory challenges, environmental concerns, and fluctuating raw material prices influence market dynamics.
The global penicillin intermediates market is witnessing steady growth driven by increasing demand for antibiotics and rising prevalence of bacterial infections. Manufacturers are focusing on 6 aminopenicillanic acid (6 APA) and related intermediates to produce semi-synthetic penicillin derivatives. Technological advancements in fermentation and chemical synthesis are improving yield and reducing production costs. There is also a shift toward sustainable and environmentally friendly processes due to stringent regulations on chemical waste.
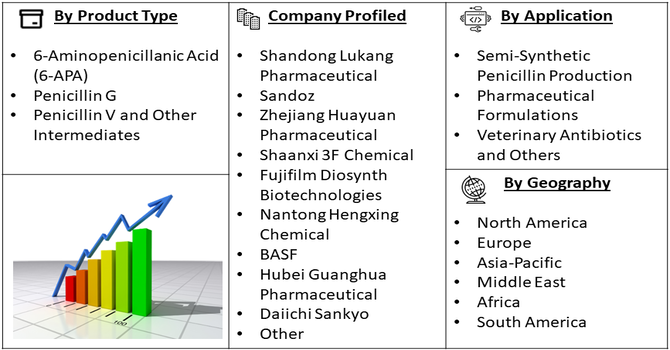
Segmentation: The Global Penicillin Intermediates Market is segmented by Product Type (6-Aminopenicillanic Acid (6-APA), Penicillin G, Penicillin V and Other Intermediates), Form (Dry Form and Liquid Form), Application (Semi-Synthetic Penicillin Production, Pharmaceutical Formulations, Veterinary Antibiotics and Others), and Geography (North America, Europe, Asia-Pacific, Middle East and Africa, and South America). The report provides the value (in USD million) for the above segments.
For Detailed Market Segmentation - Get a Free Sample PDF
Market Drivers:
The growing prevalence of bacterial infections worldwide has significantly increased demand for penicillin and its derivatives, driving the penicillin intermediates market. Hospitals, clinics, and pharmaceutical companies require a consistent supply of 6-APA and other intermediates to produce semi-synthetic penicillins. Additionally, the rise in infectious diseases, particularly in emerging economies, has prompted governments and healthcare organizations to invest in antibiotic availability. Generic drug manufacturers are expanding production to meet cost-effective treatment needs, further boosting intermediate requirements. This rising global demand for antibiotics ensures sustained growth for penicillin intermediate producers, especially in markets with high disease burden and healthcare expansion.
The global expansion of generic pharmaceutical manufacturing has become a key driver for the penicillin intermediates market. As patents for many antibiotics expire, generic producers are increasing production of semi-synthetic penicillins, requiring large volumes of 6-APA and related intermediates. Cost-conscious healthcare systems, particularly in developing regions, rely on generics to improve accessibility and affordability of essential antibiotics. Additionally, strategic partnerships between intermediate suppliers and generic drug manufacturers have streamlined supply chains, ensuring consistent availability. The growing prevalence of chronic and infectious diseases globally further supports this trend, making generic production a major contributor to intermediate demand and market growth.
Market Restraints:
The penicillin intermediates market faces significant regulatory and environmental challenges that can hinder growth. Production involves complex chemical and fermentation processes, which generate hazardous waste and require strict compliance with environmental regulations. Governments in key markets enforce stringent quality standards, documentation, and safety protocols for intermediates, increasing operational costs for manufacturers. Small and medium-sized producers may struggle to meet these requirements, limiting market entry. Additionally, any disruptions in regulatory approvals or compliance failures can lead to production delays, penalties, or recalls. These challenges collectively act as a restraint, affecting cost efficiency, supply reliability, and overall market expansion.
The penicillin intermediates market significantly influences global healthcare and socioeconomic outcomes. By enabling cost-effective production of essential antibiotics, it helps combat infectious diseases, particularly in low- and middle-income countries. This supports public health, reduces mortality rates, and improves productivity by enabling faster recovery from infections. The industry also generates employment across manufacturing, research, logistics, and quality control sectors. Expansion of production facilities stimulates local economies, while innovations in production methods contribute to environmental sustainability. Overall, access to affordable penicillin derivatives strengthens healthcare systems, mitigates public health crises, and ensures broader socioeconomic benefits worldwide.
Segmental Analysis:
The 6-Aminopenicillanic Acid (6-APA) segment is expected to witness the highest growth over the forecast period due to its critical role as the key precursor for manufacturing semi-synthetic penicillins. Its versatility allows pharmaceutical manufacturers to produce a wide range of penicillin derivatives, including amoxicillin and ampicillin, driving strong demand. Growing prevalence of bacterial infections, coupled with the expansion of generic antibiotic production, has increased the reliance on 6-APA. Technological advancements in fermentation and synthesis processes have improved yields and lowered production costs, further boosting adoption. This segment’s strategic importance in antibiotic synthesis positions it as a primary growth driver globally.
The dry form segment is expected to witness the highest growth over the forecast period, as it offers superior stability, longer shelf life, and ease of transportation compared to liquid intermediates. Pharmaceutical manufacturers prefer dry penicillin intermediates for large-scale production and storage, reducing risks of degradation and contamination. Additionally, dry intermediates simplify dosing accuracy and handling during formulation processes. The global expansion of generic drug manufacturing, especially in emerging markets, has increased demand for dry 6-APA and penicillin intermediates. Cost-effectiveness, reduced storage requirements, and enhanced operational efficiency make the dry form segment highly attractive, supporting its rapid market growth.
The semi-synthetic penicillin production segment is expected to witness the highest growth over the forecast period due to rising demand for broad-spectrum and cost-effective antibiotics. Semi-synthetic penicillins, derived from intermediates such as 6-APA, are widely used to treat bacterial infections and are preferred over natural penicillins for their enhanced stability and efficacy. Expansion of generic pharmaceutical manufacturing, especially in Asia-Pacific and Latin America, has further fueled the need for penicillin intermediates. Increased focus on affordable healthcare and growing prevalence of infectious diseases globally has driven large-scale production. This segment remains a critical driver for intermediate manufacturers and overall market growth.
The Asia-Pacific region is expected to witness the highest growth over the forecast period, driven by rising healthcare expenditure, growing infectious disease prevalence, and the expansion of generic drug manufacturing. Countries such as China and India are major producers of 6-APA and other penicillin intermediates, supported by favorable government policies, low-cost manufacturing, and skilled workforce. Increasing domestic demand for antibiotics and expanding export opportunities to Europe and North America further bolster growth. Additionally, investments in research, technological advancements in fermentation, and strategic partnerships between local and multinational companies have strengthened the region’s position as a dominant hub for penicillin intermediates, ensuring sustained market expansion.
| Report Matrics | Details |
| Market Size Value | USD 16.70 billion |
| Growth Rate | CAGR of 12.87 % |
| Forecast | 2026-2033 |
| Historical data | 2021-2024 |
| Base Year | 2025 |
| Report Coverage | Forecasted revenue, company rating, competitive environment, growth drivers, and trends |
| Segment Coverage | Type, Application, End-User, Geography |
| Regional Scope | North America, Europe, Asia Pacific, Middle East |
| Customized scope | Free customization of reports (With 3 months Analysis Support ) |
| To Learn More About This Report | Request a Free Sample Copy |
The global penicillin intermediates market is highly competitive, dominated by established pharmaceutical and chemical manufacturers across Asia, Europe, and North America. Key players focus on innovation, capacity expansion, and strategic partnerships to maintain supply reliability and meet rising demand. Companies differentiate through high-quality 6 APA production, cost-efficiency, and regulatory compliance. Mergers and acquisitions are common strategies to consolidate market share, while smaller regional players compete by offering flexible supply and localized services. Market entry barriers, including stringent quality standards and environmental regulations, create challenges for new entrants. Thus, competition drives technological advancement, production efficiency, and global supply chain optimization in the market.
The major players for above market are:
Recent Development
Q1. What are the main growth-driving factors for this market?
The market is primarily driven by the rising global prevalence of bacterial infections and the subsequent demand for affordable antibiotics. Increased investments in pharmaceutical R&D and the expansion of healthcare infrastructure in emerging economies further propel growth. Additionally, the growing demand for animal health products significantly boosts intermediate production requirements.
Q2. What are the main restraining factors for this market?
Environmental regulations regarding waste disposal from chemical synthesis act as a major restraint. High production costs and the complexity of maintaining sterile manufacturing environments also challenge market growth. Furthermore, the global rise of antibiotic resistance has led to stricter prescription controls, potentially slowing the long-term consumption of traditional penicillin-based drugs.
Q3. Which segment is expected to witness high growth?
The 6-Aminopenicillanic Acid (6-APA) segment is expected to witness the highest growth. As a core building block for semi-synthetic penicillins like amoxicillin and ampicillin, 6-APA is vital for modern medicine. The shift toward more effective, broad-spectrum derivatives ensures a constant and expanding demand for this specific intermediate across global manufacturers.
Q4. Who are the top major players for this market?
Key players dominating this market include Sinopharm Group, North China Pharmaceutical Group (NCPC), and CSPC Pharmaceutical Group. Other significant contributors are DSM Sinochem Pharmaceuticals and Sandoz (a Novartis division). These companies maintain market leadership through massive production capacities, integrated supply chains, and advanced fermentation technologies essential for high-yield intermediate synthesis.
Q5. Which country is the largest player?
China is the largest player in the global penicillin intermediates market. The country benefits from massive industrial scale, lower labor costs, and a robust chemical manufacturing ecosystem. China produces the majority of the world’s 6-APA and Penicillin G, making it the primary supplier for global pharmaceutical companies and domestic producers.
Data Library Research are conducted by industry experts who offer insight on industry structure, market segmentations technology assessment and competitive landscape (CL), and penetration, as well as on emerging trends. Their analysis is based on primary interviews (~ 80%) and secondary research (~ 20%) as well as years of professional expertise in their respective industries. Adding to this, by analysing historical trends and current market positions, our analysts predict where the market will be headed for the next five years. Furthermore, the varying trends of segment & categories geographically presented are also studied and the estimated based on the primary & secondary research.
In this particular report from the supply side Data Library Research has conducted primary surveys (interviews) with the key level executives (VP, CEO’s, Marketing Director, Business Development Manager and SOFT) of the companies that active & prominent as well as the midsized organization
FIGURE 1: DLR RESEARH PROCESS
Extensive primary research was conducted to gain a deeper insight of the market and industry performance. The analysis is based on both primary and secondary research as well as years of professional expertise in the respective industries.
In addition to analysing current and historical trends, our analysts predict where the market is headed over the next five years.
It varies by segment for these categories geographically presented in the list of market tables. Speaking about this particular report we have conducted primary surveys (interviews) with the key level executives (VP, CEO’s, Marketing Director, Business Development Manager and many more) of the major players active in the market.
Secondary ResearchSecondary research was mainly used to collect and identify information useful for the extensive, technical, market-oriented, and Friend’s study of the Global Extra Neutral Alcohol. It was also used to obtain key information about major players, market classification and segmentation according to the industry trends, geographical markets, and developments related to the market and technology perspectives. For this study, analysts have gathered information from various credible sources, such as annual reports, sec filings, journals, white papers, SOFT presentations, and company web sites.
Market Size EstimationBoth, top-down and bottom-up approaches were used to estimate and validate the size of the Global market and to estimate the size of various other dependent submarkets in the overall Extra Neutral Alcohol. The key players in the market were identified through secondary research and their market contributions in the respective geographies were determined through primary and secondary research.
Forecast Model