Pharma E-Detailing Software Market Overview and Analysis
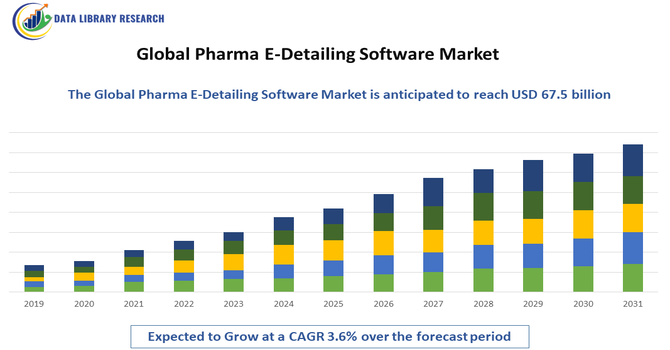
- The Global Pharma E Detailing Software Market is projected to grow from USD 47.4 billion in 2025 to USD 67.5 billion by 2032, growing with a CAGR of 3.6% from 2025-2032.
Get Complete Analysis Of The Report - Download Updated Free Sample PDF
The Global Pharma E Detailing Software Market refers to the worldwide industry that provides digital solutions for pharmaceutical sales and marketing teams. These platforms enable interactive, multimedia presentations of drug information to healthcare professionals, replacing traditional paper-based detailing. The market serves pharmaceutical companies of all sizes, driven by digital transformation, demand for efficient marketing, regulatory requirements, and the need for cost-effective, scalable, and data-driven strategies in promoting medicines globally.
Pharma E-Detailing Software Market Latest Trends
The Global Pharma E Detailing Software Market is experiencing rapid evolution driven by digital transformation within the pharmaceutical industry. Key trends include the adoption of interactive, multimedia rich detailing tools that replace traditional paper based methods, enhancing engagement with healthcare professionals. Integration of AI and analytics enables personalized content delivery and deeper insights into user behavior. Mobile and cloud based solutions are becoming standard, providing flexibility and real time updates for sales teams.
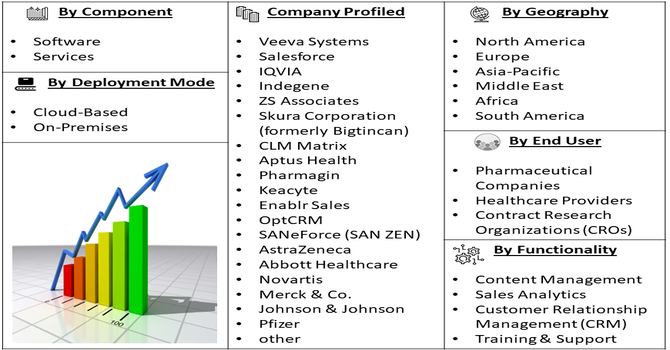
Segmentation: The Global Pharma E Detailing Software Market is segmented by Component (Software and Services), Deployment Mode (Cloud-Based and On-Premises), End User (Pharmaceutical Companies, Healthcare Providers and Contract Research Organizations (CROs)), Functionality (Content Management, Sales Analytics, Customer Relationship Management (CRM) and Training & Support), and Geography (North America, Europe, Asia-Pacific, Middle East and Africa, and South America). The report provides the value (in USD million) for the above segments.
For Detailed Market Segmentation - Get a Free Sample PDF
Market Drivers:
- Digital Transformation in Pharmaceutical Sales
The digital transformation of pharmaceutical marketing has been a key driver for the e detailing software market. Pharmaceutical companies increasingly replaced traditional paper-based detailing with interactive, multimedia-rich digital platforms, improving engagement with healthcare professionals. Integration of AI and real-time analytics allows personalized content delivery and data-driven decision-making, enhancing sales efficiency and targeting. Mobile and cloud-based solutions provide sales teams with on-the-go access to materials and updates, optimizing outreach. This shift towards digital channels has accelerated adoption globally, enabling pharma firms to reduce operational costs, improve compliance, and strengthen relationships with healthcare providers.
- Increasing Demand for Efficient, Scalable Marketing
The growing need for cost-effective and scalable marketing solutions has propelled e detailing software adoption. Traditional sales methods, such as in-person visits and printed materials, are resource-intensive and time-consuming. E detailing platforms streamline content delivery, track interactions, and provide actionable insights, allowing pharma companies to reach more healthcare professionals efficiently. Automation, analytics, and integrated CRM systems improve targeting and performance measurement, increasing return on investment. Additionally, regulatory compliance can be managed more effectively with digital records. As pharmaceutical firms aim to enhance productivity and reach larger markets, demand for robust, scalable e detailing solutions continues to rise.
Market Restraints:
- High Implementation Costs and Integration Challenges
Despite its benefits, the adoption of e detailing software faces restraints due to high initial investment and integration complexity. Implementing comprehensive platforms often requires significant spending on software licensing, hardware, training, and ongoing support. Integration with existing CRM and sales systems, ensuring data security, and meeting regulatory compliance can be challenging for smaller pharmaceutical firms with limited IT infrastructure. These factors may slow adoption, particularly in emerging markets or among mid-sized companies. High costs and technical barriers create hesitation, limiting the speed of market penetration despite the clear advantages of digital detailing for engagement and efficiency.
Socioeconomic Impact on Pharma E-Detailing Software Market
The market’s growth has meaningful socioeconomic effects, improving access to up-to-date medical information and enhancing healthcare communication. E detailing software enables pharmaceutical companies to efficiently educate healthcare providers, potentially leading to better clinical decisions and patient outcomes. The shift to digital reduces operational costs and travel, decreasing carbon footprints and enabling more equitable knowledge sharing across regions. It also creates jobs in tech development, data analytics, and digital training within the healthcare ecosystem. However, disparities in digital infrastructure and training may limit adoption in under-resourced areas, highlighting the need for broader investment in digital literacy and connectivity to realize its full benefits.
Segmental Analysis:
- Software segment is expected to witness highest growth over the forecast period
The Software segment is projected to witness the highest growth as pharmaceutical companies increasingly adopt digital tools to replace traditional paper-based detailing. Software solutions provide interactive content delivery, CRM integration, real-time analytics, and compliance management, improving sales team efficiency and healthcare professional engagement. The growing preference for AI-driven personalization and mobile access further drives adoption. Additionally, advancements in user-friendly interfaces, automation, and performance tracking make software solutions more appealing than standalone services. This shift toward comprehensive digital platforms positions the software segment as the fastest-growing component in the global pharma e detailing market.
- Cloud-Based segment is expected to witness highest growth over the forecast period
The Cloud-Based deployment mode is expected to grow rapidly due to its flexibility, scalability, and cost-effectiveness. Cloud solutions allow pharma sales teams to access e detailing platforms from anywhere, ensuring real-time updates and seamless collaboration. They reduce the need for extensive IT infrastructure, minimize maintenance costs, and simplify integration with CRM and analytics tools. Cloud platforms also support secure storage, data backup, and regulatory compliance, making them suitable for global operations. The increasing adoption of mobile devices and remote work trends further accelerates cloud-based solution uptake, establishing this segment as a key driver of market expansion.
- Pharmaceutical Companies segment is expected to witness highest growth over the forecast period
The Pharmaceutical Companies segment is anticipated to experience the highest growth as firms seek efficient, scalable, and compliant methods for engaging healthcare professionals. Companies are leveraging e detailing software to deliver interactive content, track performance, and gain actionable insights into physician interactions. Large, mid-size, and specialty pharma firms increasingly invest in digital platforms to reduce operational costs, improve targeting, and optimize return on marketing spend. The rising focus on patient-centric approaches, regulatory compliance, and data-driven decision-making further boosts adoption, making pharmaceutical companies the primary end-users driving the expansion of the global e detailing software market.
- Sales Analytics segment is expected to witness highest growth over the forecast period
The Sales Analytics functionality segment is projected to grow the fastest as pharmaceutical companies focus on data-driven decision-making. E detailing platforms collect real-time interaction data, enabling sales teams to assess engagement, monitor performance, and optimize strategies. Analytics tools allow personalized targeting of healthcare professionals, identification of high-potential leads, and measurement of marketing ROI. Insights from predictive modeling and AI-driven recommendations help companies refine messaging and improve efficiency. The increasing emphasis on evidence-based marketing and accountability in pharma sales accelerates demand for advanced analytics capabilities, making this segment a key driver in the global e detailing software market.
- North America Region is expected to witness highest growth over the forecast period
The North America region is expected to dominate the global e detailing software market due to high digital adoption, advanced healthcare infrastructure, and widespread use of cloud and mobile technologies. Pharmaceutical companies in the U.S. and Canada increasingly deploy e detailing platforms to enhance physician engagement, comply with regulatory requirements, and improve marketing efficiency. The presence of major software providers and early adopters of AI and analytics further fuels growth. Additionally, the demand for personalized, data-driven sales strategies and omnichannel engagement solutions supports rapid expansion, positioning North America as the leading regional market in the global pharma e-detailing software industry.
| Report Matrics |
Details |
| Market Size Value |
USD 67.5 billion |
| Growth Rate |
CAGR of 3.6 % |
| Forecast |
2026-2033 |
| Historical data |
2021-2024 |
| Base Year |
2025 |
| Report Coverage |
Forecasted revenue, company rating, competitive environment, growth drivers, and trends |
| Segment Coverage |
Type, Application, End-User, Geography |
| Regional Scope |
North America, Europe, Asia Pacific, Middle East |
| Customized scope |
Free customization of reports (With 3 months Analysis Support ) |
| To Learn More About This Report |
Request a Free Sample Copy |
Pharma E-Detailing Software Market Competitive Landscape
The competitive landscape of the Global Pharma E Detailing Software Market is marked by dynamic innovation and diverse players ranging from established enterprise solution providers to specialized digital health startups. Companies compete based on software capabilities, ease of integration with existing CRM and sales systems, analytics depth, and user experience. Leaders differentiate by offering advanced features like AI driven personalization, real time performance tracking, and mobile compatibility. Strategic partnerships with pharmaceutical firms and customization for regulatory compliance strengthen market positions. Ongoing competition stimulates continuous product enhancements, driving improved functionalities that support efficient, data informed engagement between pharmaceutical sales teams and healthcare professionals worldwide.
The major players for above market are:
- Veeva Systems
- Salesforce
- IQVIA
- Indegene
- ZS Associates
- Skura Corporation (formerly Bigtincan)
- CLM Matrix
- Aptus Health
- Pharmagin
- Keacyte
- Enablr Sales
- OptCRM
- SANeForce (SAN ZEN)
- AstraZeneca
- Abbott Healthcare
- Novartis
- Merck & Co.
- Johnson & Johnson
- Pfizer
- GlaxoSmithKline (GSK)
Recent Development
- In April 2025, an article pub;ished in the journal, Hospital Pharmacy, reported that implementation of a self-service data exploration tool at MUSC Health influenced the Global Pharma E Detailing Software Market by demonstrating the value of integrated, data-driven platforms. By enabling frontline staff to access real-time insights for operational, clinical, and research decisions, the tool improved efficiency, cost management, and decision-making. Its success highlighted the importance of analytics-enabled solutions, encouraging pharmaceutical companies to adopt advanced e detailing software that integrates data exploration, reporting, and performance optimization.
- In November 2023, an article published in International Journal of Production Research, reported that atient Information Leaflets (PILs) to electronic PILs (ePILs) influenced the Global Pharma E Detailing Software Market by accelerating digital adoption in pharmaceutical communications. By addressing regulatory, update, and distribution challenges, ePILs enhanced efficiency, compliance, and patient engagement. Multinational companies leveraged digital platforms to integrate ePILs with sales and marketing workflows, improving information delivery to healthcare professionals and patients, thereby driving demand for advanced, technology-enabled e detailing software solutions worldwide.
Frequently Asked Questions (FAQ) :
Q1. What are the main growth-driving factors for this market?
The market is growing because pharmaceutical companies need more efficient, cost-effective ways to reach busy doctors. Digital presentations allow sales reps to share complex drug data remotely, saving time and travel costs. Additionally, the shift toward "physician-centric" marketing and the need for data-driven insights into doctor engagement are fueling adoption.
Q2. What are the main restraining factors for this market?
Growth is limited by the strict data privacy laws (like GDPR) that govern how medical information is shared online. Some older healthcare professionals still prefer traditional, in-person meetings over digital interactions. Furthermore, the high cost of developing high-quality, interactive content and the risk of technical glitches during live presentations can hinder progress.
Q3. Which segment is expected to witness high growth?
The Cloud-Based Software segment is expected to see the highest growth. These platforms allow sales teams to access and update marketing materials in real-time from any device. Cloud solutions are highly scalable and offer better integration with CRM systems, making them the preferred choice for global pharmaceutical firms managing large teams.
Q4. Who are the top major players for this market?
The market is led by specialized software providers that understand both tech and healthcare regulations. Key players include Veeva Systems, IQVIA, Indegene, Aktana, and Platforce. These companies dominate by offering "all-in-one" platforms that combine video conferencing, interactive content, and advanced analytics to track the effectiveness of every sales pitch.
Q5. Which country is the largest player?
The United States is the largest player in the pharma e-detailing market. This is due to its massive pharmaceutical industry and the high cost of traditional sales forces, which makes digital alternatives very attractive. The U.S. also leads in software innovation and has a high rate of digital adoption among healthcare providers.
List of Figures
Figure 1: Global Pharma E-Detailing Software Market Revenue Breakdown (USD Billion, %) by Region, 2022 & 2029
Figure 2: Global Pharma E-Detailing Software Market Value Share (%), By Segment 1, 2022 & 2029
Figure 3: Global Pharma E-Detailing Software Market Forecast (USD Billion), by Sub-Segment 1, 2018-2029
Figure 4: Global Pharma E-Detailing Software Market Forecast (USD Billion), by Sub-Segment 2, 2018-2029
Figure 5: Global Pharma E-Detailing Software Market Value Share (%), By Segment 2, 2022 & 2029
Figure 6: Global Pharma E-Detailing Software Market Forecast (USD Billion), by Sub-Segment 1, 2018-2029
Figure 7: Global Pharma E-Detailing Software Market Forecast (USD Billion), by Sub-Segment 2, 2018-2029
Figure 8: Global Pharma E-Detailing Software Market Forecast (USD Billion), by Sub-Segment 3, 2018-2029
Figure 9: Global Pharma E-Detailing Software Market Forecast (USD Billion), by Others, 2018-2029
Figure 10: Global Pharma E-Detailing Software Market Value Share (%), By Segment 3, 2022 & 2029
Figure 11: Global Pharma E-Detailing Software Market Forecast (USD Billion), by Sub-Segment 1, 2018-2029
Figure 12: Global Pharma E-Detailing Software Market Forecast (USD Billion), by Sub-Segment 2, 2018-2029
Figure 13: Global Pharma E-Detailing Software Market Forecast (USD Billion), by Sub-Segment 3, 2018-2029
Figure 14: Global Pharma E-Detailing Software Market Forecast (USD Billion), by Others, 2018-2029
Figure 15: Global Pharma E-Detailing Software Market Value (USD Billion), by Region, 2022 & 2029
Figure 16: North America Pharma E-Detailing Software Market Value Share (%), By Segment 1, 2022 & 2029
Figure 17: North America Pharma E-Detailing Software Market Forecast (USD Billion), by Sub-Segment 1, 2018-2029
Figure 18: North America Pharma E-Detailing Software Market Forecast (USD Billion), by Sub-Segment 2, 2018-2029
Figure 19: North America Pharma E-Detailing Software Market Value Share (%), By Segment 2, 2022 & 2029
Figure 20: North America Pharma E-Detailing Software Market Forecast (USD Billion), by Sub-Segment 1, 2018-2029
Figure 21: North America Pharma E-Detailing Software Market Forecast (USD Billion), by Sub-Segment 2, 2018-2029
Figure 22: North America Pharma E-Detailing Software Market Forecast (USD Billion), by Sub-Segment 3, 2018-2029
Figure 23: North America Pharma E-Detailing Software Market Forecast (USD Billion), by Others, 2018-2029
Figure 24: North America Pharma E-Detailing Software Market Value Share (%), By Segment 3, 2022 & 2029
Figure 25: North America Pharma E-Detailing Software Market Forecast (USD Billion), by Sub-Segment 1, 2018-2029
Figure 26: North America Pharma E-Detailing Software Market Forecast (USD Billion), by Sub-Segment 2, 2018-2029
Figure 27: North America Pharma E-Detailing Software Market Forecast (USD Billion), by Sub-Segment 3, 2018-2029
Figure 28: North America Pharma E-Detailing Software Market Forecast (USD Billion), by Others, 2018-2029
Figure 29: North America Pharma E-Detailing Software Market Forecast (USD Billion), by U.S., 2018-2029
Figure 30: North America Pharma E-Detailing Software Market Forecast (USD Billion), by Canada, 2018-2029
Figure 31: Latin America Pharma E-Detailing Software Market Value Share (%), By Segment 1, 2022 & 2029
Figure 32: Latin America Pharma E-Detailing Software Market Forecast (USD Billion), by Sub-Segment 1, 2018-2029
Figure 33: Latin America Pharma E-Detailing Software Market Forecast (USD Billion), by Sub-Segment 2, 2018-2029
Figure 34: Latin America Pharma E-Detailing Software Market Value Share (%), By Segment 2, 2022 & 2029
Figure 35: Latin America Pharma E-Detailing Software Market Forecast (USD Billion), by Sub-Segment 1, 2018-2029
Figure 36: Latin America Pharma E-Detailing Software Market Forecast (USD Billion), by Sub-Segment 2, 2018-2029
Figure 37: Latin America Pharma E-Detailing Software Market Forecast (USD Billion), by Sub-Segment 3, 2018-2029
Figure 38: Latin America Pharma E-Detailing Software Market Forecast (USD Billion), by Others, 2018-2029
Figure 39: Latin America Pharma E-Detailing Software Market Value Share (%), By Segment 3, 2022 & 2029
Figure 40: Latin America Pharma E-Detailing Software Market Forecast (USD Billion), by Sub-Segment 1, 2018-2029
Figure 41: Latin America Pharma E-Detailing Software Market Forecast (USD Billion), by Sub-Segment 2, 2018-2029
Figure 42: Latin America Pharma E-Detailing Software Market Forecast (USD Billion), by Sub-Segment 3, 2018-2029
Figure 43: Latin America Pharma E-Detailing Software Market Forecast (USD Billion), by Others, 2018-2029
Figure 44: Latin America Pharma E-Detailing Software Market Forecast (USD Billion), by Brazil, 2018-2029
Figure 45: Latin America Pharma E-Detailing Software Market Forecast (USD Billion), by Mexico, 2018-2029
Figure 46: Latin America Pharma E-Detailing Software Market Forecast (USD Billion), by Rest of Latin America, 2018-2029
Figure 47: Europe Pharma E-Detailing Software Market Value Share (%), By Segment 1, 2022 & 2029
Figure 48: Europe Pharma E-Detailing Software Market Forecast (USD Billion), by Sub-Segment 1, 2018-2029
Figure 49: Europe Pharma E-Detailing Software Market Forecast (USD Billion), by Sub-Segment 2, 2018-2029
Figure 50: Europe Pharma E-Detailing Software Market Value Share (%), By Segment 2, 2022 & 2029
Figure 51: Europe Pharma E-Detailing Software Market Forecast (USD Billion), by Sub-Segment 1, 2018-2029
Figure 52: Europe Pharma E-Detailing Software Market Forecast (USD Billion), by Sub-Segment 2, 2018-2029
Figure 53: Europe Pharma E-Detailing Software Market Forecast (USD Billion), by Sub-Segment 3, 2018-2029
Figure 54: Europe Pharma E-Detailing Software Market Forecast (USD Billion), by Others, 2018-2029
Figure 55: Europe Pharma E-Detailing Software Market Value Share (%), By Segment 3, 2022 & 2029
Figure 56: Europe Pharma E-Detailing Software Market Forecast (USD Billion), by Sub-Segment 1, 2018-2029
Figure 57: Europe Pharma E-Detailing Software Market Forecast (USD Billion), by Sub-Segment 2, 2018-2029
Figure 58: Europe Pharma E-Detailing Software Market Forecast (USD Billion), by Sub-Segment 3, 2018-2029
Figure 59: Europe Pharma E-Detailing Software Market Forecast (USD Billion), by Others, 2018-2029
Figure 60: Europe Pharma E-Detailing Software Market Forecast (USD Billion), by U.K., 2018-2029
Figure 61: Europe Pharma E-Detailing Software Market Forecast (USD Billion), by Germany, 2018-2029
Figure 62: Europe Pharma E-Detailing Software Market Forecast (USD Billion), by France, 2018-2029
Figure 63: Europe Pharma E-Detailing Software Market Forecast (USD Billion), by Italy, 2018-2029
Figure 64: Europe Pharma E-Detailing Software Market Forecast (USD Billion), by Spain, 2018-2029
Figure 65: Europe Pharma E-Detailing Software Market Forecast (USD Billion), by Russia, 2018-2029
Figure 66: Europe Pharma E-Detailing Software Market Forecast (USD Billion), by Rest of Europe, 2018-2029
Figure 67: Asia Pacific Pharma E-Detailing Software Market Value Share (%), By Segment 1, 2022 & 2029
Figure 68: Asia Pacific Pharma E-Detailing Software Market Forecast (USD Billion), by Sub-Segment 1, 2018-2029
Figure 69: Asia Pacific Pharma E-Detailing Software Market Forecast (USD Billion), by Sub-Segment 2, 2018-2029
Figure 70: Asia Pacific Pharma E-Detailing Software Market Value Share (%), By Segment 2, 2022 & 2029
Figure 71: Asia Pacific Pharma E-Detailing Software Market Forecast (USD Billion), by Sub-Segment 1, 2018-2029
Figure 72: Asia Pacific Pharma E-Detailing Software Market Forecast (USD Billion), by Sub-Segment 2, 2018-2029
Figure 73: Asia Pacific Pharma E-Detailing Software Market Forecast (USD Billion), by Sub-Segment 3, 2018-2029
Figure 74: Asia Pacific Pharma E-Detailing Software Market Forecast (USD Billion), by Others, 2018-2029
Figure 75: Asia Pacific Pharma E-Detailing Software Market Value Share (%), By Segment 3, 2022 & 2029
Figure 76: Asia Pacific Pharma E-Detailing Software Market Forecast (USD Billion), by Sub-Segment 1, 2018-2029
Figure 77: Asia Pacific Pharma E-Detailing Software Market Forecast (USD Billion), by Sub-Segment 2, 2018-2029
Figure 78: Asia Pacific Pharma E-Detailing Software Market Forecast (USD Billion), by Sub-Segment 3, 2018-2029
Figure 79: Asia Pacific Pharma E-Detailing Software Market Forecast (USD Billion), by Others, 2018-2029
Figure 80: Asia Pacific Pharma E-Detailing Software Market Forecast (USD Billion), by China, 2018-2029
Figure 81: Asia Pacific Pharma E-Detailing Software Market Forecast (USD Billion), by India, 2018-2029
Figure 82: Asia Pacific Pharma E-Detailing Software Market Forecast (USD Billion), by Japan, 2018-2029
Figure 83: Asia Pacific Pharma E-Detailing Software Market Forecast (USD Billion), by Australia, 2018-2029
Figure 84: Asia Pacific Pharma E-Detailing Software Market Forecast (USD Billion), by Southeast Asia, 2018-2029
Figure 85: Asia Pacific Pharma E-Detailing Software Market Forecast (USD Billion), by Rest of Asia Pacific, 2018-2029
Figure 86: Middle East & Africa Pharma E-Detailing Software Market Value Share (%), By Segment 1, 2022 & 2029
Figure 87: Middle East & Africa Pharma E-Detailing Software Market Forecast (USD Billion), by Sub-Segment 1, 2018-2029
Figure 88: Middle East & Africa Pharma E-Detailing Software Market Forecast (USD Billion), by Sub-Segment 2, 2018-2029
Figure 89: Middle East & Africa Pharma E-Detailing Software Market Value Share (%), By Segment 2, 2022 & 2029
Figure 90: Middle East & Africa Pharma E-Detailing Software Market Forecast (USD Billion), by Sub-Segment 1, 2018-2029
Figure 91: Middle East & Africa Pharma E-Detailing Software Market Forecast (USD Billion), by Sub-Segment 2, 2018-2029
Figure 92: Middle East & Africa Pharma E-Detailing Software Market Forecast (USD Billion), by Sub-Segment 3, 2018-2029
Figure 93: Middle East & Africa Pharma E-Detailing Software Market Forecast (USD Billion), by Others, 2018-2029
Figure 94: Middle East & Africa Pharma E-Detailing Software Market Value Share (%), By Segment 3, 2022 & 2029
Figure 95: Middle East & Africa Pharma E-Detailing Software Market Forecast (USD Billion), by Sub-Segment 1, 2018-2029
Figure 96: Middle East & Africa Pharma E-Detailing Software Market Forecast (USD Billion), by Sub-Segment 2, 2018-2029
Figure 97: Middle East & Africa Pharma E-Detailing Software Market Forecast (USD Billion), by Sub-Segment 3, 2018-2029
Figure 98: Middle East & Africa Pharma E-Detailing Software Market Forecast (USD Billion), by Others, 2018-2029
Figure 99: Middle East & Africa Pharma E-Detailing Software Market Forecast (USD Billion), by GCC, 2018-2029
Figure 100: Middle East & Africa Pharma E-Detailing Software Market Forecast (USD Billion), by South Africa, 2018-2029
Figure 101: Middle East & Africa Pharma E-Detailing Software Market Forecast (USD Billion), by Rest of Middle East & Africa, 2018-2029
List of Tables
Table 1: Global Pharma E-Detailing Software Market Revenue (USD Billion) Forecast, by Segment 1, 2018-2029
Table 2: Global Pharma E-Detailing Software Market Revenue (USD Billion) Forecast, by Segment 2, 2018-2029
Table 3: Global Pharma E-Detailing Software Market Revenue (USD Billion) Forecast, by Segment 3, 2018-2029
Table 4: Global Pharma E-Detailing Software Market Revenue (USD Billion) Forecast, by Region, 2018-2029
Table 5: North America Pharma E-Detailing Software Market Revenue (USD Billion) Forecast, by Segment 1, 2018-2029
Table 6: North America Pharma E-Detailing Software Market Revenue (USD Billion) Forecast, by Segment 2, 2018-2029
Table 7: North America Pharma E-Detailing Software Market Revenue (USD Billion) Forecast, by Segment 3, 2018-2029
Table 8: North America Pharma E-Detailing Software Market Revenue (USD Billion) Forecast, by Country, 2018-2029
Table 9: Europe Pharma E-Detailing Software Market Revenue (USD Billion) Forecast, by Segment 1, 2018-2029
Table 10: Europe Pharma E-Detailing Software Market Revenue (USD Billion) Forecast, by Segment 2, 2018-2029
Table 11: Europe Pharma E-Detailing Software Market Revenue (USD Billion) Forecast, by Segment 3, 2018-2029
Table 12: Europe Pharma E-Detailing Software Market Revenue (USD Billion) Forecast, by Country, 2018-2029
Table 13: Latin America Pharma E-Detailing Software Market Revenue (USD Billion) Forecast, by Segment 1, 2018-2029
Table 14: Latin America Pharma E-Detailing Software Market Revenue (USD Billion) Forecast, by Segment 2, 2018-2029
Table 15: Latin America Pharma E-Detailing Software Market Revenue (USD Billion) Forecast, by Segment 3, 2018-2029
Table 16: Latin America Pharma E-Detailing Software Market Revenue (USD Billion) Forecast, by Country, 2018-2029
Table 17: Asia Pacific Pharma E-Detailing Software Market Revenue (USD Billion) Forecast, by Segment 1, 2018-2029
Table 18: Asia Pacific Pharma E-Detailing Software Market Revenue (USD Billion) Forecast, by Segment 2, 2018-2029
Table 19: Asia Pacific Pharma E-Detailing Software Market Revenue (USD Billion) Forecast, by Segment 3, 2018-2029
Table 20: Asia Pacific Pharma E-Detailing Software Market Revenue (USD Billion) Forecast, by Country, 2018-2029
Table 21: Middle East & Africa Pharma E-Detailing Software Market Revenue (USD Billion) Forecast, by Segment 1, 2018-2029
Table 22: Middle East & Africa Pharma E-Detailing Software Market Revenue (USD Billion) Forecast, by Segment 2, 2018-2029
Table 23: Middle East & Africa Pharma E-Detailing Software Market Revenue (USD Billion) Forecast, by Segment 3, 2018-2029
Table 24: Middle East & Africa Pharma E-Detailing Software Market Revenue (USD Billion) Forecast, by Country, 2018-2029
Research Process
Data Library Research are conducted by industry experts who offer insight on
industry structure, market segmentations technology assessment and competitive landscape (CL), and penetration, as well as on emerging trends. Their analysis is based on primary interviews (~ 80%) and secondary research (~ 20%) as well as years of professional expertise in their respective industries. Adding to this, by analysing historical trends and current market positions, our analysts predict where the market will be headed for the next five years. Furthermore, the varying trends of segment & categories geographically presented are also studied and the estimated based on the primary & secondary research.
In this particular report from the supply side Data Library Research has conducted primary surveys (interviews) with the key level executives (VP, CEO’s, Marketing Director, Business Development Manager
and SOFT) of the companies that active & prominent as well as the midsized organization
FIGURE 1: DLR RESEARH PROCESS
![research-methodology1]()
Primary Research
Extensive primary research was conducted to gain a deeper insight of the market and industry performance. The analysis is based on both primary and secondary research as well as years of professional expertise in the respective industries.
In addition to analysing current and historical trends, our analysts predict where the market is headed over the next five years.
It varies by segment for these categories geographically presented in the list of market tables. Speaking about this particular report we have conducted primary surveys (interviews) with the key level executives (VP, CEO’s, Marketing Director, Business Development Manager and many more) of the major players active in the market.
Secondary Research
Secondary research was mainly used to collect and identify information useful for the extensive, technical, market-oriented, and Friend’s study of the Global Extra Neutral Alcohol. It was also used to obtain key information about major players, market classification and segmentation according to the industry trends, geographical markets, and developments related to the market and technology perspectives. For this study, analysts have gathered information from various credible sources, such as annual reports, sec filings, journals, white papers, SOFT presentations, and company web sites.
Market Size Estimation
Both, top-down and bottom-up approaches were used to estimate and validate the size of the Global market and to estimate the size of various other dependent submarkets in the overall Extra Neutral Alcohol. The key players in the market were identified through secondary research and their market contributions in the respective geographies were determined through primary and secondary research.
Forecast Model
![research-methodology2]()