Global Photonic AI Chip Market Overview and Analysis

The Global Photonic AI Chip market is projected to grow from USD 18.36 billion in 2025 to USD 67.69 billion by 2032, exhibiting a CAGR of 21.02% from 2025-2032.

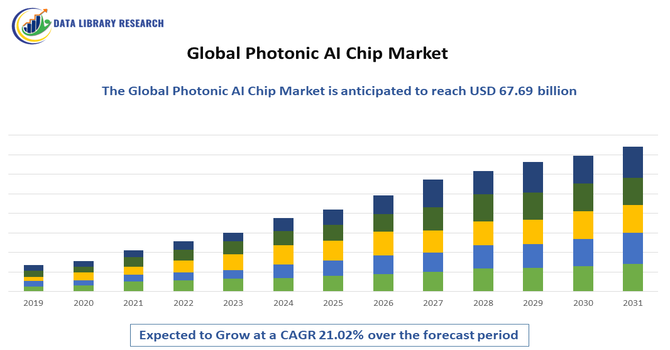
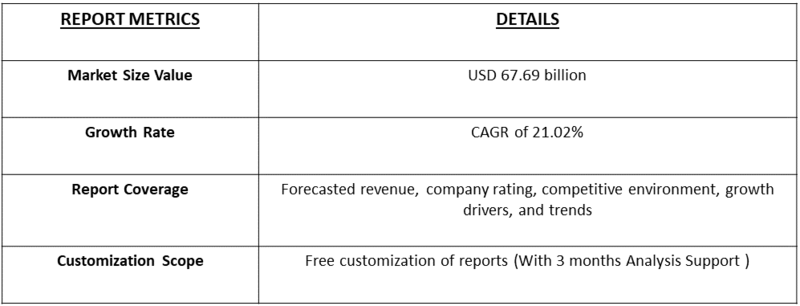
The Global Photonic AI Chip market was described as an industry focused on developing light-based processors that accelerated artificial intelligence tasks. It featured rising demand for faster computing, reduced energy use, and advanced data processing, driven by innovations in telecommunications, data centers, and emerging AI applications across multiple sectors.

The growth in the global photonic AI chip market was driven by escalating demand for high-speed data processing, rising adoption of AI-enabled technologies, and increasing limitations of traditional electronic chips. It was further supported by expanding data-center workloads, advancements in optical interconnects, and growing needs for energy-efficient computing across telecommunications, autonomous systems, and cloud-based AI applications.

Global Photonic AI Chip Market Latest Trends

The Global Photonic AI Chip market has exhibited accelerating innovation as industries sought faster, more efficient computing solutions beyond traditional silicon-based architectures. Trends highlighted growing integration of photonic processors in data centers to manage soaring AI workloads, alongside increasing adoption in edge computing for real-time, low-latency applications. Hybrid electronic-photonic systems gained traction as companies balanced performance with manufacturing feasibility.

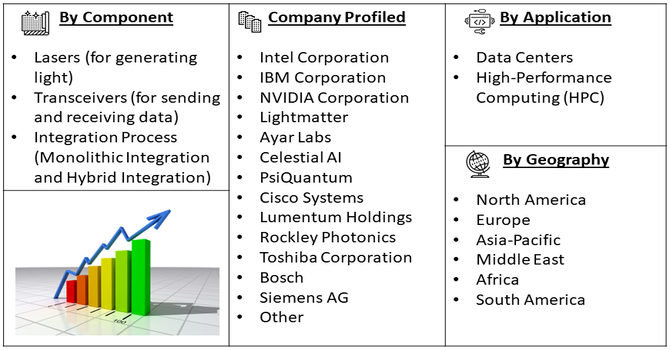
Segmentation: The Global Photonic AI Chip market is segmented by Application (Data Centers and High-Performance Computing (HPC)), Component (Lasers (for generating light) and Transceivers (for sending and receiving data)), Integration Process (Monolithic Integration and Hybrid Integration) and Geography (North America, Europe, Asia-Pacific, Middle East and Africa, and South America). The report provides the value (in USD million) for the above segments.

Market Drivers:

  • Rising Need for High-Speed, Energy-Efficient Computing

The global photonic AI chip market has been driven strongly by the rising need for ultra-fast, energy-efficient computing across AI-intensive industries. As conventional electronic chips struggled with heat generation, latency, and power limitations, photonic processors offered transformative capabilities by transmitting data through light instead of electricity. For instance, in March 2025, Photonic chips, which used light for data processing and transmission, delivered exceptional speed, bandwidth, and energy efficiency. Their low heat generation and resistance to interference made them ideal for AI, 6G, quantum computing, and data centers. These advantages intensified the need for high-speed, efficient computing and significantly boosted the global photonic AI chip market.

This enabled significantly higher bandwidth, reduced energy consumption, and faster processing of complex AI workloads. Expanding adoption of AI in cloud computing, autonomous systems, advanced analytics, and scientific research further amplified demand for photonic architectures.

  • Growing Integration of Photonics in Data Centers and Edge AI

A major driver for the photonic AI chip market has been the increasing integration of photonic technologies into modern data centers and edge-AI systems. With exploding AI workloads, data centers required performance leaps that electronic processors could no longer provide efficiently. For instance, in November 2025, Vantage Data Centers completed a USD 1.6 billion investment in its Asia-Pacific platform, acquiring Yondr Group’s 300MW+ hyperscale campus in Malaysia. This expansion supported high-speed, energy-efficient computing infrastructure, driving demand for advanced AI and photonic chips, and significantly bolstering growth and adoption within the global photonic AI chip market.

Photonic chips met these demands by enabling high-throughput optical interconnects, reduced latency, and improved scalability across massive GPU clusters. Simultaneously, the shift toward intelligent edge devices in telecommunications, robotics, and autonomous mobility created demand for compact, low-power photonic solutions capable of real-time inference.

Market Restraints:

  • Manufacturing Complexity and High Production Costs

Despite strong market momentum, the global photonic AI chip sector has faced significant challenges due to the complexity and high cost of manufacturing photonic components at scale. Photonic chips require advanced materials, precision alignment, and specialized fabrication processes that differ from mainstream semiconductor manufacturing. Limited production capacity, smaller foundry ecosystems, and the need for hybrid electronic-photonic integration increased costs and slowed commercialization. Furthermore, achieving consistency, reliability, and compatibility with existing hardware demanded extensive R&D investment.

Socio Economic Impact on Global Photonic AI Chip Market

The socioeconomic impact of the photonic AI chip market has been substantial, influencing productivity, energy consumption, and global technology competitiveness. By enabling faster and more efficient AI processing, photonic chips supported innovation in healthcare, transportation, cybersecurity, and scientific research. Their energy-efficient design contributed to reduced operational costs and lower environmental footprints for data centers, benefiting both economies and sustainability goals. Emerging markets gained opportunities through investments in photonic manufacturing and research infrastructure, fostering skilled job creation. However, disparities in access to advanced technologies also highlighted concerns about digital inequality. Thus, the market strengthened economic resilience by accelerating AI-driven transformation across industries.

Segmental Analysis:

  • Data Centers segment is expected to witness highest growth over the forecast period

The data centers segment was expected to witness the highest growth due to surging global AI workloads, cloud expansion, and increasing demand for low-latency, high-bandwidth processing. Traditional electronic architectures struggled with escalating energy consumption and thermal constraints, prompting hyperscalers to adopt photonic AI chips for faster interconnects and improved efficiency. Photonics enabled scalable optical links across massive GPU clusters, supporting training of large AI models and advanced analytics. As enterprises modernized infrastructure for generative AI, edge-to-cloud workflows, and HPC applications, investment in photonic-enhanced data centers accelerated.

  • Transceivers segment is expected to witness highest growth over the forecast period

The transceivers segment was projected to achieve the fastest growth as optical transceivers became essential for high-speed data transmission in AI-driven networks. Growing deployment of photonic interconnects in data centers, telecommunications, and AI clusters created strong demand for low-power, high-capacity optical transceivers. Photonic AI chips enhanced signal integrity, reduced latency, and increased bandwidth, enabling seamless connectivity across GPUs, switches, and servers. Accelerating rollout of 800G and 1.6T optical modules further boosted adoption. The rise of distributed AI architectures, remote computing, and cloud-native applications placed additional emphasis on optical communication efficiency, driving rapid expansion of the photonic transceiver market.

  • Monolithic Integration segment is expected to witness highest growth over the forecast period

The monolithic integration segment was expected to grow the fastest due to its ability to combine photonic and electronic components on a single chip, delivering superior performance, lower manufacturing costs, and improved scalability. Monolithic photonic integration minimized losses, enhanced signal stability, and simplified system architecture, making it ideal for AI acceleration, optical interconnects, and HPC systems. As companies sought compact, energy-efficient solutions capable of supporting massive parallel computations, monolithic platforms gained preference over hybrid designs. Advances in silicon photonics, CMOS compatibility, and 3D packaging technologies further accelerated adoption. Increased investment by semiconductor manufacturers and startups strengthened growth prospects for this segment.

  • North America region is expected to witness highest growth over the forecast period

North America was expected to witness the highest growth owing to its strong ecosystem of AI innovation, leading semiconductor companies, and major cloud service providers driving adoption of photonic AI chips. The region’s robust R&D infrastructure, extensive funding for photonics, and early deployment of advanced AI and HPC systems supported rapid market expansion.

Hyperscalers such as Google, Microsoft, Amazon, and Meta invested heavily in high-performance optical interconnects for next-generation data centers. For instance, in Novemner 2025, Amazon announced a USD 50 billion investment to expand AI and supercomputing capacity for U.S. government customers, adding 1.3 gigawatts of advanced data-center infrastructure. This accelerated demand for high-speed, energy-efficient computing and reinforced North America’s leadership, driving adoption and growth in the region’s photonic AI chip market.

Government initiatives promoting chip manufacturing and photonic research further accelerated development. Collaboration among universities, national labs, and photonics startups strengthened technological advancements, positioning North America as the dominant growth hub. For instance, in April 2025, Sandia National Laboratories partnered with Maxwell Labs and the University of New Mexico to demonstrate laser-based photonic cooling for chips. This collaboration advanced energy-efficient cooling technologies, strengthened partnerships between academia, national labs, and startups, and accelerated innovation and adoption in North America’s photonic AI chip market.

Global Photonic AI Chip Market Competitive Landscape

The competitive landscape of the photonic AI chip market has been defined by a mix of established semiconductor companies, specialized photonics startups, and major cloud service providers investing in in-house chip development. Leading players differentiated themselves through proprietary architectures, fabrication techniques, and integration with AI frameworks. Startups focused on disruptive designs such as silicon photonics and optical neural networks, while large corporations leveraged scale, capital, and partnerships to accelerate deployment.

The major players for above market are:

  • Intel Corporation
  • IBM Corporation
  • NVIDIA Corporation
  • Lightmatter
  • Ayar Labs
  • Celestial AI
  • PsiQuantum
  • Cisco Systems
  • Lumentum Holdings
  • Rockley Photonics
  • Toshiba Corporation
  • Bosch
  • Infineon Technologies 
  • Xerox Corporation
  • Siemens AG
  • NEC Corporation
  • Broadcom Inc.
  • SMART Photonics
  • Tower Semiconductor
  • Global Foundries

Recent Development

  • In November 2025, Q.ANT unveiled its second-generation photonic processor, the NPU 2, which performed nonlinear operations directly in light to deliver faster, energy-efficient AI and HPC workloads. Its server-ready design and planned 2026 shipments strengthened market confidence, accelerated photonic adoption, and intensified competition within the global photonic AI chip market.


  • In May 2025, Lightmatter, introduced the Passage M1000, a 3D photonic superchip delivering 114 Tbps optical bandwidth for advanced AI systems. The massive multi-reticle photonic interposer supported thousands of GPUs, enhancing scalability and performance, which significantly boosted innovation, investment, and competition across the global photonic AI chip market.


Frequently Asked Questions (FAQ) :

Q1. What are the main growth-driving factors for this market?

The biggest driver is the critical need for faster, more energy-efficient computing in massive data centers and high-performance AI training. Photonic chips use light (photons) instead of electricity (electrons) for data transfer, overcoming the speed and thermal limits of traditional silicon chips (Moore's Law). The huge growth in cloud computing and generative AI workloads directly fuels the demand for this specialized, high-bandwidth technology.

Q2. What are the main restraining factors for this market?

The primary constraint is the high complexity and manufacturing difficulty of integrating light sources (lasers) onto silicon wafers. Silicon itself is not naturally light-emitting, requiring complex hybrid techniques that increase fabrication costs and reduce yields. This technical hurdle, combined with the need for specialized packaging and the general immaturity of the ecosystem, slows down widespread commercial adoption.

Q3. Which segment is expected to witness high growth?

The Data Centers and High-Performance Computing (HPC) segment is expected to see the fastest growth. Hyperscale cloud providers are seeking new ways to handle massive data traffic volumes created by AI and 5G/6G networks. Photonic AI chips are essential for co-packaged optics (CPO) and ultra-high-speed interconnects that significantly boost the performance and power efficiency within these modern, demanding computing environments.

Q4. Who are the top major players for this market?

The market is led by major technology and semiconductor giants who are investing heavily in this space. Key players include Intel Corporation, Cisco Systems Inc., NVIDIA Corporation, and Lumentum Operations LLC. These firms leverage their expertise in both chip design and high-speed networking components to develop integrated photonic solutions for AI acceleration and data center connectivity.

Q5. Which country is the largest player?

The United States holds the largest market share, mainly due to the presence of the world's leading technology corporations and significant investments in semiconductor innovation. The U.S. houses the majority of the world's largest hyperscale data centers, creating an immediate and massive domestic market for high-performance photonic chips and optical interconnect solutions driven by companies like Intel and Nvidia.

Photonic AI Chip MARKET STUDY GLOBAL MARKET ANALYSIS, INSIGHTS AND FORECAST, 2022-2029

    1. Introduction

    • 1.1. Research Scope
    • 1.2. Market Segmentation
    • 1.3. Research Methodology
    • 1.4. Definitions and Assumptions

    2. Executive Summary

      3. Market Dynamics

      • 3.1. Market Drivers
      • 3.2. Market Restraints
      • 3.3. Market Opportunities

      4. Key Insights

      • 4.1. Key Emerging Trends – For Major Countries
      • 4.2. Latest Technological Advancement
      • 4.3. Regulatory Landscape
      • 4.4. Industry SWOT Analysis
      • 4.5. Porters Five Forces Analysis

      5. Global Photonic AI Chip Market Analysis (USD Billion), Insights and Forecast, 2018-2029

      • 5.1. Key Findings / Summary
      • 5.2. Market Analysis, Insights and Forecast – By Segment 1
        • 5.2.1. Sub-Segment 1
        • 5.2.2. Sub-Segment 2
      • 5.3. Market Analysis, Insights and Forecast – By Segment 2
        • 5.3.1. Sub-Segment 1
        • 5.3.2. Sub-Segment 2
        • 5.3.3. Sub-Segment 3
        • 5.3.4. Others
      • 5.4. Market Analysis, Insights and Forecast – By Segment 3
        • 5.4.1. Sub-Segment 1
        • 5.4.2. Sub-Segment 2
        • 5.4.3. Sub-Segment 3
        • 5.4.4. Others
      • 5.5. Market Analysis, Insights and Forecast – By Region
        • 5.5.1. North America
        • 5.5.2. Latin America
        • 5.5.3. Europe
        • 5.5.4. Asia Pacific
        • 5.5.5. Middle East and Africa

      6. North America Photonic AI Chip Market Analysis (USD Billion), Insights and Forecast, 2018-2029

      • 6.1. Key Findings / Summary
      • 6.2. Market Analysis, Insights and Forecast – By Segment 1
        • 6.2.1. Sub-Segment 1
        • 6.2.2. Sub-Segment 2
      • 6.3. Market Analysis, Insights and Forecast – By Segment 2
        • 6.3.1. Sub-Segment 1
        • 6.3.2. Sub-Segment 2
        • 6.3.3. Sub-Segment 3
        • 6.3.4. Others
      • 6.4. Market Analysis, Insights and Forecast – By Segment 3
        • 6.4.1. Sub-Segment 1
        • 6.4.2. Sub-Segment 2
        • 6.4.3. Sub-Segment 3
        • 6.4.4. Others
      • 6.5. Market Analysis, Insights and Forecast – By Country
        • 6.5.1. U.S.
        • 6.5.2. Canada

      7. Latin America Photonic AI Chip Market Analysis (USD Billion), Insights and Forecast, 2018-2029

      • 7.1. Key Findings / Summary
      • 7.2. Market Analysis, Insights and Forecast – By Segment 1
        • 7.2.1. Sub-Segment 1
        • 7.2.2. Sub-Segment 2
      • 7.3. Market Analysis, Insights and Forecast – By Segment 2
        • 7.3.1. Sub-Segment 1
        • 7.3.2. Sub-Segment 2
        • 7.3.3. Sub-Segment 3
        • 7.3.4. Others
      • 7.4. Market Analysis, Insights and Forecast – By Segment 3
        • 7.4.1. Sub-Segment 1
        • 7.4.2. Sub-Segment 2
        • 7.4.3. Sub-Segment 3
        • 7.4.4. Others
      • 7.5. Insights and Forecast – By Country
        • 7.5.1. Brazil
        • 7.5.2. Mexico
        • 7.5.3. Rest of Latin America

      8. Europe Photonic AI Chip Market Analysis (USD Billion), Insights and Forecast, 2018-2029

      • 8.1. Key Findings / Summary
      • 8.2. Market Analysis, Insights and Forecast – By Segment 1
        • 8.2.1. Sub-Segment 1
        • 8.2.2. Sub-Segment 2
      • 8.3. Market Analysis, Insights and Forecast – By Segment 2
        • 8.3.1. Sub-Segment 1
        • 8.3.2. Sub-Segment 2
        • 8.3.3. Sub-Segment 3
        • 8.3.4. Others
      • 8.4. Market Analysis, Insights and Forecast – By Segment 3
        • 8.4.1. Sub-Segment 1
        • 8.4.2. Sub-Segment 2
        • 8.4.3. Sub-Segment 3
        • 8.4.4. Others
      • 8.5. Market Analysis, Insights and Forecast – By Country
        • 8.5.1. UK
        • 8.5.2. Germany
        • 8.5.3. France
        • 8.5.4. Italy
        • 8.5.5. Spain
        • 8.5.6. Russia
        • 8.5.7. Rest of Europe

      9. Asia Pacific Photonic AI Chip Market Analysis (USD Billion), Insights and Forecast, 2018-2029

      • 9.1. Key Findings / Summary
      • 9.2. Market Analysis, Insights and Forecast – By Segment 1
        • 9.2.1. Sub-Segment 1
        • 9.2.2. Sub-Segment 2
      • 9.3. Market Analysis, Insights and Forecast – By Segment 2
        • 9.3.1. Sub-Segment 1
        • 9.3.2. Sub-Segment 2
        • 9.3.3. Sub-Segment 3
        • 9.3.4. Others
      • 9.4. Market Analysis, Insights and Forecast – By Segment 3
        • 9.4.1. Sub-Segment 1
        • 9.4.2. Sub-Segment 2
        • 9.4.3. Sub-Segment 3
        • 9.4.4. Others
      • 9.5. Market Analysis, Insights and Forecast – By Country
        • 9.5.1. China
        • 9.5.2. India
        • 9.5.3. Japan
        • 9.5.4. Australia
        • 9.5.5. South East Asia
        • 9.5.6. Rest of Asia Pacific

      10. Middle East & Africa Photonic AI Chip Market Analysis (USD Billion), Insights and Forecast, 2018-2029

      • 10.1. Key Findings / Summary
      • 10.2. Market Analysis, Insights and Forecast – By Segment 1
        • 10.2.1. Sub-Segment 1
        • 10.2.2. Sub-Segment 2
      • 10.3. Market Analysis, Insights and Forecast – By Segment 2
        • 10.3.1. Sub-Segment 1
        • 10.3.2. Sub-Segment 2
        • 10.3.3. Sub-Segment 3
        • 10.3.4. Others
      • 10.4. Market Analysis, Insights and Forecast – By Segment 3
        • 10.4.1. Sub-Segment 1
        • 10.4.2. Sub-Segment 2
        • 10.4.3. Sub-Segment 3
        • 10.4.4. Others
      • 10.5. Market Analysis, Insights and Forecast – By Country
        • 10.5.1. GCC
        • 10.5.2. South Africa
        • 10.5.3. Rest of Middle East & Africa

      11. Competitive Analysis

      • 11.1. Company Market Share Analysis, 2018
      • 11.2. Key Industry Developments
      • 11.3. Company Profile
        • 11.3.1. Company 1
          • 11.3.1.1. Business Overview
          • 11.3.1.2. Segment 1 & Service Offering
          • 11.3.1.3. Overall Revenue
          • 11.3.1.4. Geographic Presence
          • 11.3.1.5. Recent Development
        *Similar details will be provided for the following companies
        • 11.3.2. Company 2
        • 11.3.3. Company 3
        • 11.3.4. Company 4
        • 11.3.5. Company 5
        • 11.3.6. Company 6
        • 11.3.7. Company 7
        • 11.3.8. Company 8
        • 11.3.9. Company 9
        • 11.3.10. Company 10
        • 11.3.11. Company 11
        • 11.3.12. Company 12
      List of Figures

      Figure 1: Global Photonic AI Chip Market Revenue Breakdown (USD Billion, %) by Region, 2022 & 2029
      Figure 2: Global Photonic AI Chip Market Value Share (%), By Segment 1, 2022 & 2029
      Figure 3: Global Photonic AI Chip Market Forecast (USD Billion), by Sub-Segment 1, 2018-2029
      Figure 4: Global Photonic AI Chip Market Forecast (USD Billion), by Sub-Segment 2, 2018-2029
      Figure 5: Global Photonic AI Chip Market Value Share (%), By Segment 2, 2022 & 2029
      Figure 6: Global Photonic AI Chip Market Forecast (USD Billion), by Sub-Segment 1, 2018-2029
      Figure 7: Global Photonic AI Chip Market Forecast (USD Billion), by Sub-Segment 2, 2018-2029
      Figure 8: Global Photonic AI Chip Market Forecast (USD Billion), by Sub-Segment 3, 2018-2029
      Figure 9: Global Photonic AI Chip Market Forecast (USD Billion), by Others, 2018-2029
      Figure 10: Global Photonic AI Chip Market Value Share (%), By Segment 3, 2022 & 2029
      Figure 11: Global Photonic AI Chip Market Forecast (USD Billion), by Sub-Segment 1, 2018-2029
      Figure 12: Global Photonic AI Chip Market Forecast (USD Billion), by Sub-Segment 2, 2018-2029
      Figure 13: Global Photonic AI Chip Market Forecast (USD Billion), by Sub-Segment 3, 2018-2029
      Figure 14: Global Photonic AI Chip Market Forecast (USD Billion), by Others, 2018-2029
      Figure 15: Global Photonic AI Chip Market Value (USD Billion), by Region, 2022 & 2029
      Figure 16: North America Photonic AI Chip Market Value Share (%), By Segment 1, 2022 & 2029
      Figure 17: North America Photonic AI Chip Market Forecast (USD Billion), by Sub-Segment 1, 2018-2029
      Figure 18: North America Photonic AI Chip Market Forecast (USD Billion), by Sub-Segment 2, 2018-2029
      Figure 19: North America Photonic AI Chip Market Value Share (%), By Segment 2, 2022 & 2029
      Figure 20: North America Photonic AI Chip Market Forecast (USD Billion), by Sub-Segment 1, 2018-2029
      Figure 21: North America Photonic AI Chip Market Forecast (USD Billion), by Sub-Segment 2, 2018-2029
      Figure 22: North America Photonic AI Chip Market Forecast (USD Billion), by Sub-Segment 3, 2018-2029
      Figure 23: North America Photonic AI Chip Market Forecast (USD Billion), by Others, 2018-2029
      Figure 24: North America Photonic AI Chip Market Value Share (%), By Segment 3, 2022 & 2029
      Figure 25: North America Photonic AI Chip Market Forecast (USD Billion), by Sub-Segment 1, 2018-2029
      Figure 26: North America Photonic AI Chip Market Forecast (USD Billion), by Sub-Segment 2, 2018-2029
      Figure 27: North America Photonic AI Chip Market Forecast (USD Billion), by Sub-Segment 3, 2018-2029
      Figure 28: North America Photonic AI Chip Market Forecast (USD Billion), by Others, 2018-2029
      Figure 29: North America Photonic AI Chip Market Forecast (USD Billion), by U.S., 2018-2029
      Figure 30: North America Photonic AI Chip Market Forecast (USD Billion), by Canada, 2018-2029
      Figure 31: Latin America Photonic AI Chip Market Value Share (%), By Segment 1, 2022 & 2029
      Figure 32: Latin America Photonic AI Chip Market Forecast (USD Billion), by Sub-Segment 1, 2018-2029
      Figure 33: Latin America Photonic AI Chip Market Forecast (USD Billion), by Sub-Segment 2, 2018-2029
      Figure 34: Latin America Photonic AI Chip Market Value Share (%), By Segment 2, 2022 & 2029
      Figure 35: Latin America Photonic AI Chip Market Forecast (USD Billion), by Sub-Segment 1, 2018-2029
      Figure 36: Latin America Photonic AI Chip Market Forecast (USD Billion), by Sub-Segment 2, 2018-2029
      Figure 37: Latin America Photonic AI Chip Market Forecast (USD Billion), by Sub-Segment 3, 2018-2029
      Figure 38: Latin America Photonic AI Chip Market Forecast (USD Billion), by Others, 2018-2029
      Figure 39: Latin America Photonic AI Chip Market Value Share (%), By Segment 3, 2022 & 2029
      Figure 40: Latin America Photonic AI Chip Market Forecast (USD Billion), by Sub-Segment 1, 2018-2029
      Figure 41: Latin America Photonic AI Chip Market Forecast (USD Billion), by Sub-Segment 2, 2018-2029
      Figure 42: Latin America Photonic AI Chip Market Forecast (USD Billion), by Sub-Segment 3, 2018-2029
      Figure 43: Latin America Photonic AI Chip Market Forecast (USD Billion), by Others, 2018-2029
      Figure 44: Latin America Photonic AI Chip Market Forecast (USD Billion), by Brazil, 2018-2029
      Figure 45: Latin America Photonic AI Chip Market Forecast (USD Billion), by Mexico, 2018-2029
      Figure 46: Latin America Photonic AI Chip Market Forecast (USD Billion), by Rest of Latin America, 2018-2029
      Figure 47: Europe Photonic AI Chip Market Value Share (%), By Segment 1, 2022 & 2029
      Figure 48: Europe Photonic AI Chip Market Forecast (USD Billion), by Sub-Segment 1, 2018-2029
      Figure 49: Europe Photonic AI Chip Market Forecast (USD Billion), by Sub-Segment 2, 2018-2029
      Figure 50: Europe Photonic AI Chip Market Value Share (%), By Segment 2, 2022 & 2029
      Figure 51: Europe Photonic AI Chip Market Forecast (USD Billion), by Sub-Segment 1, 2018-2029
      Figure 52: Europe Photonic AI Chip Market Forecast (USD Billion), by Sub-Segment 2, 2018-2029
      Figure 53: Europe Photonic AI Chip Market Forecast (USD Billion), by Sub-Segment 3, 2018-2029
      Figure 54: Europe Photonic AI Chip Market Forecast (USD Billion), by Others, 2018-2029
      Figure 55: Europe Photonic AI Chip Market Value Share (%), By Segment 3, 2022 & 2029
      Figure 56: Europe Photonic AI Chip Market Forecast (USD Billion), by Sub-Segment 1, 2018-2029
      Figure 57: Europe Photonic AI Chip Market Forecast (USD Billion), by Sub-Segment 2, 2018-2029
      Figure 58: Europe Photonic AI Chip Market Forecast (USD Billion), by Sub-Segment 3, 2018-2029
      Figure 59: Europe Photonic AI Chip Market Forecast (USD Billion), by Others, 2018-2029
      Figure 60: Europe Photonic AI Chip Market Forecast (USD Billion), by U.K., 2018-2029
      Figure 61: Europe Photonic AI Chip Market Forecast (USD Billion), by Germany, 2018-2029
      Figure 62: Europe Photonic AI Chip Market Forecast (USD Billion), by France, 2018-2029
      Figure 63: Europe Photonic AI Chip Market Forecast (USD Billion), by Italy, 2018-2029
      Figure 64: Europe Photonic AI Chip Market Forecast (USD Billion), by Spain, 2018-2029
      Figure 65: Europe Photonic AI Chip Market Forecast (USD Billion), by Russia, 2018-2029
      Figure 66: Europe Photonic AI Chip Market Forecast (USD Billion), by Rest of Europe, 2018-2029
      Figure 67: Asia Pacific Photonic AI Chip Market Value Share (%), By Segment 1, 2022 & 2029
      Figure 68: Asia Pacific Photonic AI Chip Market Forecast (USD Billion), by Sub-Segment 1, 2018-2029
      Figure 69: Asia Pacific Photonic AI Chip Market Forecast (USD Billion), by Sub-Segment 2, 2018-2029
      Figure 70: Asia Pacific Photonic AI Chip Market Value Share (%), By Segment 2, 2022 & 2029
      Figure 71: Asia Pacific Photonic AI Chip Market Forecast (USD Billion), by Sub-Segment 1, 2018-2029
      Figure 72: Asia Pacific Photonic AI Chip Market Forecast (USD Billion), by Sub-Segment 2, 2018-2029
      Figure 73: Asia Pacific Photonic AI Chip Market Forecast (USD Billion), by Sub-Segment 3, 2018-2029
      Figure 74: Asia Pacific Photonic AI Chip Market Forecast (USD Billion), by Others, 2018-2029
      Figure 75: Asia Pacific Photonic AI Chip Market Value Share (%), By Segment 3, 2022 & 2029
      Figure 76: Asia Pacific Photonic AI Chip Market Forecast (USD Billion), by Sub-Segment 1, 2018-2029
      Figure 77: Asia Pacific Photonic AI Chip Market Forecast (USD Billion), by Sub-Segment 2, 2018-2029
      Figure 78: Asia Pacific Photonic AI Chip Market Forecast (USD Billion), by Sub-Segment 3, 2018-2029
      Figure 79: Asia Pacific Photonic AI Chip Market Forecast (USD Billion), by Others, 2018-2029
      Figure 80: Asia Pacific Photonic AI Chip Market Forecast (USD Billion), by China, 2018-2029
      Figure 81: Asia Pacific Photonic AI Chip Market Forecast (USD Billion), by India, 2018-2029
      Figure 82: Asia Pacific Photonic AI Chip Market Forecast (USD Billion), by Japan, 2018-2029
      Figure 83: Asia Pacific Photonic AI Chip Market Forecast (USD Billion), by Australia, 2018-2029
      Figure 84: Asia Pacific Photonic AI Chip Market Forecast (USD Billion), by Southeast Asia, 2018-2029
      Figure 85: Asia Pacific Photonic AI Chip Market Forecast (USD Billion), by Rest of Asia Pacific, 2018-2029
      Figure 86: Middle East & Africa Photonic AI Chip Market Value Share (%), By Segment 1, 2022 & 2029
      Figure 87: Middle East & Africa Photonic AI Chip Market Forecast (USD Billion), by Sub-Segment 1, 2018-2029
      Figure 88: Middle East & Africa Photonic AI Chip Market Forecast (USD Billion), by Sub-Segment 2, 2018-2029
      Figure 89: Middle East & Africa Photonic AI Chip Market Value Share (%), By Segment 2, 2022 & 2029
      Figure 90: Middle East & Africa Photonic AI Chip Market Forecast (USD Billion), by Sub-Segment 1, 2018-2029
      Figure 91: Middle East & Africa Photonic AI Chip Market Forecast (USD Billion), by Sub-Segment 2, 2018-2029
      Figure 92: Middle East & Africa Photonic AI Chip Market Forecast (USD Billion), by Sub-Segment 3, 2018-2029
      Figure 93: Middle East & Africa Photonic AI Chip Market Forecast (USD Billion), by Others, 2018-2029
      Figure 94: Middle East & Africa Photonic AI Chip Market Value Share (%), By Segment 3, 2022 & 2029
      Figure 95: Middle East & Africa Photonic AI Chip Market Forecast (USD Billion), by Sub-Segment 1, 2018-2029
      Figure 96: Middle East & Africa Photonic AI Chip Market Forecast (USD Billion), by Sub-Segment 2, 2018-2029
      Figure 97: Middle East & Africa Photonic AI Chip Market Forecast (USD Billion), by Sub-Segment 3, 2018-2029
      Figure 98: Middle East & Africa Photonic AI Chip Market Forecast (USD Billion), by Others, 2018-2029
      Figure 99: Middle East & Africa Photonic AI Chip Market Forecast (USD Billion), by GCC, 2018-2029
      Figure 100: Middle East & Africa Photonic AI Chip Market Forecast (USD Billion), by South Africa, 2018-2029
      Figure 101: Middle East & Africa Photonic AI Chip Market Forecast (USD Billion), by Rest of Middle East & Africa, 2018-2029 
      List of Tables
      Table 1: Global Photonic AI Chip Market Revenue (USD Billion) Forecast, by Segment 1, 2018-2029
      Table 2: Global Photonic AI Chip Market Revenue (USD Billion) Forecast, by Segment 2, 2018-2029
      Table 3: Global Photonic AI Chip Market Revenue (USD Billion) Forecast, by Segment 3, 2018-2029
      Table 4: Global Photonic AI Chip Market Revenue (USD Billion) Forecast, by Region, 2018-2029
      Table 5: North America Photonic AI Chip Market Revenue (USD Billion) Forecast, by Segment 1, 2018-2029
      Table 6: North America Photonic AI Chip Market Revenue (USD Billion) Forecast, by Segment 2, 2018-2029
      Table 7: North America Photonic AI Chip Market Revenue (USD Billion) Forecast, by Segment 3, 2018-2029
      Table 8: North America Photonic AI Chip Market Revenue (USD Billion) Forecast, by Country, 2018-2029
      Table 9: Europe Photonic AI Chip Market Revenue (USD Billion) Forecast, by Segment 1, 2018-2029
      Table 10: Europe Photonic AI Chip Market Revenue (USD Billion) Forecast, by Segment 2, 2018-2029
      Table 11: Europe Photonic AI Chip Market Revenue (USD Billion) Forecast, by Segment 3, 2018-2029
      Table 12: Europe Photonic AI Chip Market Revenue (USD Billion) Forecast, by Country, 2018-2029
      Table 13: Latin America Photonic AI Chip Market Revenue (USD Billion) Forecast, by Segment 1, 2018-2029
      Table 14: Latin America Photonic AI Chip Market Revenue (USD Billion) Forecast, by Segment 2, 2018-2029
      Table 15: Latin America Photonic AI Chip Market Revenue (USD Billion) Forecast, by Segment 3, 2018-2029
      Table 16: Latin America Photonic AI Chip Market Revenue (USD Billion) Forecast, by Country, 2018-2029
      Table 17: Asia Pacific Photonic AI Chip Market Revenue (USD Billion) Forecast, by Segment 1, 2018-2029
      Table 18: Asia Pacific Photonic AI Chip Market Revenue (USD Billion) Forecast, by Segment 2, 2018-2029
      Table 19: Asia Pacific Photonic AI Chip Market Revenue (USD Billion) Forecast, by Segment 3, 2018-2029
      Table 20: Asia Pacific Photonic AI Chip Market Revenue (USD Billion) Forecast, by Country, 2018-2029
      Table 21: Middle East & Africa Photonic AI Chip Market Revenue (USD Billion) Forecast, by Segment 1, 2018-2029
      Table 22: Middle East & Africa Photonic AI Chip Market Revenue (USD Billion) Forecast, by Segment 2, 2018-2029
      Table 23: Middle East & Africa Photonic AI Chip Market Revenue (USD Billion) Forecast, by Segment 3, 2018-2029
      Table 24: Middle East & Africa Photonic AI Chip Market Revenue (USD Billion) Forecast, by Country, 2018-2029
      Research Process

      Data Library Research are conducted by industry experts who offer insight on industry structure, market segmentations technology assessment and competitive landscape (CL), and penetration, as well as on emerging trends. Their analysis is based on primary interviews (~ 80%) and secondary research (~ 20%) as well as years of professional expertise in their respective industries. Adding to this, by analysing historical trends and current market positions, our analysts predict where the market will be headed for the next five years. Furthermore, the varying trends of segment & categories geographically presented are also studied and the estimated based on the primary & secondary research.

      In this particular report from the supply side Data Library Research has conducted primary surveys (interviews) with the key level executives (VP, CEO’s, Marketing Director, Business Development Manager and SOFT) of the companies that active & prominent as well as the midsized organization

      FIGURE 1: DLR RESEARH PROCESS

      research-methodology1

      Primary Research

      Extensive primary research was conducted to gain a deeper insight of the market and industry performance. The analysis is based on both primary and secondary research as well as years of professional expertise in the respective industries.

      In addition to analysing current and historical trends, our analysts predict where the market is headed over the next five years.

      It varies by segment for these categories geographically presented in the list of market tables. Speaking about this particular report we have conducted primary surveys (interviews) with the key level executives (VP, CEO’s, Marketing Director, Business Development Manager and many more) of the major players active in the market.

      Secondary Research

      Secondary research was mainly used to collect and identify information useful for the extensive, technical, market-oriented, and Friend’s study of the Global Extra Neutral Alcohol. It was also used to obtain key information about major players, market classification and segmentation according to the industry trends, geographical markets, and developments related to the market and technology perspectives. For this study, analysts have gathered information from various credible sources, such as annual reports, sec filings, journals, white papers, SOFT presentations, and company web sites.

      Market Size Estimation

      Both, top-down and bottom-up approaches were used to estimate and validate the size of the Global market and to estimate the size of various other dependent submarkets in the overall Extra Neutral Alcohol. The key players in the market were identified through secondary research and their market contributions in the respective geographies were determined through primary and secondary research.

      Forecast Model

      research-methodology2