Automotive Grade AI Chip Market Overview and Analysis:
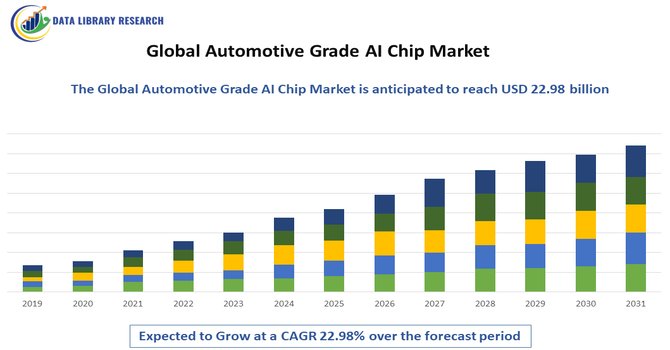
- The Market size was valued at USD 5.01 billion in 2025 and is projected to reach USD 22.98 billion by 2032, growing with a CAGR of 22.98% from 2025 to 2032.
Get Complete Analysis Of The Report - Download Updated Free Sample PDF
The global automotive-grade AI chip market refers to specialized microchips designed for vehicles to support artificial intelligence applications. These chips enable advanced driver-assistance systems (ADAS), autonomous driving, in-car infotainment, and real-time data processing. Growing demand for smarter, safer, and connected vehicles drives market expansion worldwide.
The growth of the global automotive-grade AI chip market is driven by increasing adoption of autonomous and semi-autonomous vehicles, rising demand for advanced driver-assistance systems (ADAS), the expansion of connected car technologies, and the need for real-time data processing. Technological advancements in AI, sensor integration, and in-vehicle computing further accelerate market expansion.
Automotive Grade AI Chip Market Latest Trends
The global automotive-grade AI chip market has grown rapidly with the adoption of Advanced Driver-Assistance Systems (ADAS) and smart-cockpit electronics, making AI chips essential for real-time sensor fusion, autonomous driving, and connected-vehicle features. Automakers increasingly embed powerful AI processors to support navigation, collision avoidance, infotainment, and electric-vehicle power management. Edge-AI adoption is rising, as on-vehicle processing reduces latency and dependence on cloud connectivity, improving safety, responsiveness, and reliability. Continuous innovations in semiconductor design, power efficiency, and AI capabilities are driving widespread integration of these chips in both passenger and commercial vehicles, shaping the future of intelligent mobility.
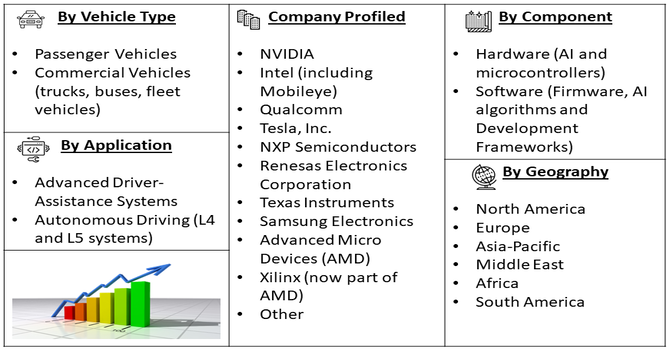
Segmentation: The Automotive Grade AI Chip Market is segmented by Component (Hardware (AI and microcontrollers) and Software (Firmware, AI algorithms, and Development Frameworks), Application (Advanced Driver-Assistance Systems and Autonomous Driving (L4 and L5 systems), Vehicle Type (Passenger Vehicles and and Commercial Vehicles (trucks, buses, fleet vehicles)), Processing Type (Edge AI and Cloud/Data Center AI), and Geography (North America, Europe, Asia-Pacific, Middle East and Africa, and South America). The report provides the value (in USD million) for the above segments.
For Detailed Market Segmentation - Get a Free Sample PDF
Market Drivers:
- Rising Adoption of Autonomous and Advanced Driver-Assistance Systems (ADAS)
A primary driver of the global automotive-grade AI chip market is the accelerated adoption of ADAS and autonomous vehicle technologies. Vehicles increasingly rely on AI chips to process real-time data from cameras, LiDAR, radar, and sensors, enabling critical features such as collision avoidance, lane-keeping, adaptive cruise control, and automated parking. The industry’s shift toward higher levels of vehicle automation, coupled with regulatory mandates for enhanced safety, has fueled demand for high-performance, energy-efficient AI processors capable of handling complex computations reliably. This trend significantly accelerates the deployment and integration of AI chips in modern vehicles.
- Integration of Connected Car Technologies and Smart Mobility Solutions
Another major growth driver is the increasing incorporation of connected car technologies, in-vehicle infotainment, and electric vehicle systems that demand robust AI processing. Automotive AI chips facilitate real-time navigation, voice recognition, augmented reality dashboards, predictive maintenance, and energy optimization, enhancing overall driving experiences. Consumer expectations for safer, smarter, and more interactive vehicles drive automakers to invest in AI-powered electronics. Technological advancements such as edge AI, high-performance SoCs, and low-power neural processing units enable real-time on-board computation, reducing latency and dependency on cloud networks, thereby expanding the automotive AI chip market globally.
Market Restraints:
- High Costs and Integration Challenges
Despite strong market potential, the adoption of automotive-grade AI chips is constrained by high costs and integration complexities. Advanced GPUs, FPGAs, and AI SoCs significantly increase vehicle production costs, limiting adoption in cost-sensitive markets. Furthermore, designing chips that meet stringent automotive safety, reliability, and energy-efficiency standards presents technical challenges. Supply chain constraints and semiconductor shortages can hinder production, while platform compatibility and prolonged validation cycles delay deployment. These factors collectively act as barriers, slowing market expansion despite growing demand for intelligent, autonomous, and connected vehicle technologies.
Socio Economic Impact on Automotive Grade AI Chip Market
Automotive AI chips contribute to safer, more efficient, and smarter vehicles, reducing accidents through advanced ADAS and enabling autonomous mobility. The increased semiconductor content per vehicle supports higher manufacturing output, research and development, and employment for skilled labor. Consumers benefit from enhanced convenience, energy-efficient electric vehicles, and improved in-car experiences. Broad adoption may also lower long-term costs for insurers and healthcare systems by reducing accident-related expenses.
Segmental Analysis:
- Firmware segment is expected to witness the highest growth over the forecast period
The firmware segment is expected to witness the highest growth over the forecast period as vehicles increasingly rely on embedded software to manage complex AI chip operations. Firmware enables seamless interaction between hardware and software, ensuring optimal performance of ADAS, infotainment, and vehicle control systems. Frequent updates improve functionality, safety, and responsiveness, enhancing the overall driving experience. Additionally, firmware facilitates over-the-air (OTA) updates, allowing automakers to continuously optimize AI-driven features without requiring physical recalls. With growing demand for smarter, connected, and autonomous vehicles, the firmware segment plays a critical role in unlocking the full potential of automotive-grade AI chips, driving market expansion globally.
- Advanced Driver-Assistance Systems segment is expected to witness the highest growth over the forecast period
The ADAS segment is expected to witness the highest growth, driven by the rising adoption of features like lane departure warning, adaptive cruise control, automatic emergency braking, and parking assistance. AI chips are central to processing the vast amounts of sensor and camera data required for these systems, enabling real-time decision-making and enhanced safety. Stringent regulatory standards and government mandates in regions like North America and Europe are accelerating ADAS implementation. Consumer demand for safer, more convenient driving experiences further fuels growth. As automakers integrate more advanced and semi-autonomous capabilities, ADAS continues to serve as a primary growth driver for the automotive-grade AI chip market.
- Edge AI segment is expected to witness highest growth over the forecast period
The edge AI segment is expected to witness the highest growth over the forecast period due to increasing demand for real-time, on-vehicle data processing. Edge AI allows autonomous vehicles and connected cars to analyze sensor input locally, reducing latency and reliance on cloud infrastructure while improving responsiveness and safety. This capability is crucial for applications such as autonomous driving, collision avoidance, predictive maintenance, and smart infotainment systems. Growing adoption of electric vehicles and connected mobility solutions further drives the need for high-performance, low-power edge AI chips. As technology matures, edge AI is becoming a core component of modern automotive AI architectures.
- North America Region segment is expected to witness the highest growth over the forecast period
The North America region is expected to witness the highest growth in the automotive-grade AI chip market due to advanced automotive R&D, strong regulatory support, and early adoption of connected and autonomous vehicle technologies. For instance, in December 2024, Synopsys and SiMa.ai announced a strategic collaboration to deliver solutions accelerating development of workload-specific silicon and AI software for next-generation vehicles. By combining Synopsys’ EDA and automotive-grade IP with SiMa.ai’s machine learning accelerators and software, the partnership enhanced North America’s automotive-grade AI chip market, boosting innovation, customization, and adoption.
The presence of leading automakers and semiconductor manufacturers accelerates innovation in AI processors, ADAS, and edge computing solutions. Consumer demand for safer, smarter, and connected vehicles drives market expansion, while significant investments in electric and autonomous vehicle programs reinforce growth. Additionally, supportive government policies, infrastructure for smart mobility, and widespread deployment of AI-enabled automotive technologies position North America as a key hub for automotive AI chip adoption during the forecast period.
| Report Matrics |
Details |
| Market Size Value |
USD 22.98 billion |
| Growth Rate |
CAGR of 22.98% |
| Forecast |
2026-2033 |
| Historical data |
2021-2024 |
| Base Year |
2025 |
| Report Coverage |
Forecasted revenue, company rating, competitive environment, growth drivers, and trends |
| Segment Coverage |
Type, Application, End-User, Geography |
| Regional Scope |
North America, Europe, Asia Pacific, Middle East |
| Customized scope |
Free customization of reports (With 3 months' analysis support) |
| To Learn More About This Report |
Request a Free Sample Copy |
Automotive Grade AI Chip Market Competitive Landscape
The automotive-grade AI chip market is highly competitive, with major semiconductor and technology companies supplying GPUs, SoCs, and embedded MCUs. Leading players differentiate through performance, energy efficiency, safety compliance, and integration with vehicle systems. Emerging startups and new entrants are developing chiplet-based AI accelerators and specialized processors, pushing innovation cycles faster. Partnerships between automakers and chip manufacturers are increasing to co-develop AI solutions for next-generation vehicles. The market is also characterized by continuous investment in R&D to improve processing power, reduce latency, and support autonomous driving and connected-vehicle applications, fostering rapid technological advancement.
The major players for this market are:
- NVIDIA
- Intel (including Mobileye)
- Qualcomm
- Tesla, Inc.
- NXP Semiconductors
- Renesas Electronics Corporation
- Texas Instruments
- Samsung Electronics
- Advanced Micro Devices (AMD)
- Xilinx (now part of AMD)
- Infineon Technologies
- Horizon Robotics
- Ambarella Inc.
- STMicroelectronics
- MediaTek
- Huawei Technologies
- Baidu, Inc.
- ARM Holdings
- Broadcom Inc.
- Micron Technology
Recent Development
- In September 2025, Qualcomm Technologies, Inc. and HARMAN announced a collaboration to deliver advanced cockpit solutions, aiming to bridge the gap between driver expectations and traditional vehicle capabilities. The partnership focused on accelerating the consumer-tech transformation of the automotive industry, enabling vehicles to update, adapt, and evolve more like modern smartphones.
- In January 2025, NVIDIA announced that its autonomous vehicle platform, DRIVE AGX Hyperion, had passed industry-safety assessments by TÜV SÜD and TÜV Rheinland, setting a new benchmark for AV safety, innovation, and performance. This milestone strengthened confidence in automotive-grade AI chips, driving adoption, accelerating development, and boosting growth in the global market.
Frequently Asked Questions (FAQ) :
Q1. What are the main growth-driving factors for this market?
The main driver is the aggressive push toward autonomous and highly connected vehicles. The increasing integration of Advanced Driver-Assistance Systems (ADAS), such as adaptive cruise control and lane-keeping, requires immense real-time processing power, which only specialized AI chips can provide. Furthermore, the global shift to electric vehicles (EVs) is driving demand for chips in power management and battery systems.
Q2. What are the main restraining factors for this market?
The market faces significant restraints primarily due to the intense and lengthy process of meeting stringent automotive safety standards (like AEC-Q100 and ISO 26262), which slows down development and integration. High manufacturing costs for advanced semiconductor nodes, coupled with persistent supply chain volatility and geopolitical tensions, also create risks and hinder the speed of mass production.
Q3. Which segment is expected to witness high growth?
The Autonomous Driving segment is expected to witness the highest growth rate. As vehicles move from Level 2 (driver assistance) to Level 4 (high automation), the computational requirements for sensor fusion, decision-making, and path planning surge exponentially. This transition necessitates incredibly powerful, specialized System-on-Chips (SoCs), driving significant revenue growth for high-end AI processors.
Q4. Who are the top major players for this market?
The competitive landscape is led by major technology powerhouses and established semiconductor firms. Key players include NVIDIA (known for its DRIVE platform), Mobileye (Intel subsidiary, known for EyeQ SoCs), and traditional automotive chip suppliers like Infineon Technologies and NXP Semiconductors. Tesla also uses its own custom-designed AI chips in its vehicles.
Q5. Which country is the largest player?
The Asia-Pacific (APAC) region, specifically driven by the rapid growth in China, Japan, and South Korea, currently holds the largest market share in terms of volume and consumption. This is fueled by China's massive electric vehicle production and the region's strong domestic semiconductor manufacturing base. North America, however, remains dominant in high-value AI chip design and technological leadership.
List of Figures
Figure 1: Global Automotive Grade AI Chip Market Revenue Breakdown (USD Billion, %) by Region, 2022 & 2029
Figure 2: Global Automotive Grade AI Chip Market Value Share (%), By Segment 1, 2022 & 2029
Figure 3: Global Automotive Grade AI Chip Market Forecast (USD Billion), by Sub-Segment 1, 2018-2029
Figure 4: Global Automotive Grade AI Chip Market Forecast (USD Billion), by Sub-Segment 2, 2018-2029
Figure 5: Global Automotive Grade AI Chip Market Value Share (%), By Segment 2, 2022 & 2029
Figure 6: Global Automotive Grade AI Chip Market Forecast (USD Billion), by Sub-Segment 1, 2018-2029
Figure 7: Global Automotive Grade AI Chip Market Forecast (USD Billion), by Sub-Segment 2, 2018-2029
Figure 8: Global Automotive Grade AI Chip Market Forecast (USD Billion), by Sub-Segment 3, 2018-2029
Figure 9: Global Automotive Grade AI Chip Market Forecast (USD Billion), by Others, 2018-2029
Figure 10: Global Automotive Grade AI Chip Market Value Share (%), By Segment 3, 2022 & 2029
Figure 11: Global Automotive Grade AI Chip Market Forecast (USD Billion), by Sub-Segment 1, 2018-2029
Figure 12: Global Automotive Grade AI Chip Market Forecast (USD Billion), by Sub-Segment 2, 2018-2029
Figure 13: Global Automotive Grade AI Chip Market Forecast (USD Billion), by Sub-Segment 3, 2018-2029
Figure 14: Global Automotive Grade AI Chip Market Forecast (USD Billion), by Others, 2018-2029
Figure 15: Global Automotive Grade AI Chip Market Value (USD Billion), by Region, 2022 & 2029
Figure 16: North America Automotive Grade AI Chip Market Value Share (%), By Segment 1, 2022 & 2029
Figure 17: North America Automotive Grade AI Chip Market Forecast (USD Billion), by Sub-Segment 1, 2018-2029
Figure 18: North America Automotive Grade AI Chip Market Forecast (USD Billion), by Sub-Segment 2, 2018-2029
Figure 19: North America Automotive Grade AI Chip Market Value Share (%), By Segment 2, 2022 & 2029
Figure 20: North America Automotive Grade AI Chip Market Forecast (USD Billion), by Sub-Segment 1, 2018-2029
Figure 21: North America Automotive Grade AI Chip Market Forecast (USD Billion), by Sub-Segment 2, 2018-2029
Figure 22: North America Automotive Grade AI Chip Market Forecast (USD Billion), by Sub-Segment 3, 2018-2029
Figure 23: North America Automotive Grade AI Chip Market Forecast (USD Billion), by Others, 2018-2029
Figure 24: North America Automotive Grade AI Chip Market Value Share (%), By Segment 3, 2022 & 2029
Figure 25: North America Automotive Grade AI Chip Market Forecast (USD Billion), by Sub-Segment 1, 2018-2029
Figure 26: North America Automotive Grade AI Chip Market Forecast (USD Billion), by Sub-Segment 2, 2018-2029
Figure 27: North America Automotive Grade AI Chip Market Forecast (USD Billion), by Sub-Segment 3, 2018-2029
Figure 28: North America Automotive Grade AI Chip Market Forecast (USD Billion), by Others, 2018-2029
Figure 29: North America Automotive Grade AI Chip Market Forecast (USD Billion), by U.S., 2018-2029
Figure 30: North America Automotive Grade AI Chip Market Forecast (USD Billion), by Canada, 2018-2029
Figure 31: Latin America Automotive Grade AI Chip Market Value Share (%), By Segment 1, 2022 & 2029
Figure 32: Latin America Automotive Grade AI Chip Market Forecast (USD Billion), by Sub-Segment 1, 2018-2029
Figure 33: Latin America Automotive Grade AI Chip Market Forecast (USD Billion), by Sub-Segment 2, 2018-2029
Figure 34: Latin America Automotive Grade AI Chip Market Value Share (%), By Segment 2, 2022 & 2029
Figure 35: Latin America Automotive Grade AI Chip Market Forecast (USD Billion), by Sub-Segment 1, 2018-2029
Figure 36: Latin America Automotive Grade AI Chip Market Forecast (USD Billion), by Sub-Segment 2, 2018-2029
Figure 37: Latin America Automotive Grade AI Chip Market Forecast (USD Billion), by Sub-Segment 3, 2018-2029
Figure 38: Latin America Automotive Grade AI Chip Market Forecast (USD Billion), by Others, 2018-2029
Figure 39: Latin America Automotive Grade AI Chip Market Value Share (%), By Segment 3, 2022 & 2029
Figure 40: Latin America Automotive Grade AI Chip Market Forecast (USD Billion), by Sub-Segment 1, 2018-2029
Figure 41: Latin America Automotive Grade AI Chip Market Forecast (USD Billion), by Sub-Segment 2, 2018-2029
Figure 42: Latin America Automotive Grade AI Chip Market Forecast (USD Billion), by Sub-Segment 3, 2018-2029
Figure 43: Latin America Automotive Grade AI Chip Market Forecast (USD Billion), by Others, 2018-2029
Figure 44: Latin America Automotive Grade AI Chip Market Forecast (USD Billion), by Brazil, 2018-2029
Figure 45: Latin America Automotive Grade AI Chip Market Forecast (USD Billion), by Mexico, 2018-2029
Figure 46: Latin America Automotive Grade AI Chip Market Forecast (USD Billion), by Rest of Latin America, 2018-2029
Figure 47: Europe Automotive Grade AI Chip Market Value Share (%), By Segment 1, 2022 & 2029
Figure 48: Europe Automotive Grade AI Chip Market Forecast (USD Billion), by Sub-Segment 1, 2018-2029
Figure 49: Europe Automotive Grade AI Chip Market Forecast (USD Billion), by Sub-Segment 2, 2018-2029
Figure 50: Europe Automotive Grade AI Chip Market Value Share (%), By Segment 2, 2022 & 2029
Figure 51: Europe Automotive Grade AI Chip Market Forecast (USD Billion), by Sub-Segment 1, 2018-2029
Figure 52: Europe Automotive Grade AI Chip Market Forecast (USD Billion), by Sub-Segment 2, 2018-2029
Figure 53: Europe Automotive Grade AI Chip Market Forecast (USD Billion), by Sub-Segment 3, 2018-2029
Figure 54: Europe Automotive Grade AI Chip Market Forecast (USD Billion), by Others, 2018-2029
Figure 55: Europe Automotive Grade AI Chip Market Value Share (%), By Segment 3, 2022 & 2029
Figure 56: Europe Automotive Grade AI Chip Market Forecast (USD Billion), by Sub-Segment 1, 2018-2029
Figure 57: Europe Automotive Grade AI Chip Market Forecast (USD Billion), by Sub-Segment 2, 2018-2029
Figure 58: Europe Automotive Grade AI Chip Market Forecast (USD Billion), by Sub-Segment 3, 2018-2029
Figure 59: Europe Automotive Grade AI Chip Market Forecast (USD Billion), by Others, 2018-2029
Figure 60: Europe Automotive Grade AI Chip Market Forecast (USD Billion), by U.K., 2018-2029
Figure 61: Europe Automotive Grade AI Chip Market Forecast (USD Billion), by Germany, 2018-2029
Figure 62: Europe Automotive Grade AI Chip Market Forecast (USD Billion), by France, 2018-2029
Figure 63: Europe Automotive Grade AI Chip Market Forecast (USD Billion), by Italy, 2018-2029
Figure 64: Europe Automotive Grade AI Chip Market Forecast (USD Billion), by Spain, 2018-2029
Figure 65: Europe Automotive Grade AI Chip Market Forecast (USD Billion), by Russia, 2018-2029
Figure 66: Europe Automotive Grade AI Chip Market Forecast (USD Billion), by Rest of Europe, 2018-2029
Figure 67: Asia Pacific Automotive Grade AI Chip Market Value Share (%), By Segment 1, 2022 & 2029
Figure 68: Asia Pacific Automotive Grade AI Chip Market Forecast (USD Billion), by Sub-Segment 1, 2018-2029
Figure 69: Asia Pacific Automotive Grade AI Chip Market Forecast (USD Billion), by Sub-Segment 2, 2018-2029
Figure 70: Asia Pacific Automotive Grade AI Chip Market Value Share (%), By Segment 2, 2022 & 2029
Figure 71: Asia Pacific Automotive Grade AI Chip Market Forecast (USD Billion), by Sub-Segment 1, 2018-2029
Figure 72: Asia Pacific Automotive Grade AI Chip Market Forecast (USD Billion), by Sub-Segment 2, 2018-2029
Figure 73: Asia Pacific Automotive Grade AI Chip Market Forecast (USD Billion), by Sub-Segment 3, 2018-2029
Figure 74: Asia Pacific Automotive Grade AI Chip Market Forecast (USD Billion), by Others, 2018-2029
Figure 75: Asia Pacific Automotive Grade AI Chip Market Value Share (%), By Segment 3, 2022 & 2029
Figure 76: Asia Pacific Automotive Grade AI Chip Market Forecast (USD Billion), by Sub-Segment 1, 2018-2029
Figure 77: Asia Pacific Automotive Grade AI Chip Market Forecast (USD Billion), by Sub-Segment 2, 2018-2029
Figure 78: Asia Pacific Automotive Grade AI Chip Market Forecast (USD Billion), by Sub-Segment 3, 2018-2029
Figure 79: Asia Pacific Automotive Grade AI Chip Market Forecast (USD Billion), by Others, 2018-2029
Figure 80: Asia Pacific Automotive Grade AI Chip Market Forecast (USD Billion), by China, 2018-2029
Figure 81: Asia Pacific Automotive Grade AI Chip Market Forecast (USD Billion), by India, 2018-2029
Figure 82: Asia Pacific Automotive Grade AI Chip Market Forecast (USD Billion), by Japan, 2018-2029
Figure 83: Asia Pacific Automotive Grade AI Chip Market Forecast (USD Billion), by Australia, 2018-2029
Figure 84: Asia Pacific Automotive Grade AI Chip Market Forecast (USD Billion), by Southeast Asia, 2018-2029
Figure 85: Asia Pacific Automotive Grade AI Chip Market Forecast (USD Billion), by Rest of Asia Pacific, 2018-2029
Figure 86: Middle East & Africa Automotive Grade AI Chip Market Value Share (%), By Segment 1, 2022 & 2029
Figure 87: Middle East & Africa Automotive Grade AI Chip Market Forecast (USD Billion), by Sub-Segment 1, 2018-2029
Figure 88: Middle East & Africa Automotive Grade AI Chip Market Forecast (USD Billion), by Sub-Segment 2, 2018-2029
Figure 89: Middle East & Africa Automotive Grade AI Chip Market Value Share (%), By Segment 2, 2022 & 2029
Figure 90: Middle East & Africa Automotive Grade AI Chip Market Forecast (USD Billion), by Sub-Segment 1, 2018-2029
Figure 91: Middle East & Africa Automotive Grade AI Chip Market Forecast (USD Billion), by Sub-Segment 2, 2018-2029
Figure 92: Middle East & Africa Automotive Grade AI Chip Market Forecast (USD Billion), by Sub-Segment 3, 2018-2029
Figure 93: Middle East & Africa Automotive Grade AI Chip Market Forecast (USD Billion), by Others, 2018-2029
Figure 94: Middle East & Africa Automotive Grade AI Chip Market Value Share (%), By Segment 3, 2022 & 2029
Figure 95: Middle East & Africa Automotive Grade AI Chip Market Forecast (USD Billion), by Sub-Segment 1, 2018-2029
Figure 96: Middle East & Africa Automotive Grade AI Chip Market Forecast (USD Billion), by Sub-Segment 2, 2018-2029
Figure 97: Middle East & Africa Automotive Grade AI Chip Market Forecast (USD Billion), by Sub-Segment 3, 2018-2029
Figure 98: Middle East & Africa Automotive Grade AI Chip Market Forecast (USD Billion), by Others, 2018-2029
Figure 99: Middle East & Africa Automotive Grade AI Chip Market Forecast (USD Billion), by GCC, 2018-2029
Figure 100: Middle East & Africa Automotive Grade AI Chip Market Forecast (USD Billion), by South Africa, 2018-2029
Figure 101: Middle East & Africa Automotive Grade AI Chip Market Forecast (USD Billion), by Rest of Middle East & Africa, 2018-2029
List of Tables
Table 1: Global Automotive Grade AI Chip Market Revenue (USD Billion) Forecast, by Segment 1, 2018-2029
Table 2: Global Automotive Grade AI Chip Market Revenue (USD Billion) Forecast, by Segment 2, 2018-2029
Table 3: Global Automotive Grade AI Chip Market Revenue (USD Billion) Forecast, by Segment 3, 2018-2029
Table 4: Global Automotive Grade AI Chip Market Revenue (USD Billion) Forecast, by Region, 2018-2029
Table 5: North America Automotive Grade AI Chip Market Revenue (USD Billion) Forecast, by Segment 1, 2018-2029
Table 6: North America Automotive Grade AI Chip Market Revenue (USD Billion) Forecast, by Segment 2, 2018-2029
Table 7: North America Automotive Grade AI Chip Market Revenue (USD Billion) Forecast, by Segment 3, 2018-2029
Table 8: North America Automotive Grade AI Chip Market Revenue (USD Billion) Forecast, by Country, 2018-2029
Table 9: Europe Automotive Grade AI Chip Market Revenue (USD Billion) Forecast, by Segment 1, 2018-2029
Table 10: Europe Automotive Grade AI Chip Market Revenue (USD Billion) Forecast, by Segment 2, 2018-2029
Table 11: Europe Automotive Grade AI Chip Market Revenue (USD Billion) Forecast, by Segment 3, 2018-2029
Table 12: Europe Automotive Grade AI Chip Market Revenue (USD Billion) Forecast, by Country, 2018-2029
Table 13: Latin America Automotive Grade AI Chip Market Revenue (USD Billion) Forecast, by Segment 1, 2018-2029
Table 14: Latin America Automotive Grade AI Chip Market Revenue (USD Billion) Forecast, by Segment 2, 2018-2029
Table 15: Latin America Automotive Grade AI Chip Market Revenue (USD Billion) Forecast, by Segment 3, 2018-2029
Table 16: Latin America Automotive Grade AI Chip Market Revenue (USD Billion) Forecast, by Country, 2018-2029
Table 17: Asia Pacific Automotive Grade AI Chip Market Revenue (USD Billion) Forecast, by Segment 1, 2018-2029
Table 18: Asia Pacific Automotive Grade AI Chip Market Revenue (USD Billion) Forecast, by Segment 2, 2018-2029
Table 19: Asia Pacific Automotive Grade AI Chip Market Revenue (USD Billion) Forecast, by Segment 3, 2018-2029
Table 20: Asia Pacific Automotive Grade AI Chip Market Revenue (USD Billion) Forecast, by Country, 2018-2029
Table 21: Middle East & Africa Automotive Grade AI Chip Market Revenue (USD Billion) Forecast, by Segment 1, 2018-2029
Table 22: Middle East & Africa Automotive Grade AI Chip Market Revenue (USD Billion) Forecast, by Segment 2, 2018-2029
Table 23: Middle East & Africa Automotive Grade AI Chip Market Revenue (USD Billion) Forecast, by Segment 3, 2018-2029
Table 24: Middle East & Africa Automotive Grade AI Chip Market Revenue (USD Billion) Forecast, by Country, 2018-2029
Research Process
Data Library Research are conducted by industry experts who offer insight on
industry structure, market segmentations technology assessment and competitive landscape (CL), and penetration, as well as on emerging trends. Their analysis is based on primary interviews (~ 80%) and secondary research (~ 20%) as well as years of professional expertise in their respective industries. Adding to this, by analysing historical trends and current market positions, our analysts predict where the market will be headed for the next five years. Furthermore, the varying trends of segment & categories geographically presented are also studied and the estimated based on the primary & secondary research.
In this particular report from the supply side Data Library Research has conducted primary surveys (interviews) with the key level executives (VP, CEO’s, Marketing Director, Business Development Manager
and SOFT) of the companies that active & prominent as well as the midsized organization
FIGURE 1: DLR RESEARH PROCESS
![research-methodology1]()
Primary Research
Extensive primary research was conducted to gain a deeper insight of the market and industry performance. The analysis is based on both primary and secondary research as well as years of professional expertise in the respective industries.
In addition to analysing current and historical trends, our analysts predict where the market is headed over the next five years.
It varies by segment for these categories geographically presented in the list of market tables. Speaking about this particular report we have conducted primary surveys (interviews) with the key level executives (VP, CEO’s, Marketing Director, Business Development Manager and many more) of the major players active in the market.
Secondary Research
Secondary research was mainly used to collect and identify information useful for the extensive, technical, market-oriented, and Friend’s study of the Global Extra Neutral Alcohol. It was also used to obtain key information about major players, market classification and segmentation according to the industry trends, geographical markets, and developments related to the market and technology perspectives. For this study, analysts have gathered information from various credible sources, such as annual reports, sec filings, journals, white papers, SOFT presentations, and company web sites.
Market Size Estimation
Both, top-down and bottom-up approaches were used to estimate and validate the size of the Global market and to estimate the size of various other dependent submarkets in the overall Extra Neutral Alcohol. The key players in the market were identified through secondary research and their market contributions in the respective geographies were determined through primary and secondary research.
Forecast Model
![research-methodology2]()