Pollution-control Barge Market Overview and Analysis
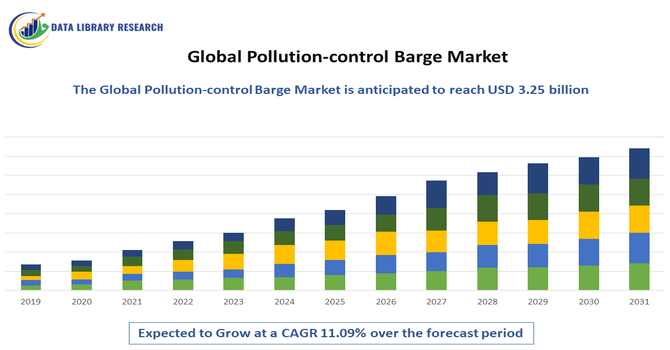
- The global pollution-control barge market is experiencing strong growth, projected to grow from an estimated USD 1.9 billion in 2025 to USD 3.25 billion by 2032, growing with a CAGR of 11.09% from 2025-2032.
Get Complete Analysis Of The Report - Download Updated Free Sample PDF
The global pollution-control barge market is growing as governments, ports, offshore operators and commercial shippers increase investments in on-water pollution response and mitigation capacity. Rising regulatory pressure after high-profile oil spills, expanding offshore oil & gas and shipping activity, and greater public/industry focus on marine environmental protection are all pushing owners and authorities to procure dedicated barges and modular pollution-response units (skimming, storage, separation and treatment). Recent market reports estimate the market in the low-billions USD today with mid-single-digit to low-double-digit CAGRs through the next decade, reflecting strong but steady demand tied to regulatory cycles and project funding.
Pollution-control Barge Market Latest Trends
The Global Pollution-Control Barge market is shifting from single-purpose skimming and boom-deployment platforms toward multi-role, modular barges and retrofit kits that let ports and operators convert standard support vessels quickly for spill response and wastewater treatment, improving flexibility and cutting costs. At the same time, regulatory pressure and higher government spending on marine pollution preparedness—together with rising offshore activity—are driving market growth and fleet renewals. Technology trends include wider use of AI and satellite-based early detection, improved skimmer/boom designs, and on-board treatment systems (separators, filtration and advanced oxidation) that reduce recovered waste volumes and speed remediation. Sustainability innovations — bio-based absorbents, reusable booms and greener propulsion for response craft — are gaining attention as operators seek lower life-cycle impacts.
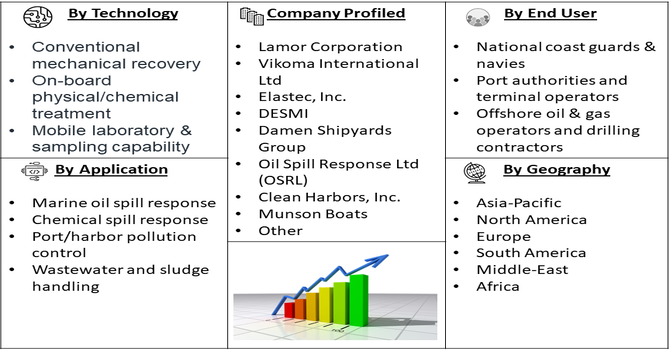
Segmentation: Global Pollution-control Barge Market is segmented By Application (Marine oil spill response, Chemical spill response, Port/harbor pollution control, Wastewater and sludge handling), Equipment / Component (Skimming systems, Containment booms & anchoring systems), Technology / Capability (Conventional mechanical recovery, On-board physical/chemical treatment, Mobile laboratory & sampling capability, Remote monitoring, AI-assisted detection, and satellite analytics integration), End-User (National coast guards & navies, Port authorities and terminal operators, Offshore oil & gas operators and drilling contractors) and Geography (North America, Europe, Asia-Pacific, Middle East and Africa, and South America). The report provides the value (in USD million) for the above segments.
For Detailed Market Segmentation - Get a Free Sample PDF
Market Drivers:
- Stringent international marine pollution regulations and port compliance mandates
Growing enforcement of MARPOL rules, IMO spill-preparedness standards, and national coastal protection policies are compelling ports, offshore operators, and shipowners to invest in dedicated pollution-control infrastructure. Rising penalties and mandatory spill-response readiness programs are pushing demand for skimming, containment, and treatment barges to ensure regulatory compliance and faster emergency response.
- Increasing maritime traffic, offshore energy activity, and spill risk
Expanding global seaborne trade, offshore oil & gas operations, and coastal industrial activity are heightening the risk of marine pollution events. As ports become busier and offshore developments move into deeper and harsher environments, the need for rapid-deployment cleanup platforms, advanced recovery technologies, and modular pollution-control barges is growing, supporting proactive preparedness and minimizing environmental and economic damage.
Market Restraints
- High Capital Investment and Operational Costs
High capital investment and operational costs remain key barriers, as pollution-control barges require specialized equipment, storage systems, treatment technologies, and skilled crews, resulting in significant upfront and lifecycle spending. Additionally, inconsistent enforcement of environmental regulations across regions reduces demand predictability markets with weak maritime compliance frameworks often delay or avoid procurement, limiting global adoption. Technical limitations, such as restricted maneuverability in shallow and congested ports, and dependence on favorable weather conditions for skimming and boom deployment, also impact operational effectiveness. Furthermore, the infrequent nature of major spill events in some regions leads to budget prioritization away from dedicated marine environmental response assets, slowing fleet expansion and modernization. Finally, long procurement cycles, public funding constraints, and coordination challenges among port authorities, coast guards, and private operators contribute to delayed deployments and slower market growth.
Socio Economic Impact on Pollution-control Barge Market
The global pollution-control barge market has generated significant socioeconomic benefits by promoting cleaner and safer maritime operations, reducing environmental hazards, and protecting coastal and marine ecosystems. Increased deployment of these barges has created skilled employment opportunities in vessel operation, maintenance, and environmental monitoring. Stricter regulations and rising maritime traffic have driven investments in eco-friendly technologies, supporting sustainable port operations and minimizing health risks to nearby communities. Additionally, by preventing water pollution and oil spills, these barges safeguard fisheries, tourism, and local economies, contributing to long-term social welfare and economic stability across regions dependent on maritime trade and coastal resources.
Segmental Analysis
- Oil Spill Response Barges segment is expected to witness highest growth over the forecast period
Oil spill response barges are specialized vessels equipped with skimmers, oil-water separators, containment booms, and storage tanks to remove oil contaminants from water surfaces. They are widely used in ports, offshore energy fields, and coastal areas to quickly address crude and refined oil spills, helping avoid ecological damage and regulatory penalties. Their capability to operate in both emergency and preventive scenarios makes them the most deployed category in pollution-control fleets.
- Mechanical Recovery Systems segment is expected to witness highest growth over the forecast period
Mechanical recovery systems—such as booms, skimmers, and sorbent systems—are core technologies used to physically collect oil or pollutants from water surfaces. They remain the preferred solution due to reliability, simplicity, and compliance with international response standards. These systems are crucial in the first phase of spill mitigation, enabling immediate containment and extraction before secondary treatment occurs.
- Port & Harbor Pollution Control segment is expected to witness highest growth over the forecast period
Ports and harbors see frequent pollution incidents from vessel operations, bilge water discharge, bunkering activities, and accidental spills. Pollution-control barges in this segment focus on routine cleaning, sludge removal, and emergency response. Rising maritime traffic and stricter port-environment regulations drive steady investment in this segment across major global terminals.
Technological advancements in pollution-control barges, such as automated sludge collection systems, real-time water quality monitoring, and eco-friendly waste treatment solutions, have enhanced operational efficiency and environmental compliance. Growing awareness of marine ecosystem preservation and increased government incentives for green port operations further accelerate adoption, boosting the overall growth of the global pollution-control barge market.
- North America region is expected to witness highest growth over the forecast period
The North America region is expected to witness the highest growth over the forecast period in the Global Pollution-control Barge Market, supported by strong environmental enforcement, robust maritime trade activity, and heightened spill-response preparedness mandates in the United States and Canada. Expanding offshore energy operations in the Gulf of Mexico, modernization of coastal infrastructure, and strict regulatory frameworks—such as the U.S. Clean Water Act, MARPOL compliance standards, and Coast Guard emergency-response requirements—are driving investments in advanced pollution-control barges with integrated skimming, containment, and onboard treatment capabilities.
Additionally, the region’s focus on rapid response systems, environmental sustainability initiatives, and upgrading aging pollution-response fleets further accelerates demand, positioning North America as a key driver of market expansion. For instance, in 2022, Tokyo – Mitsui O.S.K. Lines, Ltd. (MOL) agreed to fund Clean Air Engineering Maritime, Inc. (CAEM), a California-based ship auxiliary generator exhaust treatment company, to develop a next-generation Marine Exhaust Treatment System for MOL-operated car carriers from 2025. The initiative aimed to reduce air pollution in California, strengthening emission-control efforts and driving technological adoption, positively impacting the growth and demand trends in the U.S. Pollution-Control Barge Market.
Thus, all such factors are driving the growth of above market in the region.
| Report Matrics |
Details |
| Market Size Value |
USD 3.25 billion |
| Growth Rate |
CAGR of 11.09% |
| Forecast |
2026-2033 |
| Historical data |
2021-2024 |
| Base Year |
2025 |
| Report Coverage |
Forecasted revenue, company rating, competitive environment, growth drivers, and trends |
| Segment Coverage |
Type, Application, End-User, Geography |
| Regional Scope |
North America, Europe, Asia Pacific, Middle East |
| Customized scope |
Free customization of reports (With 3 months Analysis Support ) |
| To Learn More About This Report |
Request a Free Sample Copy |
Pollution-control Barge Market Competitive Landscape
The competitive landscape is fragmented and comprised of three broad player types: specialized oil-spill and pollution-equipment manufacturers (skimmers, booms, on-board treatment modules), shipyards/workboat builders that integrate those systems into barges and response vessels, and integrated environmental-service/response providers that combine equipment, standby fleets and managed-response contracts.
Key Player
- Lamor Corporation
- Vikoma International Ltd
- Elastec, Inc.
- DESMI
- Damen Shipyards Group
- Oil Spill Response Ltd (OSRL)
- Clean Harbors, Inc.
- Munson Boats
- Efinor Sea Cleaner
- New Naval
- Water Witch Ltd
- Seafoil Systems
- Mandovi Drydocks
- AISTER (Aister Shipyards)
- FOILEX Engineering AB
- Murrenhil Corporation
- Markleen AS
- Fast Engineering Limited
- Universal Remediation, Inc.
- JonRie, Inc.
Recent Development
- In July 2025, Goa Shipyard Limited (GSL), a Defence Public Sector Undertaking under India’s Ministry of Defence, launched its second indigenously designed Pollution Control Vessel (PCV), Yard 1268, for the Indian Coast Guard (ICG) at its Vasco-da-Gama shipyard on 23rd July 2025. This deployment strengthened India’s coastal pollution management capabilities and underscored the growing demand for advanced pollution-control vessels, positively influencing the expansion and technological adoption trends in the Global Pollution-Control Barge Market.
- In June 2025, New York City officials, including Mayor Eric Adams, NYCEDC President Andrew Kimball, and DOC Commissioner Lynelle Maginley-Liddie, announced the removal of the decommissioned Vernon C. Bain Correctional Center (VCBC) barge from Hunts Point. The site was repurposed for a new Hunts Point Marine Terminal to transfer cargo from ships to barges and ferries, reducing 9,000 monthly truck trips. The project generated 400 construction jobs, 100 permanent jobs, and USD 3.9 billion economic impact over 30 years. This initiative enhanced US pollution-control barge utilization, promoted sustainable freight movement, and supported reduced roadway congestion and emissions along New York City’s waterfront.
Frequently Asked Questions (FAQ) :
Q1. What are the main growth driving factors for this market?
The market is primarily driven by increasingly strict global environmental regulations concerning marine and inland waterway pollution, particularly for oil spills and waste discharge. Growing public and governmental awareness of the severe impact of water pollution, coupled with the rising volume of maritime trade and industrial activities along coasts and rivers, fuels the demand for specialized, rapid-response clean-up and containment vessels like pollution-control barges.
Q2. What are the main restraining factors for this market?
Major restraining factors include the high initial capital expenditure required to manufacture and deploy specialized pollution-control barges and associated equipment. The market also faces challenges from fluctuating oil prices, which impact the demand for expensive oil spill response vessels. Furthermore, delays in achieving uniform international standards for marine pollution response equipment can sometimes complicate cross-border operations and procurement.
Q3. Which segment is expected to witness high growth?
The Oil Spill Response application segment holds the largest market share and is expected to maintain robust growth, driven by the increasing frequency and potential impact of major oil incidents. Also, the segment focusing on waste and debris collection (especially plastic) in rivers, ports, and near-shore environments is seeing high investment and growth due to rising focus on visible marine trash and port authority initiatives.
Q4. Who are the top major players for this market?
The market is led by companies specializing in maritime environmental solutions and equipment. Key players include dedicated oil spill response and clean-up providers like Lamor (Finland), Polyeco (UAE), and NRC International (USA). Manufacturers specializing in vessel technology, such as Efinor Sea Cleaner and Italdraghe Group, are also key players, focusing on innovative designs for collecting both oil and solid floating debris.
Q5. Which country is the largest player?
The North American region, particularly the United States, holds a significant market share, driven by its extensive inland waterway systems (like the Mississippi River) and major offshore oil and gas activity in the Gulf of Mexico, which necessitates a large fleet. However, the Asia Pacific region is generally projected to show the fastest growth, propelled by rapid industrialization, large coastal populations, and increasing government investment in marine environmental protection.
List of Figures
Figure 1: Global Pollution-control Barge Market Revenue Breakdown (USD Billion, %) by Region, 2022 & 2029
Figure 2: Global Pollution-control Barge Market Value Share (%), By Segment 1, 2022 & 2029
Figure 3: Global Pollution-control Barge Market Forecast (USD Billion), by Sub-Segment 1, 2018-2029
Figure 4: Global Pollution-control Barge Market Forecast (USD Billion), by Sub-Segment 2, 2018-2029
Figure 5: Global Pollution-control Barge Market Value Share (%), By Segment 2, 2022 & 2029
Figure 6: Global Pollution-control Barge Market Forecast (USD Billion), by Sub-Segment 1, 2018-2029
Figure 7: Global Pollution-control Barge Market Forecast (USD Billion), by Sub-Segment 2, 2018-2029
Figure 8: Global Pollution-control Barge Market Forecast (USD Billion), by Sub-Segment 3, 2018-2029
Figure 9: Global Pollution-control Barge Market Forecast (USD Billion), by Others, 2018-2029
Figure 10: Global Pollution-control Barge Market Value Share (%), By Segment 3, 2022 & 2029
Figure 11: Global Pollution-control Barge Market Forecast (USD Billion), by Sub-Segment 1, 2018-2029
Figure 12: Global Pollution-control Barge Market Forecast (USD Billion), by Sub-Segment 2, 2018-2029
Figure 13: Global Pollution-control Barge Market Forecast (USD Billion), by Sub-Segment 3, 2018-2029
Figure 14: Global Pollution-control Barge Market Forecast (USD Billion), by Others, 2018-2029
Figure 15: Global Pollution-control Barge Market Value (USD Billion), by Region, 2022 & 2029
Figure 16: North America Pollution-control Barge Market Value Share (%), By Segment 1, 2022 & 2029
Figure 17: North America Pollution-control Barge Market Forecast (USD Billion), by Sub-Segment 1, 2018-2029
Figure 18: North America Pollution-control Barge Market Forecast (USD Billion), by Sub-Segment 2, 2018-2029
Figure 19: North America Pollution-control Barge Market Value Share (%), By Segment 2, 2022 & 2029
Figure 20: North America Pollution-control Barge Market Forecast (USD Billion), by Sub-Segment 1, 2018-2029
Figure 21: North America Pollution-control Barge Market Forecast (USD Billion), by Sub-Segment 2, 2018-2029
Figure 22: North America Pollution-control Barge Market Forecast (USD Billion), by Sub-Segment 3, 2018-2029
Figure 23: North America Pollution-control Barge Market Forecast (USD Billion), by Others, 2018-2029
Figure 24: North America Pollution-control Barge Market Value Share (%), By Segment 3, 2022 & 2029
Figure 25: North America Pollution-control Barge Market Forecast (USD Billion), by Sub-Segment 1, 2018-2029
Figure 26: North America Pollution-control Barge Market Forecast (USD Billion), by Sub-Segment 2, 2018-2029
Figure 27: North America Pollution-control Barge Market Forecast (USD Billion), by Sub-Segment 3, 2018-2029
Figure 28: North America Pollution-control Barge Market Forecast (USD Billion), by Others, 2018-2029
Figure 29: North America Pollution-control Barge Market Forecast (USD Billion), by U.S., 2018-2029
Figure 30: North America Pollution-control Barge Market Forecast (USD Billion), by Canada, 2018-2029
Figure 31: Latin America Pollution-control Barge Market Value Share (%), By Segment 1, 2022 & 2029
Figure 32: Latin America Pollution-control Barge Market Forecast (USD Billion), by Sub-Segment 1, 2018-2029
Figure 33: Latin America Pollution-control Barge Market Forecast (USD Billion), by Sub-Segment 2, 2018-2029
Figure 34: Latin America Pollution-control Barge Market Value Share (%), By Segment 2, 2022 & 2029
Figure 35: Latin America Pollution-control Barge Market Forecast (USD Billion), by Sub-Segment 1, 2018-2029
Figure 36: Latin America Pollution-control Barge Market Forecast (USD Billion), by Sub-Segment 2, 2018-2029
Figure 37: Latin America Pollution-control Barge Market Forecast (USD Billion), by Sub-Segment 3, 2018-2029
Figure 38: Latin America Pollution-control Barge Market Forecast (USD Billion), by Others, 2018-2029
Figure 39: Latin America Pollution-control Barge Market Value Share (%), By Segment 3, 2022 & 2029
Figure 40: Latin America Pollution-control Barge Market Forecast (USD Billion), by Sub-Segment 1, 2018-2029
Figure 41: Latin America Pollution-control Barge Market Forecast (USD Billion), by Sub-Segment 2, 2018-2029
Figure 42: Latin America Pollution-control Barge Market Forecast (USD Billion), by Sub-Segment 3, 2018-2029
Figure 43: Latin America Pollution-control Barge Market Forecast (USD Billion), by Others, 2018-2029
Figure 44: Latin America Pollution-control Barge Market Forecast (USD Billion), by Brazil, 2018-2029
Figure 45: Latin America Pollution-control Barge Market Forecast (USD Billion), by Mexico, 2018-2029
Figure 46: Latin America Pollution-control Barge Market Forecast (USD Billion), by Rest of Latin America, 2018-2029
Figure 47: Europe Pollution-control Barge Market Value Share (%), By Segment 1, 2022 & 2029
Figure 48: Europe Pollution-control Barge Market Forecast (USD Billion), by Sub-Segment 1, 2018-2029
Figure 49: Europe Pollution-control Barge Market Forecast (USD Billion), by Sub-Segment 2, 2018-2029
Figure 50: Europe Pollution-control Barge Market Value Share (%), By Segment 2, 2022 & 2029
Figure 51: Europe Pollution-control Barge Market Forecast (USD Billion), by Sub-Segment 1, 2018-2029
Figure 52: Europe Pollution-control Barge Market Forecast (USD Billion), by Sub-Segment 2, 2018-2029
Figure 53: Europe Pollution-control Barge Market Forecast (USD Billion), by Sub-Segment 3, 2018-2029
Figure 54: Europe Pollution-control Barge Market Forecast (USD Billion), by Others, 2018-2029
Figure 55: Europe Pollution-control Barge Market Value Share (%), By Segment 3, 2022 & 2029
Figure 56: Europe Pollution-control Barge Market Forecast (USD Billion), by Sub-Segment 1, 2018-2029
Figure 57: Europe Pollution-control Barge Market Forecast (USD Billion), by Sub-Segment 2, 2018-2029
Figure 58: Europe Pollution-control Barge Market Forecast (USD Billion), by Sub-Segment 3, 2018-2029
Figure 59: Europe Pollution-control Barge Market Forecast (USD Billion), by Others, 2018-2029
Figure 60: Europe Pollution-control Barge Market Forecast (USD Billion), by U.K., 2018-2029
Figure 61: Europe Pollution-control Barge Market Forecast (USD Billion), by Germany, 2018-2029
Figure 62: Europe Pollution-control Barge Market Forecast (USD Billion), by France, 2018-2029
Figure 63: Europe Pollution-control Barge Market Forecast (USD Billion), by Italy, 2018-2029
Figure 64: Europe Pollution-control Barge Market Forecast (USD Billion), by Spain, 2018-2029
Figure 65: Europe Pollution-control Barge Market Forecast (USD Billion), by Russia, 2018-2029
Figure 66: Europe Pollution-control Barge Market Forecast (USD Billion), by Rest of Europe, 2018-2029
Figure 67: Asia Pacific Pollution-control Barge Market Value Share (%), By Segment 1, 2022 & 2029
Figure 68: Asia Pacific Pollution-control Barge Market Forecast (USD Billion), by Sub-Segment 1, 2018-2029
Figure 69: Asia Pacific Pollution-control Barge Market Forecast (USD Billion), by Sub-Segment 2, 2018-2029
Figure 70: Asia Pacific Pollution-control Barge Market Value Share (%), By Segment 2, 2022 & 2029
Figure 71: Asia Pacific Pollution-control Barge Market Forecast (USD Billion), by Sub-Segment 1, 2018-2029
Figure 72: Asia Pacific Pollution-control Barge Market Forecast (USD Billion), by Sub-Segment 2, 2018-2029
Figure 73: Asia Pacific Pollution-control Barge Market Forecast (USD Billion), by Sub-Segment 3, 2018-2029
Figure 74: Asia Pacific Pollution-control Barge Market Forecast (USD Billion), by Others, 2018-2029
Figure 75: Asia Pacific Pollution-control Barge Market Value Share (%), By Segment 3, 2022 & 2029
Figure 76: Asia Pacific Pollution-control Barge Market Forecast (USD Billion), by Sub-Segment 1, 2018-2029
Figure 77: Asia Pacific Pollution-control Barge Market Forecast (USD Billion), by Sub-Segment 2, 2018-2029
Figure 78: Asia Pacific Pollution-control Barge Market Forecast (USD Billion), by Sub-Segment 3, 2018-2029
Figure 79: Asia Pacific Pollution-control Barge Market Forecast (USD Billion), by Others, 2018-2029
Figure 80: Asia Pacific Pollution-control Barge Market Forecast (USD Billion), by China, 2018-2029
Figure 81: Asia Pacific Pollution-control Barge Market Forecast (USD Billion), by India, 2018-2029
Figure 82: Asia Pacific Pollution-control Barge Market Forecast (USD Billion), by Japan, 2018-2029
Figure 83: Asia Pacific Pollution-control Barge Market Forecast (USD Billion), by Australia, 2018-2029
Figure 84: Asia Pacific Pollution-control Barge Market Forecast (USD Billion), by Southeast Asia, 2018-2029
Figure 85: Asia Pacific Pollution-control Barge Market Forecast (USD Billion), by Rest of Asia Pacific, 2018-2029
Figure 86: Middle East & Africa Pollution-control Barge Market Value Share (%), By Segment 1, 2022 & 2029
Figure 87: Middle East & Africa Pollution-control Barge Market Forecast (USD Billion), by Sub-Segment 1, 2018-2029
Figure 88: Middle East & Africa Pollution-control Barge Market Forecast (USD Billion), by Sub-Segment 2, 2018-2029
Figure 89: Middle East & Africa Pollution-control Barge Market Value Share (%), By Segment 2, 2022 & 2029
Figure 90: Middle East & Africa Pollution-control Barge Market Forecast (USD Billion), by Sub-Segment 1, 2018-2029
Figure 91: Middle East & Africa Pollution-control Barge Market Forecast (USD Billion), by Sub-Segment 2, 2018-2029
Figure 92: Middle East & Africa Pollution-control Barge Market Forecast (USD Billion), by Sub-Segment 3, 2018-2029
Figure 93: Middle East & Africa Pollution-control Barge Market Forecast (USD Billion), by Others, 2018-2029
Figure 94: Middle East & Africa Pollution-control Barge Market Value Share (%), By Segment 3, 2022 & 2029
Figure 95: Middle East & Africa Pollution-control Barge Market Forecast (USD Billion), by Sub-Segment 1, 2018-2029
Figure 96: Middle East & Africa Pollution-control Barge Market Forecast (USD Billion), by Sub-Segment 2, 2018-2029
Figure 97: Middle East & Africa Pollution-control Barge Market Forecast (USD Billion), by Sub-Segment 3, 2018-2029
Figure 98: Middle East & Africa Pollution-control Barge Market Forecast (USD Billion), by Others, 2018-2029
Figure 99: Middle East & Africa Pollution-control Barge Market Forecast (USD Billion), by GCC, 2018-2029
Figure 100: Middle East & Africa Pollution-control Barge Market Forecast (USD Billion), by South Africa, 2018-2029
Figure 101: Middle East & Africa Pollution-control Barge Market Forecast (USD Billion), by Rest of Middle East & Africa, 2018-2029
List of Tables
Table 1: Global Pollution-control Barge Market Revenue (USD Billion) Forecast, by Segment 1, 2018-2029
Table 2: Global Pollution-control Barge Market Revenue (USD Billion) Forecast, by Segment 2, 2018-2029
Table 3: Global Pollution-control Barge Market Revenue (USD Billion) Forecast, by Segment 3, 2018-2029
Table 4: Global Pollution-control Barge Market Revenue (USD Billion) Forecast, by Region, 2018-2029
Table 5: North America Pollution-control Barge Market Revenue (USD Billion) Forecast, by Segment 1, 2018-2029
Table 6: North America Pollution-control Barge Market Revenue (USD Billion) Forecast, by Segment 2, 2018-2029
Table 7: North America Pollution-control Barge Market Revenue (USD Billion) Forecast, by Segment 3, 2018-2029
Table 8: North America Pollution-control Barge Market Revenue (USD Billion) Forecast, by Country, 2018-2029
Table 9: Europe Pollution-control Barge Market Revenue (USD Billion) Forecast, by Segment 1, 2018-2029
Table 10: Europe Pollution-control Barge Market Revenue (USD Billion) Forecast, by Segment 2, 2018-2029
Table 11: Europe Pollution-control Barge Market Revenue (USD Billion) Forecast, by Segment 3, 2018-2029
Table 12: Europe Pollution-control Barge Market Revenue (USD Billion) Forecast, by Country, 2018-2029
Table 13: Latin America Pollution-control Barge Market Revenue (USD Billion) Forecast, by Segment 1, 2018-2029
Table 14: Latin America Pollution-control Barge Market Revenue (USD Billion) Forecast, by Segment 2, 2018-2029
Table 15: Latin America Pollution-control Barge Market Revenue (USD Billion) Forecast, by Segment 3, 2018-2029
Table 16: Latin America Pollution-control Barge Market Revenue (USD Billion) Forecast, by Country, 2018-2029
Table 17: Asia Pacific Pollution-control Barge Market Revenue (USD Billion) Forecast, by Segment 1, 2018-2029
Table 18: Asia Pacific Pollution-control Barge Market Revenue (USD Billion) Forecast, by Segment 2, 2018-2029
Table 19: Asia Pacific Pollution-control Barge Market Revenue (USD Billion) Forecast, by Segment 3, 2018-2029
Table 20: Asia Pacific Pollution-control Barge Market Revenue (USD Billion) Forecast, by Country, 2018-2029
Table 21: Middle East & Africa Pollution-control Barge Market Revenue (USD Billion) Forecast, by Segment 1, 2018-2029
Table 22: Middle East & Africa Pollution-control Barge Market Revenue (USD Billion) Forecast, by Segment 2, 2018-2029
Table 23: Middle East & Africa Pollution-control Barge Market Revenue (USD Billion) Forecast, by Segment 3, 2018-2029
Table 24: Middle East & Africa Pollution-control Barge Market Revenue (USD Billion) Forecast, by Country, 2018-2029
Research Process
Data Library Research are conducted by industry experts who offer insight on
industry structure, market segmentations technology assessment and competitive landscape (CL), and penetration, as well as on emerging trends. Their analysis is based on primary interviews (~ 80%) and secondary research (~ 20%) as well as years of professional expertise in their respective industries. Adding to this, by analysing historical trends and current market positions, our analysts predict where the market will be headed for the next five years. Furthermore, the varying trends of segment & categories geographically presented are also studied and the estimated based on the primary & secondary research.
In this particular report from the supply side Data Library Research has conducted primary surveys (interviews) with the key level executives (VP, CEO’s, Marketing Director, Business Development Manager
and SOFT) of the companies that active & prominent as well as the midsized organization
FIGURE 1: DLR RESEARH PROCESS
![research-methodology1]()
Primary Research
Extensive primary research was conducted to gain a deeper insight of the market and industry performance. The analysis is based on both primary and secondary research as well as years of professional expertise in the respective industries.
In addition to analysing current and historical trends, our analysts predict where the market is headed over the next five years.
It varies by segment for these categories geographically presented in the list of market tables. Speaking about this particular report we have conducted primary surveys (interviews) with the key level executives (VP, CEO’s, Marketing Director, Business Development Manager and many more) of the major players active in the market.
Secondary Research
Secondary research was mainly used to collect and identify information useful for the extensive, technical, market-oriented, and Friend’s study of the Global Extra Neutral Alcohol. It was also used to obtain key information about major players, market classification and segmentation according to the industry trends, geographical markets, and developments related to the market and technology perspectives. For this study, analysts have gathered information from various credible sources, such as annual reports, sec filings, journals, white papers, SOFT presentations, and company web sites.
Market Size Estimation
Both, top-down and bottom-up approaches were used to estimate and validate the size of the Global market and to estimate the size of various other dependent submarkets in the overall Extra Neutral Alcohol. The key players in the market were identified through secondary research and their market contributions in the respective geographies were determined through primary and secondary research.
Forecast Model
![research-methodology2]()