Postal Automation System Market Overview
A postal automation system is a smart solution for efficient parcel sorting and timely delivery of mail from the sender to the receiver. Mail sorting systems, package sorting systems, postal software, and automatic reading and coding systems are all examples of postal automation systems. The global Postal Automation System market is expected to rise at a considerable rate in the forthcoming years.
The global market for postal automation systems is primarily driven by the growing need for parcel delivery and automated sorting in the postal industry. This is because the traditional postal system has various drawbacks, including human error, longer processing times, and more labor requirements. Additionally, during the projected period, the rising need for industrial automation is expected to enhance the demand for postal automation systems around the world. Furthermore, the global demand for postal automation systems is being propelled by the rise of the e-commerce industry and rising labor expenses. In addition, an increase in the volume of parcels and packages is a major driver of the global postal automation systems market. Another significant reason expected to drive demand for postal automation systems globally in the forthcoming years is an increase in end-user desire for faster parcel delivery.
However, the global market is constrained by high maintenance costs, dwindling volumes of traditional mail, and operational and design issues. The evolution of the IoPT (Internet of Postal Things), on the other hand, is a prominent driver that is predicted to provide profitable chances for the industry in the coming years.
| Report Metric |
Details |
| Market size available for years |
2023–2030 |
| Base year considered |
2023 |
| Forecast period |
2024–2030 |
| Forecast unit |
Value (USD Million) |
| Segments covered |
Component, Product, Technology, Application, and Region |
| Regions covered |
North America (the U.S. and Canada), Europe (UK, Germany, France, Italy, Spain, Russia, Rest of Europe), Asia-Pacific (China, India, Japan, Australia, South East Asia, Rest of Asia Pacific), Latin America and the Middle East and Africa (Brazil, Saudi Arabia, UAE, Rest of LAMEA) |
| Companies covered |
Siemens AG, Toshiba Corporation, NEC Corporation, Pitney Bowes India Private Limited, Solystic SAS, Vanderlande Industries B.V., Fives Group, Leonardo S.p.A., Lockheed Martin Corporation, Beumer Group. |
COVID-19 Impact on Postal Automation System Market
Like many other industries, COVID-19 badly knocked the electronics and semiconductor industries. This unprecedented event has impacted nearly 230 countries in just a few weeks, resulting in the forced shutdown of manufacturing and transportation activities within and across the countries. This has directly affected the overall sector's growth. It is estimated that COVID-19 will leave more than USD 30 billion impacts on the electronics and semiconductor industry. The sector is majorly affected by transport restrictions on major electronics and semiconductor raw material providers. However, the emerging need for semiconductors in several industries will offer rapid market recovery over the future period.
Postal Automation System Market Segment Overview
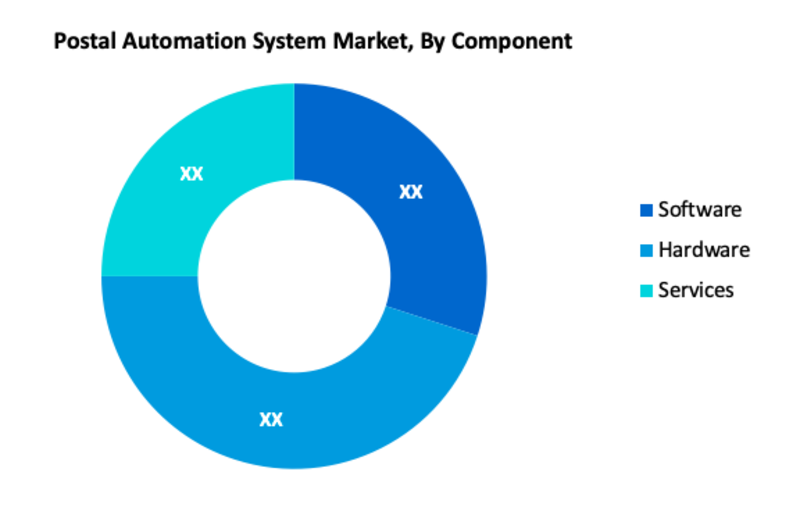
According to Component, Hardware is the most prominent segment in the global Postal Automation System market. New system installations for capacity expansion and updates in sensors, processors, scanners, and recognition systems can be ascribed to hardware's leadership position in terms of market size. These hardware systems, on the other hand, necessitate routine maintenance as well as hardware and software upgrades. Automation equipment manufacturers and postal operators establish high-value contracts for after-sales services. As a result, the services market is predicted to develop at the fastest rate over the forecast period.
Postal Automation System Market, By Component
- Software
- Hardware
- Services
- Maintenance & Repair
- Training & Consulting
- Software Upgrades & Technical Support
Postal Automation System Market, By Product
· Mail Sorting Systems
· Parcel Sorting Systems
· Postal and Parcel Software
· Automatic Reading and Coding Systems
Postal Automation System Market, By Technology
· Letter Sorters
· Culler Facer Cancellers
· Mixed Mail Sorters
· Parcel Sorters
· Flat Sorters
Postal Automation System Market, By Application
· Express
· Courier & Parcel
· Government Postal
Postal Automation System Market Regional Overview
In terms of region, the market in North America is expected to enlarge at a considerable growth rate in the forecast period. This is mainly owing to the presence of key CEP and postal companies in the region. Further, the market in the Asia Pacific is anticipated to increase significantly in the forecast period. The region is projected to offer noteworthy opportunities to the postal automation systems market in the coming years. Growth of the e-commerce industry in China, Japan, and India and technological advancements in the postal & parcel automation industry is boosting the demand for postal automation systems in the Asia Pacific. As a result, the region is seeing a surge in the deployment of postal automation systems.
Postal Automation System Market, By Geography
· North America (US & Canada)
· Europe (UK, Germany, France, Italy, Spain, Russia & Rest of Europe)
· Asia-Pacific (Japan, China, India, Australia, & South Korea, & Rest of Asia-Pacific)
· LAMEA (Brazil, Saudi Arabia, UAE & Rest of LAMEA)
Postal Automation System Market, Key Players
· Siemens AG
· Toshiba Corporation
· NEC Corporation
· Pitney Bowes India Private Limited
· Solystic SAS
· Vanderlande Industries B.V.
· Fives Group
· Leonardo S.p.A.
· Lockheed Martin Corporation
· Beumer Group
Frequently Asked Questions (FAQ) :
Q1. What is the total CAGR expected to be recorded for the Postal Automation System market during the forecast period?
The Postal Automation System market is expected to record a CAGR of ~ 7 % during the forecast period.
Q2. What are the driving factors for the Postal Automation System market?
The global market for postal automation systems is primarily driven by the growing need for parcel delivery and automated sorting in the postal industry
Q3. Which segment is projected to hold the largest share in the Postal Automation System Market?
Hardware segment is projected to hold the largest share in the Postal Automation System Market.
Q4. Which region is holds largest share in the Postal Automation System market?
North America held largest share in the global Postal Automation System market
Q5. Which are the prominent players in the Postal Automation System Market?
Siemens AG, Toshiba Corporation, NEC Corporation, Pitney Bowes India Private Limited, Solystic SAS, Vanderlande Industries B.V., Fives Group, Leonardo S.p.A., Lockheed Martin Corporation, Beumer Group. are some key players in the Postal Automation System Market.
List of Figures
Figure 1: Global Postal Automation System Market Revenue Breakdown (USD Billion, %) by Region, 2019 & 2027
Figure 2: Global Postal Automation System Market Value Share (%), By Segment 1, 2019 & 2027
Figure 3: Global Postal Automation System Market Forecast (USD Billion), by Sub-Segment 1, 2016-2027
Figure 4: Global Postal Automation System Market Forecast (USD Billion), by Sub-Segment 2, 2016-2027
Figure 5: Global Postal Automation System Market Value Share (%), By Segment 2, 2019 & 2027
Figure 6: Global Postal Automation System Market Forecast (USD Billion), by Sub-Segment 1, 2016-2027
Figure 7: Global Postal Automation System Market Forecast (USD Billion), by Sub-Segment 2, 2016-2027
Figure 8: Global Postal Automation System Market Forecast (USD Billion), by Sub-Segment 3, 2016-2027
Figure 9: Global Postal Automation System Market Forecast (USD Billion), by Others, 2016-2027
Figure 10: Global Postal Automation System Market Value Share (%), By Segment 3, 2019 & 2027
Figure 11: Global Postal Automation System Market Forecast (USD Billion), by Sub-Segment 1, 2016-2027
Figure 12: Global Postal Automation System Market Forecast (USD Billion), by Sub-Segment 2, 2016-2027
Figure 13: Global Postal Automation System Market Forecast (USD Billion), by Sub-Segment 3, 2016-2027
Figure 14: Global Postal Automation System Market Forecast (USD Billion), by Others, 2016-2027
Figure 15: Global Postal Automation System Market Value (USD Billion), by Region, 2019 & 2027
Figure 16: North America Postal Automation System Market Value Share (%), By Segment 1, 2019 & 2027
Figure 17: North America Postal Automation System Market Forecast (USD Billion), by Sub-Segment 1, 2016-2027
Figure 18: North America Postal Automation System Market Forecast (USD Billion), by Sub-Segment 2, 2016-2027
Figure 19: North America Postal Automation System Market Value Share (%), By Segment 2, 2019 & 2027
Figure 20: North America Postal Automation System Market Forecast (USD Billion), by Sub-Segment 1, 2016-2027
Figure 21: North America Postal Automation System Market Forecast (USD Billion), by Sub-Segment 2, 2016-2027
Figure 22: North America Postal Automation System Market Forecast (USD Billion), by Sub-Segment 3, 2016-2027
Figure 23: North America Postal Automation System Market Forecast (USD Billion), by Others, 2016-2027
Figure 24: North America Postal Automation System Market Value Share (%), By Segment 3, 2019 & 2027
Figure 25: North America Postal Automation System Market Forecast (USD Billion), by Sub-Segment 1, 2016-2027
Figure 26: North America Postal Automation System Market Forecast (USD Billion), by Sub-Segment 2, 2016-2027
Figure 27: North America Postal Automation System Market Forecast (USD Billion), by Sub-Segment 3, 2016-2027
Figure 28: North America Postal Automation System Market Forecast (USD Billion), by Others, 2016-2027
Figure 29: North America Postal Automation System Market Forecast (USD Billion), by U.S., 2016-2027
Figure 30: North America Postal Automation System Market Forecast (USD Billion), by Canada, 2016-2027
Figure 31: Latin America Postal Automation System Market Value Share (%), By Segment 1, 2019 & 2027
Figure 32: Latin America Postal Automation System Market Forecast (USD Billion), by Sub-Segment 1, 2016-2027
Figure 33: Latin America Postal Automation System Market Forecast (USD Billion), by Sub-Segment 2, 2016-2027
Figure 34: Latin America Postal Automation System Market Value Share (%), By Segment 2, 2019 & 2027
Figure 35: Latin America Postal Automation System Market Forecast (USD Billion), by Sub-Segment 1, 2016-2027
Figure 36: Latin America Postal Automation System Market Forecast (USD Billion), by Sub-Segment 2, 2016-2027
Figure 37: Latin America Postal Automation System Market Forecast (USD Billion), by Sub-Segment 3, 2016-2027
Figure 38: Latin America Postal Automation System Market Forecast (USD Billion), by Others, 2016-2027
Figure 39: Latin America Postal Automation System Market Value Share (%), By Segment 3, 2019 & 2027
Figure 40: Latin America Postal Automation System Market Forecast (USD Billion), by Sub-Segment 1, 2016-2027
Figure 41: Latin America Postal Automation System Market Forecast (USD Billion), by Sub-Segment 2, 2016-2027
Figure 42: Latin America Postal Automation System Market Forecast (USD Billion), by Sub-Segment 3, 2016-2027
Figure 43: Latin America Postal Automation System Market Forecast (USD Billion), by Others, 2016-2027
Figure 44: Latin America Postal Automation System Market Forecast (USD Billion), by Brazil, 2016-2027
Figure 45: Latin America Postal Automation System Market Forecast (USD Billion), by Mexico, 2016-2027
Figure 46: Latin America Postal Automation System Market Forecast (USD Billion), by Rest of Latin America, 2016-2027
Figure 47: Europe Postal Automation System Market Value Share (%), By Segment 1, 2019 & 2027
Figure 48: Europe Postal Automation System Market Forecast (USD Billion), by Sub-Segment 1, 2016-2027
Figure 49: Europe Postal Automation System Market Forecast (USD Billion), by Sub-Segment 2, 2016-2027
Figure 50: Europe Postal Automation System Market Value Share (%), By Segment 2, 2019 & 2027
Figure 51: Europe Postal Automation System Market Forecast (USD Billion), by Sub-Segment 1, 2016-2027
Figure 52: Europe Postal Automation System Market Forecast (USD Billion), by Sub-Segment 2, 2016-2027
Figure 53: Europe Postal Automation System Market Forecast (USD Billion), by Sub-Segment 3, 2016-2027
Figure 54: Europe Postal Automation System Market Forecast (USD Billion), by Others, 2016-2027
Figure 55: Europe Postal Automation System Market Value Share (%), By Segment 3, 2019 & 2027
Figure 56: Europe Postal Automation System Market Forecast (USD Billion), by Sub-Segment 1, 2016-2027
Figure 57: Europe Postal Automation System Market Forecast (USD Billion), by Sub-Segment 2, 2016-2027
Figure 58: Europe Postal Automation System Market Forecast (USD Billion), by Sub-Segment 3, 2016-2027
Figure 59: Europe Postal Automation System Market Forecast (USD Billion), by Others, 2016-2027
Figure 60: Europe Postal Automation System Market Forecast (USD Billion), by U.K., 2016-2027
Figure 61: Europe Postal Automation System Market Forecast (USD Billion), by Germany, 2016-2027
Figure 62: Europe Postal Automation System Market Forecast (USD Billion), by France, 2016-2027
Figure 63: Europe Postal Automation System Market Forecast (USD Billion), by Italy, 2016-2027
Figure 64: Europe Postal Automation System Market Forecast (USD Billion), by Spain, 2016-2027
Figure 65: Europe Postal Automation System Market Forecast (USD Billion), by Russia, 2016-2027
Figure 66: Europe Postal Automation System Market Forecast (USD Billion), by Rest of Europe, 2016-2027
Figure 67: Asia Pacific Postal Automation System Market Value Share (%), By Segment 1, 2019 & 2027
Figure 68: Asia Pacific Postal Automation System Market Forecast (USD Billion), by Sub-Segment 1, 2016-2027
Figure 69: Asia Pacific Postal Automation System Market Forecast (USD Billion), by Sub-Segment 2, 2016-2027
Figure 70: Asia Pacific Postal Automation System Market Value Share (%), By Segment 2, 2019 & 2027
Figure 71: Asia Pacific Postal Automation System Market Forecast (USD Billion), by Sub-Segment 1, 2016-2027
Figure 72: Asia Pacific Postal Automation System Market Forecast (USD Billion), by Sub-Segment 2, 2016-2027
Figure 73: Asia Pacific Postal Automation System Market Forecast (USD Billion), by Sub-Segment 3, 2016-2027
Figure 74: Asia Pacific Postal Automation System Market Forecast (USD Billion), by Others, 2016-2027
Figure 75: Asia Pacific Postal Automation System Market Value Share (%), By Segment 3, 2019 & 2027
Figure 76: Asia Pacific Postal Automation System Market Forecast (USD Billion), by Sub-Segment 1, 2016-2027
Figure 77: Asia Pacific Postal Automation System Market Forecast (USD Billion), by Sub-Segment 2, 2016-2027
Figure 78: Asia Pacific Postal Automation System Market Forecast (USD Billion), by Sub-Segment 3, 2016-2027
Figure 79: Asia Pacific Postal Automation System Market Forecast (USD Billion), by Others, 2016-2027
Figure 80: Asia Pacific Postal Automation System Market Forecast (USD Billion), by China, 2016-2027
Figure 81: Asia Pacific Postal Automation System Market Forecast (USD Billion), by India, 2016-2027
Figure 82: Asia Pacific Postal Automation System Market Forecast (USD Billion), by Japan, 2016-2027
Figure 83: Asia Pacific Postal Automation System Market Forecast (USD Billion), by Australia, 2016-2027
Figure 84: Asia Pacific Postal Automation System Market Forecast (USD Billion), by Southeast Asia, 2016-2027
Figure 85: Asia Pacific Postal Automation System Market Forecast (USD Billion), by Rest of Asia Pacific, 2016-2027
Figure 86: Middle East & Africa Postal Automation System Market Value Share (%), By Segment 1, 2019 & 2027
Figure 87: Middle East & Africa Postal Automation System Market Forecast (USD Billion), by Sub-Segment 1, 2016-2027
Figure 88: Middle East & Africa Postal Automation System Market Forecast (USD Billion), by Sub-Segment 2, 2016-2027
Figure 89: Middle East & Africa Postal Automation System Market Value Share (%), By Segment 2, 2019 & 2027
Figure 90: Middle East & Africa Postal Automation System Market Forecast (USD Billion), by Sub-Segment 1, 2016-2027
Figure 91: Middle East & Africa Postal Automation System Market Forecast (USD Billion), by Sub-Segment 2, 2016-2027
Figure 92: Middle East & Africa Postal Automation System Market Forecast (USD Billion), by Sub-Segment 3, 2016-2027
Figure 93: Middle East & Africa Postal Automation System Market Forecast (USD Billion), by Others, 2016-2027
Figure 94: Middle East & Africa Postal Automation System Market Value Share (%), By Segment 3, 2019 & 2027
Figure 95: Middle East & Africa Postal Automation System Market Forecast (USD Billion), by Sub-Segment 1, 2016-2027
Figure 96: Middle East & Africa Postal Automation System Market Forecast (USD Billion), by Sub-Segment 2, 2016-2027
Figure 97: Middle East & Africa Postal Automation System Market Forecast (USD Billion), by Sub-Segment 3, 2016-2027
Figure 98: Middle East & Africa Postal Automation System Market Forecast (USD Billion), by Others, 2016-2027
Figure 99: Middle East & Africa Postal Automation System Market Forecast (USD Billion), by GCC, 2016-2027
Figure 100: Middle East & Africa Postal Automation System Market Forecast (USD Billion), by South Africa, 2016-2027
Figure 101: Middle East & Africa Postal Automation System Market Forecast (USD Billion), by Rest of Middle East & Africa, 2016-2027
List of Tables
Table 1: Global Postal Automation System Market Revenue (USD Billion) Forecast, by Segment 1, 2016-2027
Table 2: Global Postal Automation System Market Revenue (USD Billion) Forecast, by Segment 2, 2016-2027
Table 3: Global Postal Automation System Market Revenue (USD Billion) Forecast, by Segment 3, 2016-2027
Table 4: Global Postal Automation System Market Revenue (USD Billion) Forecast, by Region, 2016-2027
Table 5: North America Postal Automation System Market Revenue (USD Billion) Forecast, by Segment 1, 2016-2027
Table 6: North America Postal Automation System Market Revenue (USD Billion) Forecast, by Segment 2, 2016-2027
Table 7: North America Postal Automation System Market Revenue (USD Billion) Forecast, by Segment 3, 2016-2027
Table 8: North America Postal Automation System Market Revenue (USD Billion) Forecast, by Country, 2016-2027
Table 9: Europe Postal Automation System Market Revenue (USD Billion) Forecast, by Segment 1, 2016-2027
Table 10: Europe Postal Automation System Market Revenue (USD Billion) Forecast, by Segment 2, 2016-2027
Table 11: Europe Postal Automation System Market Revenue (USD Billion) Forecast, by Segment 3, 2016-2027
Table 12: Europe Postal Automation System Market Revenue (USD Billion) Forecast, by Country, 2016-2027
Table 13: Latin America Postal Automation System Market Revenue (USD Billion) Forecast, by Segment 1, 2016-2027
Table 14: Latin America Postal Automation System Market Revenue (USD Billion) Forecast, by Segment 2, 2016-2027
Table 15: Latin America Postal Automation System Market Revenue (USD Billion) Forecast, by Segment 3, 2016-2027
Table 16: Latin America Postal Automation System Market Revenue (USD Billion) Forecast, by Country, 2016-2027
Table 17: Asia Pacific Postal Automation System Market Revenue (USD Billion) Forecast, by Segment 1, 2016-2027
Table 18: Asia Pacific Postal Automation System Market Revenue (USD Billion) Forecast, by Segment 2, 2016-2027
Table 19: Asia Pacific Postal Automation System Market Revenue (USD Billion) Forecast, by Segment 3, 2016-2027
Table 20: Asia Pacific Postal Automation System Market Revenue (USD Billion) Forecast, by Country, 2016-2027
Table 21: Middle East & Africa Postal Automation System Market Revenue (USD Billion) Forecast, by Segment 1, 2016-2027
Table 22: Middle East & Africa Postal Automation System Market Revenue (USD Billion) Forecast, by Segment 2, 2016-2027
Table 23: Middle East & Africa Postal Automation System Market Revenue (USD Billion) Forecast, by Segment 3, 2016-2027
Table 24: Middle East & Africa Postal Automation System Market Revenue (USD Billion) Forecast, by Country, 2016-2027
Research Process
Data Library Research are conducted by industry experts who offer insight on
industry structure, market segmentations technology assessment and competitive landscape (CL), and penetration, as well as on emerging trends. Their analysis is based on primary interviews (~ 80%) and secondary research (~ 20%) as well as years of professional expertise in their respective industries. Adding to this, by analysing historical trends and current market positions, our analysts predict where the market will be headed for the next five years. Furthermore, the varying trends of segment & categories geographically presented are also studied and the estimated based on the primary & secondary research.
In this particular report from the supply side Data Library Research has conducted primary surveys (interviews) with the key level executives (VP, CEO’s, Marketing Director, Business Development Manager
and SOFT) of the companies that active & prominent as well as the midsized organization
FIGURE 1: DLR RESEARH PROCESS
![research-methodology1]()
Primary Research
Extensive primary research was conducted to gain a deeper insight of the market and industry performance. The analysis is based on both primary and secondary research as well as years of professional expertise in the respective industries.
In addition to analysing current and historical trends, our analysts predict where the market is headed over the next five years.
It varies by segment for these categories geographically presented in the list of market tables. Speaking about this particular report we have conducted primary surveys (interviews) with the key level executives (VP, CEO’s, Marketing Director, Business Development Manager and many more) of the major players active in the market.
Secondary Research
Secondary research was mainly used to collect and identify information useful for the extensive, technical, market-oriented, and Friend’s study of the Global Extra Neutral Alcohol. It was also used to obtain key information about major players, market classification and segmentation according to the industry trends, geographical markets, and developments related to the market and technology perspectives. For this study, analysts have gathered information from various credible sources, such as annual reports, sec filings, journals, white papers, SOFT presentations, and company web sites.
Market Size Estimation
Both, top-down and bottom-up approaches were used to estimate and validate the size of the Global market and to estimate the size of various other dependent submarkets in the overall Extra Neutral Alcohol. The key players in the market were identified through secondary research and their market contributions in the respective geographies were determined through primary and secondary research.
Forecast Model
![research-methodology2]()