Power Generation Equipment Rental Service Market Overview and Analysis:
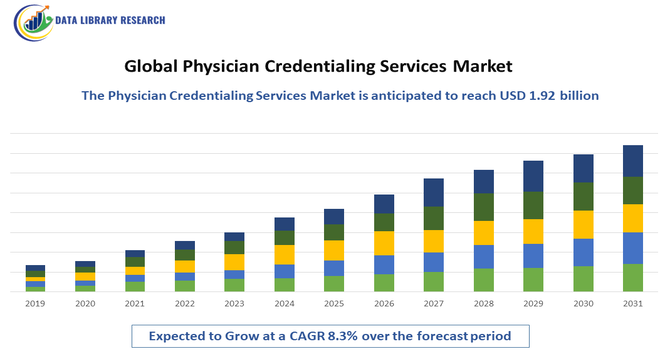
- The market is forecast to expand at a steady rate, with a CAGR generally ranging from 6.25% to 7.4% over the forecast period.
Get Complete Analysis Of The Report - Download Updated Free Sample PDF
The Global Power Generation Equipment Rental Service Market is experiencing strong growth driven by rising demand for flexible, cost-effective, and rapid power solutions across industrial, commercial, and infrastructure sectors. Increasing construction activities, expanding mining operations, and the need for reliable temporary power during grid outages or maintenance are major contributors to market expansion. Businesses and project developers prefer rental power equipment to avoid high upfront capital expenditure, reduce maintenance responsibilities, and ensure operational continuity. Additionally, the growing frequency of natural disasters, climate-related disruptions, and unstable power supply in developing regions are boosting the adoption of rental generators and related power systems. Technological advancements, such as fuel-efficient generators, hybrid power systems, and remote monitoring solutions, further enhance reliability and operational efficiency, strengthening market growth. Overall, the shift toward scalable, on-demand energy solutions positions the power generation equipment rental service market for sustained expansion in the coming years.
Power Generation Equipment Rental Service Market Latest Trends:
The global power generation equipment rental service market is being reshaped by several important trends. Rental providers are aggressively adopting hybrid and battery-powered generator systems, combining traditional diesel or gas units with energy storage to lower emissions, fuel costs, and noise. There’s also a strong shift toward IoT-enabled and AI-driven remote monitoring, enabling real-time performance tracking and predictive maintenance to reduce downtime and improve fleet utilization. Rental companies increasingly use automated fleet management systems powered by AI to forecast demand spikes and dynamically allocate generator resources. Environmental regulations are pushing gas-fueled and low-NOₓ generators into the spotlight, particularly for standby power applications in telecom, data centers, and critical infrastructure. Mega-projects and infrastructure redevelopment are driving demand for mobile and temporary power solutions in remote or off-grid areas, especially in emerging markets. Finally, fleet expansion through consolidation and acquisitions is gaining steam, as rental firms aim to scale their power rental capacity and cross-sell services (e.g., with HVAC) to better serve large construction and industrial customers.
Segmentation: Global Power Generation Equipment Rental Service Market is segmented By equipment type (diesel generators, gas generators, hybrid generators, load banks, transformers, distribution panels), By Power Rating (75 kVA, 75–375 kVA, 375–750 kVA), By Application (continuous power, standby power, and peak shaving), By End User (construction, mining, oil & gas, utilities, manufacturing, telecom, events, and data centers), and Geography (North America, Europe, Asia-Pacific, Middle East and Africa, and South America). The report provides the value (in USD million) for the above segments.
For Detailed Market Segmentation - Get a Free Sample PDF
Market Drivers:
- Rising Demand for Temporary and Reliable Power Solutions Across Industrial and Construction Sectors
One of the primary drivers of the Global Power Generation Equipment Rental Service Market is the increasing need for reliable temporary power across construction sites, mining operations, oil & gas projects, and large-scale infrastructure developments. These industries often operate in remote or undeveloped locations where grid connectivity is either weak or unavailable, making rented generators and associated power equipment essential for maintaining operational continuity. Construction companies rely heavily on rental generators to power tools, lighting, and site operations without incurring high capital costs. Mining and oil & gas sectors require heavy-duty, mobile, and scalable power solutions for drilling, extraction, and processing activities. Renting power equipment enables businesses to address variable project timelines, fluctuating power needs, and maintenance requirements without long-term ownership burdens. As industrialization accelerates in emerging economies and governments invest heavily in infrastructure modernization, the demand for flexible, on-demand power rental services continues to grow.
- Increasing Grid Instability, Natural Disasters, and Emergency Power Requirements
Growing grid instability caused by aging infrastructure, rising electricity consumption, and climate-induced events is significantly boosting the demand for rental power generation equipment. Frequent power outages, voltage fluctuations, and natural disasters such as hurricanes, floods, and wildfires disrupt power supply and necessitate fast-deployment temporary power systems. Rental generators, transformers, and load banks are widely used during disaster recovery efforts to restore electricity to hospitals, emergency shelters, utilities, and communication networks. In many regions, especially developing economies, inconsistent power grids force businesses to adopt standby rental power systems to avoid operational disruptions and revenue losses. Furthermore, increasing adoption of renewable energy sources, such as solar and wind, introduces intermittency challenges, prompting industries to rent backup power for peak shaving and load balancing. This growing reliance on emergency and supplementary power solutions significantly drives the market forward.
Market Restraints
The Global Power Generation Equipment Rental Service Market faces several restraints that can limit its overall growth despite rising demand. One major challenge is the high operating and maintenance costs associated with rental generators, especially diesel-based units, which require regular servicing, fuel management, and compliance with emission standards. These costs can discourage small contractors or event operators from relying on rented power solutions. Additionally, strict environmental regulations targeting emissions and noise pollution are tightening across regions, pushing rental companies to upgrade or replace older fleets, increasing capital expenditure and reducing profit margins. The volatility in fuel prices further complicates operational budgeting for both rental providers and end users. Moreover, the increasing adoption of renewable energy installations and energy storage systems is reducing reliance on traditional generator rentals in certain applications. Logistical challenges, particularly in deploying large generators to remote or difficult terrains, can delay projects and escalate transportation costs. The presence of locally operated, low-cost rental providers also intensifies price competition, affecting margins for established players. Taken together, these factors create financial, regulatory, and operational hurdles that restrain market expansion.
Segmental Analysis:
- Global Power Generation Equipment Rental Service segment is expected to witness the highest growth over the forecast period
The Global Power Generation Equipment Rental Service segment is expected to witness the highest growth over the forecast period, supported by rising industrial activity, expanding infrastructure projects, and the growing need for flexible temporary power solutions. Increasing grid instability, frequent outages, and the preference for cost-efficient rental models over high-capex equipment ownership are further accelerating adoption across sectors such as construction, mining, oil & gas, and events. Additionally, advancements in fuel-efficient and hybrid generator technologies are enhancing reliability and operational efficiency, reinforcing strong market expansion in the coming years.
- Diesel Generators segment is expected to witness the highest growth over the forecast period
Diesel generators represent the most dominant segment in the equipment type category due to their rugged performance, high power output, and ability to operate efficiently in remote and demanding environments. They are widely used across construction sites, mining areas, oilfields, and emergency response operations where a consistent and reliable power source is critical. Their relatively simple maintenance, fuel availability, and cost-effectiveness further strengthen their position in the rental market.
- 75–375 kVA segment is expected to witness the highest growth over the forecast period
The 75–375 kVA power rating segment is one of the most widely rented categories as it serves the power needs of medium-sized construction projects, industrial operations, commercial facilities, and event setups. This range offers an ideal balance of portability and output capacity, making it suitable for temporary applications that require dependable power without the complexity of large-scale units. Its versatility drives strong demand across diverse end-use sectors.
- Standby Power segment is expected to witness the highest growth over the forecast period
Standby power is a key application segment, driven by the increasing need for backup power during unexpected grid outages, maintenance shutdowns, or voltage fluctuations. Businesses, data centers, hospitals, and telecom towers rely on standby rental generators to maintain critical operations and avoid downtime. The rise in natural disasters, grid instability, and infrastructure aging across several regions has significantly boosted reliance on rental standby power systems.
- Construction segment is expected to witness the highest growth over the forecast period
The construction sector represents a major end-user segment due to its continuous requirement for mobile and temporary power at job sites. From operating heavy machinery and lighting to powering temporary offices and safety systems, rental generators are essential throughout the project lifecycle. Construction activities in developing regions, infrastructure upgrades, and mega-projects accelerate the demand for flexible, short-term power rental solutions.
- North America region is expected to witness the highest growth over the forecast period
North America is expected to witness the highest growth in the Power Generation Equipment Rental Service Market over the forecast period, driven by rising demand for temporary and reliable power solutions across construction, oil & gas, utilities, and data center sectors. The region’s frequent weather-related power outages, aging grid infrastructure, and increased adoption of large-scale industrial projects are further accelerating the need for rented generators, transformers, and hybrid power systems. Additionally, the rapid expansion of renewable energy projects and the surge in commercial events and infrastructure upgrades continue to boost rental service penetration. Strong presence of leading rental service providers, technological advancements in fleet management, and the shift toward cleaner gas-based and hybrid generator rentals further reinforce North America’s dominant growth outlook in the global market.
To Learn More About This Report - Request a Free Sample Copy
Power Generation Equipment Rental Service Market Competitive Landscape
The competitive landscape of the Global Power Generation Equipment Rental Service Market is fragmented and highly dynamic, featuring a mix of large multinational rental specialists, original equipment manufacturers offering rental fleets, and regional/local providers. Leading firms compete on fleet size and diversity (diesel, gas, hybrid, and battery systems), rapid deployment capabilities, uptime/service quality, and advanced value-added services such as remote monitoring, predictive maintenance, and turnkey power solutions. Consolidation through acquisitions, strategic partnerships with EPC contractors, and investments in low-emission and hybrid fleets are common strategies as companies respond to stricter emissions standards and customer demand for cleaner, more efficient temporary power.
Key Players:
- Aggreko
- Caterpillar
- Cummins Inc.
- APR Energy
- United Rentals
- Ashtead Group (Sunbelt Rentals)
- HSS Hire
- Atlas Copco
- Kohler Co.
- Generac Power Systems
- Kirloskar Oil Engines
- SDMO Industries (Kohler Group)
- Doosan Portable Power
- Volvo Penta
- MAN Energy Solutions
- Siemens Energy
- Wärtsilä
- Pramac
- Power Solutions International (PSI)
- MCM (Mobile Critical Mobile Power)
List of Figures
Figure 1: Global Power Generation Equipment Rental Service Market Revenue Breakdown (USD Billion, %) by Region, 2022 & 2029
Figure 2: Global Power Generation Equipment Rental Service Market Value Share (%), By Segment 1, 2022 & 2029
Figure 3: Global Power Generation Equipment Rental Service Market Forecast (USD Billion), by Sub-Segment 1, 2018-2029
Figure 4: Global Power Generation Equipment Rental Service Market Forecast (USD Billion), by Sub-Segment 2, 2018-2029
Figure 5: Global Power Generation Equipment Rental Service Market Value Share (%), By Segment 2, 2022 & 2029
Figure 6: Global Power Generation Equipment Rental Service Market Forecast (USD Billion), by Sub-Segment 1, 2018-2029
Figure 7: Global Power Generation Equipment Rental Service Market Forecast (USD Billion), by Sub-Segment 2, 2018-2029
Figure 8: Global Power Generation Equipment Rental Service Market Forecast (USD Billion), by Sub-Segment 3, 2018-2029
Figure 9: Global Power Generation Equipment Rental Service Market Forecast (USD Billion), by Others, 2018-2029
Figure 10: Global Power Generation Equipment Rental Service Market Value Share (%), By Segment 3, 2022 & 2029
Figure 11: Global Power Generation Equipment Rental Service Market Forecast (USD Billion), by Sub-Segment 1, 2018-2029
Figure 12: Global Power Generation Equipment Rental Service Market Forecast (USD Billion), by Sub-Segment 2, 2018-2029
Figure 13: Global Power Generation Equipment Rental Service Market Forecast (USD Billion), by Sub-Segment 3, 2018-2029
Figure 14: Global Power Generation Equipment Rental Service Market Forecast (USD Billion), by Others, 2018-2029
Figure 15: Global Power Generation Equipment Rental Service Market Value (USD Billion), by Region, 2022 & 2029
Figure 16: North America Power Generation Equipment Rental Service Market Value Share (%), By Segment 1, 2022 & 2029
Figure 17: North America Power Generation Equipment Rental Service Market Forecast (USD Billion), by Sub-Segment 1, 2018-2029
Figure 18: North America Power Generation Equipment Rental Service Market Forecast (USD Billion), by Sub-Segment 2, 2018-2029
Figure 19: North America Power Generation Equipment Rental Service Market Value Share (%), By Segment 2, 2022 & 2029
Figure 20: North America Power Generation Equipment Rental Service Market Forecast (USD Billion), by Sub-Segment 1, 2018-2029
Figure 21: North America Power Generation Equipment Rental Service Market Forecast (USD Billion), by Sub-Segment 2, 2018-2029
Figure 22: North America Power Generation Equipment Rental Service Market Forecast (USD Billion), by Sub-Segment 3, 2018-2029
Figure 23: North America Power Generation Equipment Rental Service Market Forecast (USD Billion), by Others, 2018-2029
Figure 24: North America Power Generation Equipment Rental Service Market Value Share (%), By Segment 3, 2022 & 2029
Figure 25: North America Power Generation Equipment Rental Service Market Forecast (USD Billion), by Sub-Segment 1, 2018-2029
Figure 26: North America Power Generation Equipment Rental Service Market Forecast (USD Billion), by Sub-Segment 2, 2018-2029
Figure 27: North America Power Generation Equipment Rental Service Market Forecast (USD Billion), by Sub-Segment 3, 2018-2029
Figure 28: North America Power Generation Equipment Rental Service Market Forecast (USD Billion), by Others, 2018-2029
Figure 29: North America Power Generation Equipment Rental Service Market Forecast (USD Billion), by U.S., 2018-2029
Figure 30: North America Power Generation Equipment Rental Service Market Forecast (USD Billion), by Canada, 2018-2029
Figure 31: Latin America Power Generation Equipment Rental Service Market Value Share (%), By Segment 1, 2022 & 2029
Figure 32: Latin America Power Generation Equipment Rental Service Market Forecast (USD Billion), by Sub-Segment 1, 2018-2029
Figure 33: Latin America Power Generation Equipment Rental Service Market Forecast (USD Billion), by Sub-Segment 2, 2018-2029
Figure 34: Latin America Power Generation Equipment Rental Service Market Value Share (%), By Segment 2, 2022 & 2029
Figure 35: Latin America Power Generation Equipment Rental Service Market Forecast (USD Billion), by Sub-Segment 1, 2018-2029
Figure 36: Latin America Power Generation Equipment Rental Service Market Forecast (USD Billion), by Sub-Segment 2, 2018-2029
Figure 37: Latin America Power Generation Equipment Rental Service Market Forecast (USD Billion), by Sub-Segment 3, 2018-2029
Figure 38: Latin America Power Generation Equipment Rental Service Market Forecast (USD Billion), by Others, 2018-2029
Figure 39: Latin America Power Generation Equipment Rental Service Market Value Share (%), By Segment 3, 2022 & 2029
Figure 40: Latin America Power Generation Equipment Rental Service Market Forecast (USD Billion), by Sub-Segment 1, 2018-2029
Figure 41: Latin America Power Generation Equipment Rental Service Market Forecast (USD Billion), by Sub-Segment 2, 2018-2029
Figure 42: Latin America Power Generation Equipment Rental Service Market Forecast (USD Billion), by Sub-Segment 3, 2018-2029
Figure 43: Latin America Power Generation Equipment Rental Service Market Forecast (USD Billion), by Others, 2018-2029
Figure 44: Latin America Power Generation Equipment Rental Service Market Forecast (USD Billion), by Brazil, 2018-2029
Figure 45: Latin America Power Generation Equipment Rental Service Market Forecast (USD Billion), by Mexico, 2018-2029
Figure 46: Latin America Power Generation Equipment Rental Service Market Forecast (USD Billion), by Rest of Latin America, 2018-2029
Figure 47: Europe Power Generation Equipment Rental Service Market Value Share (%), By Segment 1, 2022 & 2029
Figure 48: Europe Power Generation Equipment Rental Service Market Forecast (USD Billion), by Sub-Segment 1, 2018-2029
Figure 49: Europe Power Generation Equipment Rental Service Market Forecast (USD Billion), by Sub-Segment 2, 2018-2029
Figure 50: Europe Power Generation Equipment Rental Service Market Value Share (%), By Segment 2, 2022 & 2029
Figure 51: Europe Power Generation Equipment Rental Service Market Forecast (USD Billion), by Sub-Segment 1, 2018-2029
Figure 52: Europe Power Generation Equipment Rental Service Market Forecast (USD Billion), by Sub-Segment 2, 2018-2029
Figure 53: Europe Power Generation Equipment Rental Service Market Forecast (USD Billion), by Sub-Segment 3, 2018-2029
Figure 54: Europe Power Generation Equipment Rental Service Market Forecast (USD Billion), by Others, 2018-2029
Figure 55: Europe Power Generation Equipment Rental Service Market Value Share (%), By Segment 3, 2022 & 2029
Figure 56: Europe Power Generation Equipment Rental Service Market Forecast (USD Billion), by Sub-Segment 1, 2018-2029
Figure 57: Europe Power Generation Equipment Rental Service Market Forecast (USD Billion), by Sub-Segment 2, 2018-2029
Figure 58: Europe Power Generation Equipment Rental Service Market Forecast (USD Billion), by Sub-Segment 3, 2018-2029
Figure 59: Europe Power Generation Equipment Rental Service Market Forecast (USD Billion), by Others, 2018-2029
Figure 60: Europe Power Generation Equipment Rental Service Market Forecast (USD Billion), by U.K., 2018-2029
Figure 61: Europe Power Generation Equipment Rental Service Market Forecast (USD Billion), by Germany, 2018-2029
Figure 62: Europe Power Generation Equipment Rental Service Market Forecast (USD Billion), by France, 2018-2029
Figure 63: Europe Power Generation Equipment Rental Service Market Forecast (USD Billion), by Italy, 2018-2029
Figure 64: Europe Power Generation Equipment Rental Service Market Forecast (USD Billion), by Spain, 2018-2029
Figure 65: Europe Power Generation Equipment Rental Service Market Forecast (USD Billion), by Russia, 2018-2029
Figure 66: Europe Power Generation Equipment Rental Service Market Forecast (USD Billion), by Rest of Europe, 2018-2029
Figure 67: Asia Pacific Power Generation Equipment Rental Service Market Value Share (%), By Segment 1, 2022 & 2029
Figure 68: Asia Pacific Power Generation Equipment Rental Service Market Forecast (USD Billion), by Sub-Segment 1, 2018-2029
Figure 69: Asia Pacific Power Generation Equipment Rental Service Market Forecast (USD Billion), by Sub-Segment 2, 2018-2029
Figure 70: Asia Pacific Power Generation Equipment Rental Service Market Value Share (%), By Segment 2, 2022 & 2029
Figure 71: Asia Pacific Power Generation Equipment Rental Service Market Forecast (USD Billion), by Sub-Segment 1, 2018-2029
Figure 72: Asia Pacific Power Generation Equipment Rental Service Market Forecast (USD Billion), by Sub-Segment 2, 2018-2029
Figure 73: Asia Pacific Power Generation Equipment Rental Service Market Forecast (USD Billion), by Sub-Segment 3, 2018-2029
Figure 74: Asia Pacific Power Generation Equipment Rental Service Market Forecast (USD Billion), by Others, 2018-2029
Figure 75: Asia Pacific Power Generation Equipment Rental Service Market Value Share (%), By Segment 3, 2022 & 2029
Figure 76: Asia Pacific Power Generation Equipment Rental Service Market Forecast (USD Billion), by Sub-Segment 1, 2018-2029
Figure 77: Asia Pacific Power Generation Equipment Rental Service Market Forecast (USD Billion), by Sub-Segment 2, 2018-2029
Figure 78: Asia Pacific Power Generation Equipment Rental Service Market Forecast (USD Billion), by Sub-Segment 3, 2018-2029
Figure 79: Asia Pacific Power Generation Equipment Rental Service Market Forecast (USD Billion), by Others, 2018-2029
Figure 80: Asia Pacific Power Generation Equipment Rental Service Market Forecast (USD Billion), by China, 2018-2029
Figure 81: Asia Pacific Power Generation Equipment Rental Service Market Forecast (USD Billion), by India, 2018-2029
Figure 82: Asia Pacific Power Generation Equipment Rental Service Market Forecast (USD Billion), by Japan, 2018-2029
Figure 83: Asia Pacific Power Generation Equipment Rental Service Market Forecast (USD Billion), by Australia, 2018-2029
Figure 84: Asia Pacific Power Generation Equipment Rental Service Market Forecast (USD Billion), by Southeast Asia, 2018-2029
Figure 85: Asia Pacific Power Generation Equipment Rental Service Market Forecast (USD Billion), by Rest of Asia Pacific, 2018-2029
Figure 86: Middle East & Africa Power Generation Equipment Rental Service Market Value Share (%), By Segment 1, 2022 & 2029
Figure 87: Middle East & Africa Power Generation Equipment Rental Service Market Forecast (USD Billion), by Sub-Segment 1, 2018-2029
Figure 88: Middle East & Africa Power Generation Equipment Rental Service Market Forecast (USD Billion), by Sub-Segment 2, 2018-2029
Figure 89: Middle East & Africa Power Generation Equipment Rental Service Market Value Share (%), By Segment 2, 2022 & 2029
Figure 90: Middle East & Africa Power Generation Equipment Rental Service Market Forecast (USD Billion), by Sub-Segment 1, 2018-2029
Figure 91: Middle East & Africa Power Generation Equipment Rental Service Market Forecast (USD Billion), by Sub-Segment 2, 2018-2029
Figure 92: Middle East & Africa Power Generation Equipment Rental Service Market Forecast (USD Billion), by Sub-Segment 3, 2018-2029
Figure 93: Middle East & Africa Power Generation Equipment Rental Service Market Forecast (USD Billion), by Others, 2018-2029
Figure 94: Middle East & Africa Power Generation Equipment Rental Service Market Value Share (%), By Segment 3, 2022 & 2029
Figure 95: Middle East & Africa Power Generation Equipment Rental Service Market Forecast (USD Billion), by Sub-Segment 1, 2018-2029
Figure 96: Middle East & Africa Power Generation Equipment Rental Service Market Forecast (USD Billion), by Sub-Segment 2, 2018-2029
Figure 97: Middle East & Africa Power Generation Equipment Rental Service Market Forecast (USD Billion), by Sub-Segment 3, 2018-2029
Figure 98: Middle East & Africa Power Generation Equipment Rental Service Market Forecast (USD Billion), by Others, 2018-2029
Figure 99: Middle East & Africa Power Generation Equipment Rental Service Market Forecast (USD Billion), by GCC, 2018-2029
Figure 100: Middle East & Africa Power Generation Equipment Rental Service Market Forecast (USD Billion), by South Africa, 2018-2029
Figure 101: Middle East & Africa Power Generation Equipment Rental Service Market Forecast (USD Billion), by Rest of Middle East & Africa, 2018-2029
List of Tables
Table 1: Global Power Generation Equipment Rental Service Market Revenue (USD Billion) Forecast, by Segment 1, 2018-2029
Table 2: Global Power Generation Equipment Rental Service Market Revenue (USD Billion) Forecast, by Segment 2, 2018-2029
Table 3: Global Power Generation Equipment Rental Service Market Revenue (USD Billion) Forecast, by Segment 3, 2018-2029
Table 4: Global Power Generation Equipment Rental Service Market Revenue (USD Billion) Forecast, by Region, 2018-2029
Table 5: North America Power Generation Equipment Rental Service Market Revenue (USD Billion) Forecast, by Segment 1, 2018-2029
Table 6: North America Power Generation Equipment Rental Service Market Revenue (USD Billion) Forecast, by Segment 2, 2018-2029
Table 7: North America Power Generation Equipment Rental Service Market Revenue (USD Billion) Forecast, by Segment 3, 2018-2029
Table 8: North America Power Generation Equipment Rental Service Market Revenue (USD Billion) Forecast, by Country, 2018-2029
Table 9: Europe Power Generation Equipment Rental Service Market Revenue (USD Billion) Forecast, by Segment 1, 2018-2029
Table 10: Europe Power Generation Equipment Rental Service Market Revenue (USD Billion) Forecast, by Segment 2, 2018-2029
Table 11: Europe Power Generation Equipment Rental Service Market Revenue (USD Billion) Forecast, by Segment 3, 2018-2029
Table 12: Europe Power Generation Equipment Rental Service Market Revenue (USD Billion) Forecast, by Country, 2018-2029
Table 13: Latin America Power Generation Equipment Rental Service Market Revenue (USD Billion) Forecast, by Segment 1, 2018-2029
Table 14: Latin America Power Generation Equipment Rental Service Market Revenue (USD Billion) Forecast, by Segment 2, 2018-2029
Table 15: Latin America Power Generation Equipment Rental Service Market Revenue (USD Billion) Forecast, by Segment 3, 2018-2029
Table 16: Latin America Power Generation Equipment Rental Service Market Revenue (USD Billion) Forecast, by Country, 2018-2029
Table 17: Asia Pacific Power Generation Equipment Rental Service Market Revenue (USD Billion) Forecast, by Segment 1, 2018-2029
Table 18: Asia Pacific Power Generation Equipment Rental Service Market Revenue (USD Billion) Forecast, by Segment 2, 2018-2029
Table 19: Asia Pacific Power Generation Equipment Rental Service Market Revenue (USD Billion) Forecast, by Segment 3, 2018-2029
Table 20: Asia Pacific Power Generation Equipment Rental Service Market Revenue (USD Billion) Forecast, by Country, 2018-2029
Table 21: Middle East & Africa Power Generation Equipment Rental Service Market Revenue (USD Billion) Forecast, by Segment 1, 2018-2029
Table 22: Middle East & Africa Power Generation Equipment Rental Service Market Revenue (USD Billion) Forecast, by Segment 2, 2018-2029
Table 23: Middle East & Africa Power Generation Equipment Rental Service Market Revenue (USD Billion) Forecast, by Segment 3, 2018-2029
Table 24: Middle East & Africa Power Generation Equipment Rental Service Market Revenue (USD Billion) Forecast, by Country, 2018-2029
Research Process
Data Library Research are conducted by industry experts who offer insight on
industry structure, market segmentations technology assessment and competitive landscape (CL), and penetration, as well as on emerging trends. Their analysis is based on primary interviews (~ 80%) and secondary research (~ 20%) as well as years of professional expertise in their respective industries. Adding to this, by analysing historical trends and current market positions, our analysts predict where the market will be headed for the next five years. Furthermore, the varying trends of segment & categories geographically presented are also studied and the estimated based on the primary & secondary research.
In this particular report from the supply side Data Library Research has conducted primary surveys (interviews) with the key level executives (VP, CEO’s, Marketing Director, Business Development Manager
and SOFT) of the companies that active & prominent as well as the midsized organization
FIGURE 1: DLR RESEARH PROCESS
![research-methodology1]()
Primary Research
Extensive primary research was conducted to gain a deeper insight of the market and industry performance. The analysis is based on both primary and secondary research as well as years of professional expertise in the respective industries.
In addition to analysing current and historical trends, our analysts predict where the market is headed over the next five years.
It varies by segment for these categories geographically presented in the list of market tables. Speaking about this particular report we have conducted primary surveys (interviews) with the key level executives (VP, CEO’s, Marketing Director, Business Development Manager and many more) of the major players active in the market.
Secondary Research
Secondary research was mainly used to collect and identify information useful for the extensive, technical, market-oriented, and Friend’s study of the Global Extra Neutral Alcohol. It was also used to obtain key information about major players, market classification and segmentation according to the industry trends, geographical markets, and developments related to the market and technology perspectives. For this study, analysts have gathered information from various credible sources, such as annual reports, sec filings, journals, white papers, SOFT presentations, and company web sites.
Market Size Estimation
Both, top-down and bottom-up approaches were used to estimate and validate the size of the Global market and to estimate the size of various other dependent submarkets in the overall Extra Neutral Alcohol. The key players in the market were identified through secondary research and their market contributions in the respective geographies were determined through primary and secondary research.
Forecast Model
![research-methodology2]()