Recreational Tow Bar Market Overview and Analysis

  • The global recreational tow bar market is expected to reach USD 6.54 billion in 2026 and grow at a CAGR of 4.09% to reach USD 9.84 billion by 2033.

Recreational Tow Bar Market

Get Complete Analysis Of The Report - Download Updated Free Sample PDF

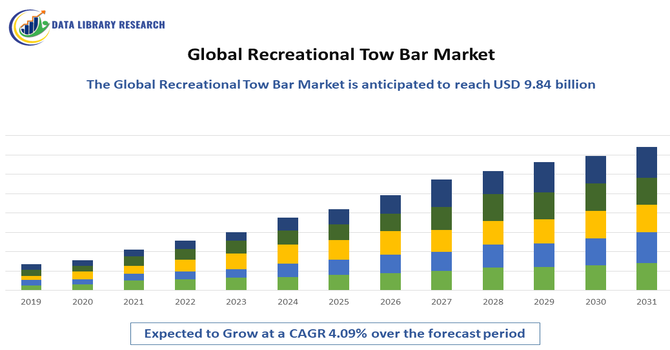
The global recreational tow bar market encompasses the design, manufacture, and sale of towing systems used for recreational vehicles (RVs), trailers, boats, and campers. These systems, including weight distribution hitches, sway control devices, and integrated tow bars, enhance towing safety, stability, and performance. Growth is driven by increasing popularity of RV travel, outdoor recreation, and adventure tourism, alongside rising disposable income and consumer demand for convenience and safety. Technological innovations, such as all-in-one hitches, smart sway control, and durable materials, further boost adoption.

Recreational Tow Bar Market Latest Trends

The global recreational tow bar market is experiencing significant growth due to rising popularity of RV travel, adventure tourism, and outdoor recreational activities. Key trends include the development of all-in-one towing solutions combining weight distribution and sway control for enhanced safety and convenience. Integration of smart technologies, such as electronic sway sensors and lightweight, corrosion-resistant materials, is improving performance and durability. E-commerce and online aftermarket platforms are expanding accessibility, while partnerships between RV manufacturers and tow bar providers streamline product offerings.

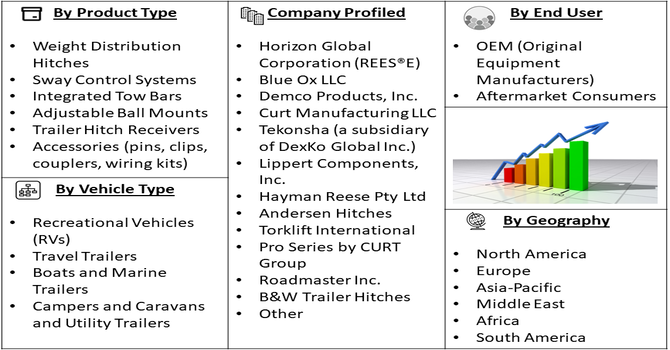
Segmentation: The global recreational tow bar market is segmented by Product Type (Weight Distribution Hitches, Sway Control Systems, Integrated Tow Bars, Adjustable Ball Mounts, Trailer Hitch Receivers and Accessories (pins, clips, couplers, wiring kits)), Vehicle Type (Recreational Vehicles (RVs), Travel Trailers, Boats and Marine Trailers, Campers and Caravans and Utility Trailers), End User (OEM (Original Equipment Manufacturers) and Aftermarket Consumers), Distribution Channel (Offline Retail (Dealerships, Specialty Stores, Supermarkets) and Online Retail / E-Commerce Platforms), and Geography (North America, Europe, Asia-Pacific, Middle East and Africa, and South America). The report provides the value (in USD million) for the above segments.

Recreational Tow Bar Market segment

For Detailed Market Segmentation - Get a Free Sample PDF

Market Drivers:

  • Growing Popularity of RV Travel and Outdoor Recreation

The global recreational tow bar market is driven by the increasing popularity of RV travel, camping, and outdoor recreational activities. Rising disposable incomes, expanding leisure time, and the growing adventure tourism industry have led more consumers to purchase RVs, trailers, and boats, boosting demand for towing solutions. Consumers seek safer and more convenient towing experiences, increasing adoption of weight distribution hitches, sway control systems, and integrated tow bars. Additionally, government support for tourism infrastructure, such as campgrounds and RV parks, further fuels market expansion. This trend ensures continuous growth in both OEM and aftermarket recreational tow bar segments.

  • Technological Advancements in Tow Bar Systems

Technological innovation in tow bar systems is a key driver of market growth. Modern solutions integrate weight distribution, sway control, and electronic monitoring to improve towing stability, safety, and ease of use. Advances in corrosion-resistant materials, lightweight alloys, and modular designs extend product durability and performance.

In 2022, Horizon Global Corporation launched the REESE Dual Cam II, an all-in-one weight distribution and sway control towing solution, enhancing the global recreational tow bar market. The integrated system improved towing safety, convenience, and performance for recreational vehicles, driving consumer adoption, strengthening brand presence, and supporting growth in the automotive aftermarket and dealer networks worldwide. Smart tow bars with electronic sway detection and sensor-assisted hitching enhance user experience, particularly for long-distance or heavy towing. Partnerships between RV manufacturers and tow bar companies drive innovation and product customization. These technological improvements increase consumer confidence, accelerate adoption, and expand market demand across recreational vehicles, trailers, and marine applications worldwide.

Market Restraints

  • High Costs and Maintenance Requirements

High costs and maintenance requirements pose a restraint on the global recreational tow bar market. Premium weight distribution hitches, sway control systems, and integrated tow bars often require significant upfront investment, making them less accessible to budget-conscious consumers. Additionally, routine maintenance, installation, and periodic inspections are necessary to ensure safety and longevity, which can be time-consuming and costly. Limited awareness of proper usage and maintenance may reduce adoption, particularly in emerging markets. Until lower-cost, durable, and user-friendly solutions are more widely available, these economic and operational barriers will continue to restrict the market’s potential growth despite rising interest in recreational towing activities.

Socioeconomic Impact on Recreational Tow Bar Market

The recreational tow bar market positively impacts the global economy by supporting the RV, tourism, and outdoor recreation sectors. Enhanced towing safety and convenience enable broader participation in travel and leisure activities, increasing consumer spending and boosting related industries such as campgrounds, fuel, and automotive services. The market also generates employment opportunities in manufacturing, retail, and aftermarket services. Technological innovation in tow bars improves product safety and reliability, reducing accidents and associated healthcare costs. Rising disposable income and disposable leisure time in developed and emerging regions drive market expansion, contributing to economic growth while promoting outdoor recreational lifestyles worldwide.

Segmental Analysis:

  • Weight Distribution Hitches segment is expected to witness highest growth over the forecast period

The weight distribution hitches segment is expected to witness the highest growth over the forecast period due to increasing demand for safe and stable towing solutions. These hitches evenly distribute trailer weight across the tow vehicle, reducing sway, enhancing control, and improving braking efficiency. Rising popularity of RV travel, camping, and outdoor recreation has increased consumer awareness of towing safety, boosting adoption. Technological advancements, including integrated sway control and adjustable designs, further enhance usability and performance. Both aftermarket and OEM adoption are expanding, making weight distribution hitches a key growth driver in the global recreational tow bar market.

  • Recreational Vehicles (RVs) Solutions segment is expected to witness highest growth over the forecast period

The recreational vehicles (RVs) solutions segment is expected to witness the highest growth over the forecast period as RV travel and outdoor tourism continue to rise globally. Tow bars, weight distribution hitches, and sway control systems are essential for RV owners to ensure safe, efficient towing. Growing disposable incomes, increasing adventure tourism, and lifestyle shifts toward mobile living and family vacations are driving demand for reliable towing solutions. Manufacturers are developing RV-specific products with enhanced durability, integrated sway prevention, and ease of installation. This segment benefits from strong aftermarket and OEM adoption, fueling consistent growth in the global market.

  • OEM (Original Equipment Manufacturers) segment is expected to witness highest growth over the forecast period

The OEM segment is expected to witness the highest growth over the forecast period due to increasing collaboration between tow bar manufacturers and RV, trailer, and camper producers. OEM integration ensures high-quality, vehicle-specific towing solutions, improving safety, convenience, and overall user experience. Rising demand for pre-installed towing systems in new RVs, boats, and campers encourages OEM adoption. Technological advancements, including modular hitches and integrated sway control, support OEM partnerships. Additionally, consumer preference for ready-to-use towing solutions over aftermarket installations drives market growth. OEM-focused strategies strengthen brand loyalty and accelerate adoption, making this segment a key contributor to global recreational tow bar market expansion.

  • North American Region is expected to witness highest growth over the forecast period

North America is expected to witness the highest growth in the recreational tow bar market over the forecast period due to the region’s strong RV culture, high disposable incomes, and extensive outdoor tourism infrastructure. Widespread adoption of weight distribution hitches, sway control systems, and integrated tow bars is fueled by safety awareness and regulatory standards. For instance, in 2022, Airstream partnered with Blue Ox to produce trailer-specific SwayPro and TrackPro weight distribution hitches, enhancing towing safety and performance. This collaboration strengthened the global recreational tow bar market by improving product accessibility, driving consumer adoption, and promoting awareness through educational initiatives on sway prevention and optimized towing solutions worldwide.

The U.S. and Canada have well-established OEM and aftermarket distribution networks, including dealerships and e-commerce platforms, increasing accessibility. Technological innovation, combined with high recreational vehicle ownership and a growing adventure tourism industry, positions North America as the largest and fastest-growing regional market globally.

Recreational Tow Bar Market table

To Learn More About This Report - Request a Free Sample Copy

Recreational Tow Bar Market Competitive Landscape

The recreational tow bar market is highly competitive, featuring global players, specialized manufacturers, and aftermarket service providers. Companies compete through product innovation, quality, safety features, and brand recognition. Strategic partnerships with RV manufacturers, distribution networks, and e-commerce platforms enhance market reach. Leading players focus on developing advanced weight distribution systems, integrated sway control, and corrosion-resistant materials. High entry barriers, including safety certifications and technological expertise, limit new entrants. Market consolidation through mergers and acquisitions is common to expand portfolios and geographic presence. Continuous R&D, customer-centric design, and adherence to regulatory standards define competitive advantage in the global recreational tow bar market.

The major players for above market are:

  • Horizon Global Corporation (REES®E)
  • Blue Ox LLC
  • Demco Products, Inc.
  • Curt Manufacturing LLC
  • Tekonsha (a subsidiary of DexKo Global Inc.)
  • Lippert Components, Inc.
  • Hayman Reese Pty Ltd
  • Andersen Hitches
  • Torklift International
  • Pro Series by CURT Group
  • Roadmaster Inc.
  • B&W Trailer Hitches
  • Draw-Tite (a subsidiary of DexKo Global Inc.)
  • Reese Explore (Horizon Global)
  • Weigh Safe, LLC
  • Equal-i-zer
  • Fastway Trailer Products
  • Fulton Trailer Couplings
  • U-Haul International, Inc. (tow bar accessories)
  • Hayman Reese USA

Recent Development

  • In October 2023, Hopkins Towing Solutions’ acquisition of Hayes Towing Electronics expanded its product portfolio and manufacturing capabilities. This strengthened its market position, enhanced innovation in trailer brake controls, and contributed to growth and consolidation within the global recreational tow bar market by improving product offerings and competitive advantage.


  • In September 2023, The acquisition of New England TruckMaster bolstered Hopkins Towing Solutions’ reach into light, medium, and heavy-duty tow truck segments. This strategic move enhanced the company’s market presence and service capabilities, positively impacting the global recreational tow bar market through expanded product availability and strengthened supply chain networks.


Frequently Asked Questions (FAQ) :

Q1. What are the main growth-driving factors for this market?

The primary driver is the rising popularity of outdoor recreational activities and "overlanding" among millennials and retirees. Increased sales of SUVs and light trucks, which are commonly used for towing boats, trailers, and bike racks, further fuel demand. Additionally, advancements in lightweight, high-strength materials make modern tow bars more appealing.

Q2. What are the main restraining factors for this market?

Growth is hindered by the rising popularity of compact electric vehicles, which often have limited towing capacities or manufacturer restrictions. Additionally, fluctuating raw material prices for steel and aluminum increase production costs. Stringent safety regulations and complex installation requirements in certain regions can also deter DIY consumers from making purchases.

Q3. Which segment is expected to witness high growth?

The weight distribution hitches segment is expected to witness the highest growth over the forecast period due to rising demand for safer, more stable towing. These hitches evenly distribute trailer weight, reduce sway, and enhance control, making them essential for RVs, trailers, and boats, driving adoption in both OEM and aftermarket markets.

Q4. Who are the top major players for this market?

Key market leaders include Brink Group, Horizon Global Corporation, Curt Manufacturing, and Westfalia-Automotive. Other significant contributors are Bosal, B&W Trailer Hitches, and Blue Ox. These companies maintain dominance through extensive distribution networks, strategic partnerships with automotive OEMs, and constant innovation in quick-release and high-capacity towing technologies.

Q5. Which country is the largest player?

The United States is the largest player in the recreational tow bar market. This leadership is driven by a deep-rooted culture of camping, boating, and long-distance road trips. Furthermore, the high domestic penetration of heavy-duty pickup trucks and large SUVs provides a massive installed base for towing accessory sales.

Recreational Tow Bar MARKET STUDY GLOBAL MARKET ANALYSIS, INSIGHTS AND FORECAST, 2022-2029

    1. Introduction

    • 1.1. Research Scope
    • 1.2. Market Segmentation
    • 1.3. Research Methodology
    • 1.4. Definitions and Assumptions

    2. Executive Summary

      3. Market Dynamics

      • 3.1. Market Drivers
      • 3.2. Market Restraints
      • 3.3. Market Opportunities

      4. Key Insights

      • 4.1. Key Emerging Trends – For Major Countries
      • 4.2. Latest Technological Advancement
      • 4.3. Regulatory Landscape
      • 4.4. Industry SWOT Analysis
      • 4.5. Porters Five Forces Analysis

      5. Global Recreational Tow Bar Market Analysis (USD Billion), Insights and Forecast, 2018-2029

      • 5.1. Key Findings / Summary
      • 5.2. Market Analysis, Insights and Forecast – By Segment 1
        • 5.2.1. Sub-Segment 1
        • 5.2.2. Sub-Segment 2
      • 5.3. Market Analysis, Insights and Forecast – By Segment 2
        • 5.3.1. Sub-Segment 1
        • 5.3.2. Sub-Segment 2
        • 5.3.3. Sub-Segment 3
        • 5.3.4. Others
      • 5.4. Market Analysis, Insights and Forecast – By Segment 3
        • 5.4.1. Sub-Segment 1
        • 5.4.2. Sub-Segment 2
        • 5.4.3. Sub-Segment 3
        • 5.4.4. Others
      • 5.5. Market Analysis, Insights and Forecast – By Region
        • 5.5.1. North America
        • 5.5.2. Latin America
        • 5.5.3. Europe
        • 5.5.4. Asia Pacific
        • 5.5.5. Middle East and Africa

      6. North America Recreational Tow Bar Market Analysis (USD Billion), Insights and Forecast, 2018-2029

      • 6.1. Key Findings / Summary
      • 6.2. Market Analysis, Insights and Forecast – By Segment 1
        • 6.2.1. Sub-Segment 1
        • 6.2.2. Sub-Segment 2
      • 6.3. Market Analysis, Insights and Forecast – By Segment 2
        • 6.3.1. Sub-Segment 1
        • 6.3.2. Sub-Segment 2
        • 6.3.3. Sub-Segment 3
        • 6.3.4. Others
      • 6.4. Market Analysis, Insights and Forecast – By Segment 3
        • 6.4.1. Sub-Segment 1
        • 6.4.2. Sub-Segment 2
        • 6.4.3. Sub-Segment 3
        • 6.4.4. Others
      • 6.5. Market Analysis, Insights and Forecast – By Country
        • 6.5.1. U.S.
        • 6.5.2. Canada

      7. Latin America Recreational Tow Bar Market Analysis (USD Billion), Insights and Forecast, 2018-2029

      • 7.1. Key Findings / Summary
      • 7.2. Market Analysis, Insights and Forecast – By Segment 1
        • 7.2.1. Sub-Segment 1
        • 7.2.2. Sub-Segment 2
      • 7.3. Market Analysis, Insights and Forecast – By Segment 2
        • 7.3.1. Sub-Segment 1
        • 7.3.2. Sub-Segment 2
        • 7.3.3. Sub-Segment 3
        • 7.3.4. Others
      • 7.4. Market Analysis, Insights and Forecast – By Segment 3
        • 7.4.1. Sub-Segment 1
        • 7.4.2. Sub-Segment 2
        • 7.4.3. Sub-Segment 3
        • 7.4.4. Others
      • 7.5. Insights and Forecast – By Country
        • 7.5.1. Brazil
        • 7.5.2. Mexico
        • 7.5.3. Rest of Latin America

      8. Europe Recreational Tow Bar Market Analysis (USD Billion), Insights and Forecast, 2018-2029

      • 8.1. Key Findings / Summary
      • 8.2. Market Analysis, Insights and Forecast – By Segment 1
        • 8.2.1. Sub-Segment 1
        • 8.2.2. Sub-Segment 2
      • 8.3. Market Analysis, Insights and Forecast – By Segment 2
        • 8.3.1. Sub-Segment 1
        • 8.3.2. Sub-Segment 2
        • 8.3.3. Sub-Segment 3
        • 8.3.4. Others
      • 8.4. Market Analysis, Insights and Forecast – By Segment 3
        • 8.4.1. Sub-Segment 1
        • 8.4.2. Sub-Segment 2
        • 8.4.3. Sub-Segment 3
        • 8.4.4. Others
      • 8.5. Market Analysis, Insights and Forecast – By Country
        • 8.5.1. UK
        • 8.5.2. Germany
        • 8.5.3. France
        • 8.5.4. Italy
        • 8.5.5. Spain
        • 8.5.6. Russia
        • 8.5.7. Rest of Europe

      9. Asia Pacific Recreational Tow Bar Market Analysis (USD Billion), Insights and Forecast, 2018-2029

      • 9.1. Key Findings / Summary
      • 9.2. Market Analysis, Insights and Forecast – By Segment 1
        • 9.2.1. Sub-Segment 1
        • 9.2.2. Sub-Segment 2
      • 9.3. Market Analysis, Insights and Forecast – By Segment 2
        • 9.3.1. Sub-Segment 1
        • 9.3.2. Sub-Segment 2
        • 9.3.3. Sub-Segment 3
        • 9.3.4. Others
      • 9.4. Market Analysis, Insights and Forecast – By Segment 3
        • 9.4.1. Sub-Segment 1
        • 9.4.2. Sub-Segment 2
        • 9.4.3. Sub-Segment 3
        • 9.4.4. Others
      • 9.5. Market Analysis, Insights and Forecast – By Country
        • 9.5.1. China
        • 9.5.2. India
        • 9.5.3. Japan
        • 9.5.4. Australia
        • 9.5.5. South East Asia
        • 9.5.6. Rest of Asia Pacific

      10. Middle East & Africa Recreational Tow Bar Market Analysis (USD Billion), Insights and Forecast, 2018-2029

      • 10.1. Key Findings / Summary
      • 10.2. Market Analysis, Insights and Forecast – By Segment 1
        • 10.2.1. Sub-Segment 1
        • 10.2.2. Sub-Segment 2
      • 10.3. Market Analysis, Insights and Forecast – By Segment 2
        • 10.3.1. Sub-Segment 1
        • 10.3.2. Sub-Segment 2
        • 10.3.3. Sub-Segment 3
        • 10.3.4. Others
      • 10.4. Market Analysis, Insights and Forecast – By Segment 3
        • 10.4.1. Sub-Segment 1
        • 10.4.2. Sub-Segment 2
        • 10.4.3. Sub-Segment 3
        • 10.4.4. Others
      • 10.5. Market Analysis, Insights and Forecast – By Country
        • 10.5.1. GCC
        • 10.5.2. South Africa
        • 10.5.3. Rest of Middle East & Africa

      11. Competitive Analysis

      • 11.1. Company Market Share Analysis, 2018
      • 11.2. Key Industry Developments
      • 11.3. Company Profile
        • 11.3.1. Company 1
          • 11.3.1.1. Business Overview
          • 11.3.1.2. Segment 1 & Service Offering
          • 11.3.1.3. Overall Revenue
          • 11.3.1.4. Geographic Presence
          • 11.3.1.5. Recent Development
        *Similar details will be provided for the following companies
        • 11.3.2. Company 2
        • 11.3.3. Company 3
        • 11.3.4. Company 4
        • 11.3.5. Company 5
        • 11.3.6. Company 6
        • 11.3.7. Company 7
        • 11.3.8. Company 8
        • 11.3.9. Company 9
        • 11.3.10. Company 10
        • 11.3.11. Company 11
        • 11.3.12. Company 12
      List of Figures

      Figure 1: Global Recreational Tow Bar Market Revenue Breakdown (USD Billion, %) by Region, 2022 & 2029
      Figure 2: Global Recreational Tow Bar Market Value Share (%), By Segment 1, 2022 & 2029
      Figure 3: Global Recreational Tow Bar Market Forecast (USD Billion), by Sub-Segment 1, 2018-2029
      Figure 4: Global Recreational Tow Bar Market Forecast (USD Billion), by Sub-Segment 2, 2018-2029
      Figure 5: Global Recreational Tow Bar Market Value Share (%), By Segment 2, 2022 & 2029
      Figure 6: Global Recreational Tow Bar Market Forecast (USD Billion), by Sub-Segment 1, 2018-2029
      Figure 7: Global Recreational Tow Bar Market Forecast (USD Billion), by Sub-Segment 2, 2018-2029
      Figure 8: Global Recreational Tow Bar Market Forecast (USD Billion), by Sub-Segment 3, 2018-2029
      Figure 9: Global Recreational Tow Bar Market Forecast (USD Billion), by Others, 2018-2029
      Figure 10: Global Recreational Tow Bar Market Value Share (%), By Segment 3, 2022 & 2029
      Figure 11: Global Recreational Tow Bar Market Forecast (USD Billion), by Sub-Segment 1, 2018-2029
      Figure 12: Global Recreational Tow Bar Market Forecast (USD Billion), by Sub-Segment 2, 2018-2029
      Figure 13: Global Recreational Tow Bar Market Forecast (USD Billion), by Sub-Segment 3, 2018-2029
      Figure 14: Global Recreational Tow Bar Market Forecast (USD Billion), by Others, 2018-2029
      Figure 15: Global Recreational Tow Bar Market Value (USD Billion), by Region, 2022 & 2029
      Figure 16: North America Recreational Tow Bar Market Value Share (%), By Segment 1, 2022 & 2029
      Figure 17: North America Recreational Tow Bar Market Forecast (USD Billion), by Sub-Segment 1, 2018-2029
      Figure 18: North America Recreational Tow Bar Market Forecast (USD Billion), by Sub-Segment 2, 2018-2029
      Figure 19: North America Recreational Tow Bar Market Value Share (%), By Segment 2, 2022 & 2029
      Figure 20: North America Recreational Tow Bar Market Forecast (USD Billion), by Sub-Segment 1, 2018-2029
      Figure 21: North America Recreational Tow Bar Market Forecast (USD Billion), by Sub-Segment 2, 2018-2029
      Figure 22: North America Recreational Tow Bar Market Forecast (USD Billion), by Sub-Segment 3, 2018-2029
      Figure 23: North America Recreational Tow Bar Market Forecast (USD Billion), by Others, 2018-2029
      Figure 24: North America Recreational Tow Bar Market Value Share (%), By Segment 3, 2022 & 2029
      Figure 25: North America Recreational Tow Bar Market Forecast (USD Billion), by Sub-Segment 1, 2018-2029
      Figure 26: North America Recreational Tow Bar Market Forecast (USD Billion), by Sub-Segment 2, 2018-2029
      Figure 27: North America Recreational Tow Bar Market Forecast (USD Billion), by Sub-Segment 3, 2018-2029
      Figure 28: North America Recreational Tow Bar Market Forecast (USD Billion), by Others, 2018-2029
      Figure 29: North America Recreational Tow Bar Market Forecast (USD Billion), by U.S., 2018-2029
      Figure 30: North America Recreational Tow Bar Market Forecast (USD Billion), by Canada, 2018-2029
      Figure 31: Latin America Recreational Tow Bar Market Value Share (%), By Segment 1, 2022 & 2029
      Figure 32: Latin America Recreational Tow Bar Market Forecast (USD Billion), by Sub-Segment 1, 2018-2029
      Figure 33: Latin America Recreational Tow Bar Market Forecast (USD Billion), by Sub-Segment 2, 2018-2029
      Figure 34: Latin America Recreational Tow Bar Market Value Share (%), By Segment 2, 2022 & 2029
      Figure 35: Latin America Recreational Tow Bar Market Forecast (USD Billion), by Sub-Segment 1, 2018-2029
      Figure 36: Latin America Recreational Tow Bar Market Forecast (USD Billion), by Sub-Segment 2, 2018-2029
      Figure 37: Latin America Recreational Tow Bar Market Forecast (USD Billion), by Sub-Segment 3, 2018-2029
      Figure 38: Latin America Recreational Tow Bar Market Forecast (USD Billion), by Others, 2018-2029
      Figure 39: Latin America Recreational Tow Bar Market Value Share (%), By Segment 3, 2022 & 2029
      Figure 40: Latin America Recreational Tow Bar Market Forecast (USD Billion), by Sub-Segment 1, 2018-2029
      Figure 41: Latin America Recreational Tow Bar Market Forecast (USD Billion), by Sub-Segment 2, 2018-2029
      Figure 42: Latin America Recreational Tow Bar Market Forecast (USD Billion), by Sub-Segment 3, 2018-2029
      Figure 43: Latin America Recreational Tow Bar Market Forecast (USD Billion), by Others, 2018-2029
      Figure 44: Latin America Recreational Tow Bar Market Forecast (USD Billion), by Brazil, 2018-2029
      Figure 45: Latin America Recreational Tow Bar Market Forecast (USD Billion), by Mexico, 2018-2029
      Figure 46: Latin America Recreational Tow Bar Market Forecast (USD Billion), by Rest of Latin America, 2018-2029
      Figure 47: Europe Recreational Tow Bar Market Value Share (%), By Segment 1, 2022 & 2029
      Figure 48: Europe Recreational Tow Bar Market Forecast (USD Billion), by Sub-Segment 1, 2018-2029
      Figure 49: Europe Recreational Tow Bar Market Forecast (USD Billion), by Sub-Segment 2, 2018-2029
      Figure 50: Europe Recreational Tow Bar Market Value Share (%), By Segment 2, 2022 & 2029
      Figure 51: Europe Recreational Tow Bar Market Forecast (USD Billion), by Sub-Segment 1, 2018-2029
      Figure 52: Europe Recreational Tow Bar Market Forecast (USD Billion), by Sub-Segment 2, 2018-2029
      Figure 53: Europe Recreational Tow Bar Market Forecast (USD Billion), by Sub-Segment 3, 2018-2029
      Figure 54: Europe Recreational Tow Bar Market Forecast (USD Billion), by Others, 2018-2029
      Figure 55: Europe Recreational Tow Bar Market Value Share (%), By Segment 3, 2022 & 2029
      Figure 56: Europe Recreational Tow Bar Market Forecast (USD Billion), by Sub-Segment 1, 2018-2029
      Figure 57: Europe Recreational Tow Bar Market Forecast (USD Billion), by Sub-Segment 2, 2018-2029
      Figure 58: Europe Recreational Tow Bar Market Forecast (USD Billion), by Sub-Segment 3, 2018-2029
      Figure 59: Europe Recreational Tow Bar Market Forecast (USD Billion), by Others, 2018-2029
      Figure 60: Europe Recreational Tow Bar Market Forecast (USD Billion), by U.K., 2018-2029
      Figure 61: Europe Recreational Tow Bar Market Forecast (USD Billion), by Germany, 2018-2029
      Figure 62: Europe Recreational Tow Bar Market Forecast (USD Billion), by France, 2018-2029
      Figure 63: Europe Recreational Tow Bar Market Forecast (USD Billion), by Italy, 2018-2029
      Figure 64: Europe Recreational Tow Bar Market Forecast (USD Billion), by Spain, 2018-2029
      Figure 65: Europe Recreational Tow Bar Market Forecast (USD Billion), by Russia, 2018-2029
      Figure 66: Europe Recreational Tow Bar Market Forecast (USD Billion), by Rest of Europe, 2018-2029
      Figure 67: Asia Pacific Recreational Tow Bar Market Value Share (%), By Segment 1, 2022 & 2029
      Figure 68: Asia Pacific Recreational Tow Bar Market Forecast (USD Billion), by Sub-Segment 1, 2018-2029
      Figure 69: Asia Pacific Recreational Tow Bar Market Forecast (USD Billion), by Sub-Segment 2, 2018-2029
      Figure 70: Asia Pacific Recreational Tow Bar Market Value Share (%), By Segment 2, 2022 & 2029
      Figure 71: Asia Pacific Recreational Tow Bar Market Forecast (USD Billion), by Sub-Segment 1, 2018-2029
      Figure 72: Asia Pacific Recreational Tow Bar Market Forecast (USD Billion), by Sub-Segment 2, 2018-2029
      Figure 73: Asia Pacific Recreational Tow Bar Market Forecast (USD Billion), by Sub-Segment 3, 2018-2029
      Figure 74: Asia Pacific Recreational Tow Bar Market Forecast (USD Billion), by Others, 2018-2029
      Figure 75: Asia Pacific Recreational Tow Bar Market Value Share (%), By Segment 3, 2022 & 2029
      Figure 76: Asia Pacific Recreational Tow Bar Market Forecast (USD Billion), by Sub-Segment 1, 2018-2029
      Figure 77: Asia Pacific Recreational Tow Bar Market Forecast (USD Billion), by Sub-Segment 2, 2018-2029
      Figure 78: Asia Pacific Recreational Tow Bar Market Forecast (USD Billion), by Sub-Segment 3, 2018-2029
      Figure 79: Asia Pacific Recreational Tow Bar Market Forecast (USD Billion), by Others, 2018-2029
      Figure 80: Asia Pacific Recreational Tow Bar Market Forecast (USD Billion), by China, 2018-2029
      Figure 81: Asia Pacific Recreational Tow Bar Market Forecast (USD Billion), by India, 2018-2029
      Figure 82: Asia Pacific Recreational Tow Bar Market Forecast (USD Billion), by Japan, 2018-2029
      Figure 83: Asia Pacific Recreational Tow Bar Market Forecast (USD Billion), by Australia, 2018-2029
      Figure 84: Asia Pacific Recreational Tow Bar Market Forecast (USD Billion), by Southeast Asia, 2018-2029
      Figure 85: Asia Pacific Recreational Tow Bar Market Forecast (USD Billion), by Rest of Asia Pacific, 2018-2029
      Figure 86: Middle East & Africa Recreational Tow Bar Market Value Share (%), By Segment 1, 2022 & 2029
      Figure 87: Middle East & Africa Recreational Tow Bar Market Forecast (USD Billion), by Sub-Segment 1, 2018-2029
      Figure 88: Middle East & Africa Recreational Tow Bar Market Forecast (USD Billion), by Sub-Segment 2, 2018-2029
      Figure 89: Middle East & Africa Recreational Tow Bar Market Value Share (%), By Segment 2, 2022 & 2029
      Figure 90: Middle East & Africa Recreational Tow Bar Market Forecast (USD Billion), by Sub-Segment 1, 2018-2029
      Figure 91: Middle East & Africa Recreational Tow Bar Market Forecast (USD Billion), by Sub-Segment 2, 2018-2029
      Figure 92: Middle East & Africa Recreational Tow Bar Market Forecast (USD Billion), by Sub-Segment 3, 2018-2029
      Figure 93: Middle East & Africa Recreational Tow Bar Market Forecast (USD Billion), by Others, 2018-2029
      Figure 94: Middle East & Africa Recreational Tow Bar Market Value Share (%), By Segment 3, 2022 & 2029
      Figure 95: Middle East & Africa Recreational Tow Bar Market Forecast (USD Billion), by Sub-Segment 1, 2018-2029
      Figure 96: Middle East & Africa Recreational Tow Bar Market Forecast (USD Billion), by Sub-Segment 2, 2018-2029
      Figure 97: Middle East & Africa Recreational Tow Bar Market Forecast (USD Billion), by Sub-Segment 3, 2018-2029
      Figure 98: Middle East & Africa Recreational Tow Bar Market Forecast (USD Billion), by Others, 2018-2029
      Figure 99: Middle East & Africa Recreational Tow Bar Market Forecast (USD Billion), by GCC, 2018-2029
      Figure 100: Middle East & Africa Recreational Tow Bar Market Forecast (USD Billion), by South Africa, 2018-2029
      Figure 101: Middle East & Africa Recreational Tow Bar Market Forecast (USD Billion), by Rest of Middle East & Africa, 2018-2029 
      List of Tables
      Table 1: Global Recreational Tow Bar Market Revenue (USD Billion) Forecast, by Segment 1, 2018-2029
      Table 2: Global Recreational Tow Bar Market Revenue (USD Billion) Forecast, by Segment 2, 2018-2029
      Table 3: Global Recreational Tow Bar Market Revenue (USD Billion) Forecast, by Segment 3, 2018-2029
      Table 4: Global Recreational Tow Bar Market Revenue (USD Billion) Forecast, by Region, 2018-2029
      Table 5: North America Recreational Tow Bar Market Revenue (USD Billion) Forecast, by Segment 1, 2018-2029
      Table 6: North America Recreational Tow Bar Market Revenue (USD Billion) Forecast, by Segment 2, 2018-2029
      Table 7: North America Recreational Tow Bar Market Revenue (USD Billion) Forecast, by Segment 3, 2018-2029
      Table 8: North America Recreational Tow Bar Market Revenue (USD Billion) Forecast, by Country, 2018-2029
      Table 9: Europe Recreational Tow Bar Market Revenue (USD Billion) Forecast, by Segment 1, 2018-2029
      Table 10: Europe Recreational Tow Bar Market Revenue (USD Billion) Forecast, by Segment 2, 2018-2029
      Table 11: Europe Recreational Tow Bar Market Revenue (USD Billion) Forecast, by Segment 3, 2018-2029
      Table 12: Europe Recreational Tow Bar Market Revenue (USD Billion) Forecast, by Country, 2018-2029
      Table 13: Latin America Recreational Tow Bar Market Revenue (USD Billion) Forecast, by Segment 1, 2018-2029
      Table 14: Latin America Recreational Tow Bar Market Revenue (USD Billion) Forecast, by Segment 2, 2018-2029
      Table 15: Latin America Recreational Tow Bar Market Revenue (USD Billion) Forecast, by Segment 3, 2018-2029
      Table 16: Latin America Recreational Tow Bar Market Revenue (USD Billion) Forecast, by Country, 2018-2029
      Table 17: Asia Pacific Recreational Tow Bar Market Revenue (USD Billion) Forecast, by Segment 1, 2018-2029
      Table 18: Asia Pacific Recreational Tow Bar Market Revenue (USD Billion) Forecast, by Segment 2, 2018-2029
      Table 19: Asia Pacific Recreational Tow Bar Market Revenue (USD Billion) Forecast, by Segment 3, 2018-2029
      Table 20: Asia Pacific Recreational Tow Bar Market Revenue (USD Billion) Forecast, by Country, 2018-2029
      Table 21: Middle East & Africa Recreational Tow Bar Market Revenue (USD Billion) Forecast, by Segment 1, 2018-2029
      Table 22: Middle East & Africa Recreational Tow Bar Market Revenue (USD Billion) Forecast, by Segment 2, 2018-2029
      Table 23: Middle East & Africa Recreational Tow Bar Market Revenue (USD Billion) Forecast, by Segment 3, 2018-2029
      Table 24: Middle East & Africa Recreational Tow Bar Market Revenue (USD Billion) Forecast, by Country, 2018-2029
      Research Process

      Data Library Research are conducted by industry experts who offer insight on industry structure, market segmentations technology assessment and competitive landscape (CL), and penetration, as well as on emerging trends. Their analysis is based on primary interviews (~ 80%) and secondary research (~ 20%) as well as years of professional expertise in their respective industries. Adding to this, by analysing historical trends and current market positions, our analysts predict where the market will be headed for the next five years. Furthermore, the varying trends of segment & categories geographically presented are also studied and the estimated based on the primary & secondary research.

      In this particular report from the supply side Data Library Research has conducted primary surveys (interviews) with the key level executives (VP, CEO’s, Marketing Director, Business Development Manager and SOFT) of the companies that active & prominent as well as the midsized organization

      FIGURE 1: DLR RESEARH PROCESS

      research-methodology1

      Primary Research

      Extensive primary research was conducted to gain a deeper insight of the market and industry performance. The analysis is based on both primary and secondary research as well as years of professional expertise in the respective industries.

      In addition to analysing current and historical trends, our analysts predict where the market is headed over the next five years.

      It varies by segment for these categories geographically presented in the list of market tables. Speaking about this particular report we have conducted primary surveys (interviews) with the key level executives (VP, CEO’s, Marketing Director, Business Development Manager and many more) of the major players active in the market.

      Secondary Research

      Secondary research was mainly used to collect and identify information useful for the extensive, technical, market-oriented, and Friend’s study of the Global Extra Neutral Alcohol. It was also used to obtain key information about major players, market classification and segmentation according to the industry trends, geographical markets, and developments related to the market and technology perspectives. For this study, analysts have gathered information from various credible sources, such as annual reports, sec filings, journals, white papers, SOFT presentations, and company web sites.

      Market Size Estimation

      Both, top-down and bottom-up approaches were used to estimate and validate the size of the Global market and to estimate the size of various other dependent submarkets in the overall Extra Neutral Alcohol. The key players in the market were identified through secondary research and their market contributions in the respective geographies were determined through primary and secondary research.

      Forecast Model

      research-methodology2