Redundancy Power Supply Module Market Overview and Analysis:
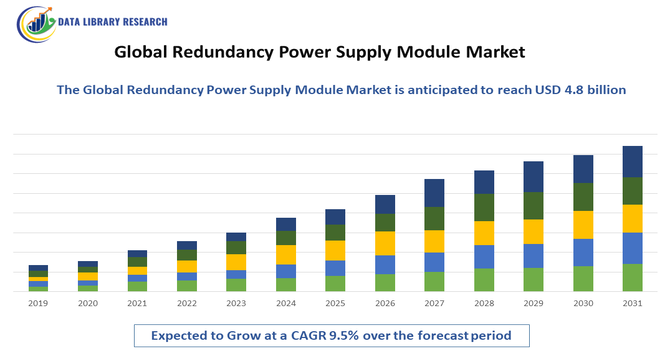
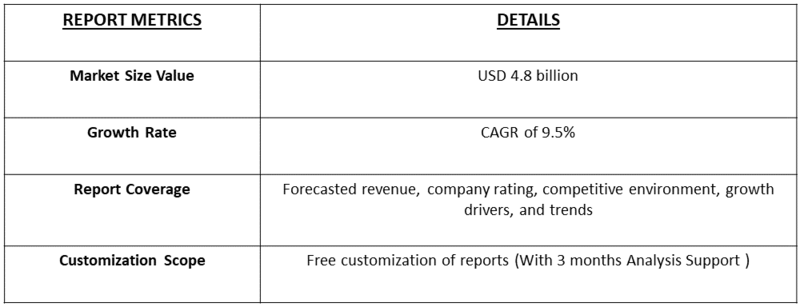
- The Global Redundancy Power Supply Module Market is forecast to grow at a Compound Annual Growth Rate (CAGR) of approximately 9.5% between 2025 and 2032, driven primarily by the rapid expansion of data centers and the need for zero downtime. The market's valuation, is approximately USD 1.5 billion in 2025, is projected to reach about USD 4.8 billion by 2032.
Get Complete Analysis Of The Report - Download Updated Free Sample PDF
The Global Redundancy Power Supply Module Market is experiencing strong growth driven by the increasing need for uninterrupted and reliable power in critical applications such as data centers, telecom networks, industrial automation, and healthcare facilities. Rising adoption of cloud computing, IoT infrastructure, and mission-critical systems has intensified the demand for redundant power solutions that ensure continuous operation and prevent costly downtime.
Redundancy Power Supply Module Market Latest Trends:
The Global Redundancy Power Supply Module Market is increasingly shifting toward modular, hot swappable, and scalable redundancy architectures — enabling data centers, telecom networks, and industrial users to expand capacity or perform maintenance without downtime. Finally, integration with IoT and smart grid frameworks — and a push for sustainability — is driving interest in redundancy modules that support high-efficiency power conversion, energy optimization (e.g. dynamic load sharing), and hybrid operation (including renewable source support), especially in data centers and critical infrastructures.
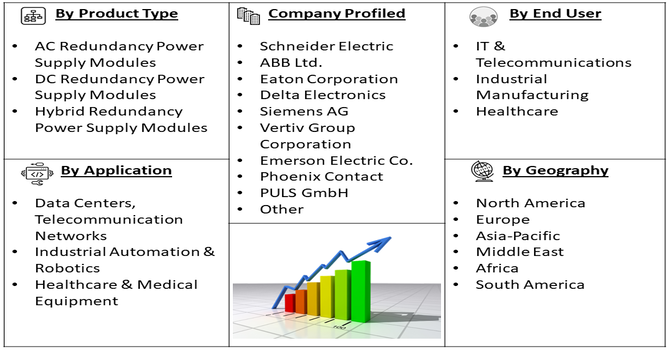
Segmentation: Global Redundancy Power Supply Module Market is segmented By Module Type (AC Redundancy Power Supply Modules, DC Redundancy Power Supply Modules, Hybrid Redundancy Power Supply Modules), Application (Data Centers, Telecommunication Networks, Industrial Automation & Robotics, Healthcare & Medical Equipment), End-Use Industry (IT & Telecommunications, Industrial Manufacturing, Healthcare), and Geography (North America, Europe, Asia-Pacific, Middle East and Africa, and South America). The report provides the value (in USD million) for the above segments.
For Detailed Market Segmentation - Get a Free Sample PDF
Market Drivers:
- Increasing Demand for Uninterrupted Power Supply in Critical Applications
A primary driver of the Global Redundancy Power Supply Module Market is the growing need for continuous and reliable power in mission-critical applications such as data centers, telecom networks, healthcare facilities, and industrial automation systems. Any power interruption in these sectors can result in significant financial losses, operational downtime, and safety risks. Redundant power supply modules ensure seamless operation by providing backup power in case of primary supply failure, making them essential for maintaining system reliability and performance. The rising deployment of cloud computing, edge computing, and high-performance IT infrastructure is further intensifying the need for robust redundancy solutions.
- Growth in Industrial Automation and Smart Infrastructure
The adoption of industrial automation, smart manufacturing, and intelligent building systems is another key driver boosting the redundancy power supply module market. Modern automated systems, robotics, and IoT-enabled infrastructure require stable and uninterrupted power to operate efficiently and avoid process disruptions. Redundancy power modules, with features like load sharing, hot-swappable capability, and scalability, ensure continuous power delivery and system resilience. Additionally, increasing investments in critical infrastructures such as smart grids, renewable energy integration, and telecommunications networks are driving demand for high-efficiency, reliable, redundant power solutions globally.
Redundancy Power Supply Module Market Restraints
- High Initial Investment and Maintenance Costs
A significant restraint for the Global Redundancy Power Supply Module Market is the high initial cost associated with purchasing and installing redundancy power modules. These systems often require advanced engineering, high-quality components, and integration with existing power infrastructure, which can substantially increase upfront expenditures. Additionally, maintenance and servicing costs for ensuring optimal performance—such as regular testing, replacement of faulty modules, and calibration—can add to the total operational expense. This high cost factor can deter small and medium-sized enterprises or cost-sensitive industries from adopting redundant power solutions, limiting market penetration in certain segments.
Socioeconomic Impact on Redundancy Power Supply Module Market
The Global Redundancy Power Supply Module Market is experiencing significant socioeconomic impacts as industries increasingly prioritize reliable and uninterrupted power supply. By ensuring system stability in critical sectors such as healthcare, data centers, telecommunications, and manufacturing, redundant power modules reduce downtime, preventing economic losses and enhancing productivity. Additionally, a reliable power supply promotes business continuity, fostering investor confidence and economic stability. In regions with unstable grids, these modules contribute to social well-being by maintaining essential services. Thus, the market’s expansion not only strengthens industrial resilience but also positively influences economic growth and societal quality of life worldwide.
Segmental Analysis:
- DC Redundancy Power Supply Modules segment is expected to witness the highest growth over the forecast period
DC redundancy power supply modules are gaining prominence due to their efficiency in providing stable and uninterrupted power to telecom networks, data centers, and industrial automation systems. Their ability to directly support DC-powered equipment without conversion losses makes them highly suitable for applications requiring high reliability and energy efficiency.
- Data Centers segment is expected to witness the highest growth over the forecast period
The data center segment is a key driver for the redundancy power supply module market, as uninterrupted power is critical to maintaining server operations and preventing costly downtime. With the rapid growth of cloud computing, edge computing, and enterprise IT infrastructure, data centers are increasingly investing in redundancy solutions to ensure high availability and operational continuity.
Additionally, stringent regulatory standards and service-level agreements (SLAs) in the data center industry are pushing operators to adopt advanced redundancy power supply modules. These solutions not only minimize the risk of power-related failures but also enhance energy efficiency and system reliability. As businesses demand 24/7 access to digital services, the emphasis on robust, fault-tolerant power systems is expected to further drive innovation and adoption in this market segment, making redundancy modules a critical component of modern data center design.
- IT & Telecommunications segment is expected to witness the highest growth over the forecast period
The IT & telecommunications industry represents a significant share of the market, driven by the critical need for continuous power in network operations, server farms, and communication equipment. Redundancy power supply modules help maintain reliability and prevent outages, which is essential for telecom service providers and IT companies operating mission-critical systems.
- North America segment is expected to witness the highest growth over the forecast period
North America is expected to witness the highest growth over the forecast period due to the region’s rapid adoption of advanced IT infrastructure, cloud data centers, and telecom networks. Strong government initiatives supporting reliable energy infrastructure, coupled with the presence of leading redundancy power module manufacturers, are driving the demand for advanced and efficient power solutions in the region.
Additionally, the increasing focus on sustainability and energy efficiency in North America is fueling the adoption of next-generation power modules. For instance, The DPA 250 S4, with its modular 50–1,500 kW capacity and N+1 redundancy, strengthened the U.S. redundancy power supply module market by enabling high-density, reliable power for data centers, healthcare, commercial, and transportation sectors. Its secure ring-bus architecture minimized failure risks, boosting demand for advanced, scalable, and uninterrupted power solutions. Enterprises across various sectors, including data centers, telecommunications, and industrial automation, are investing in solutions that offer higher reliability, lower downtime, and reduced operational costs.
Furthermore, the region’s well-established research and development ecosystem enables continuous innovation in power module technologies, allowing manufacturers to introduce more compact, high-performance, and environmentally friendly products that meet the evolving demands of modern infrastructure.
To Learn More About This Report - Request a Free Sample Copy
Redundancy Power Supply Module Market Competitive Landscape:
The Global Redundancy Power Supply Module Market is highly competitive, with a mix of well-established multinational corporations and specialized power system vendors vying for market share. Leading firms compete on the basis of reliability, energy efficiency, modularity, scalability, and global distribution capabilities. As demand grows from data centers, telecommunications networks, industrial automation, and other mission-critical applications, companies are increasingly investing in R&D, expanding product portfolios, and forming strategic alliances to offer advanced redundancy solutions tailored to modern infrastructure needs.
Key Players:
- Schneider Electric
- ABB Ltd.
- Eaton Corporation
- Delta Electronics
- Siemens AG
- Vertiv Group Corporation
- Emerson Electric Co.
- Phoenix Contact
- PULS GmbH
- TDK Lambda
- Bel Power Solutions
- Traco Power
- XP Power
- Socomec Group
- Riello UPS
- Fuji Electric Co., Ltd.
- Mitsubishi Electric Corporation
- General Electric Company
- CyberPower Systems
- Murata Power Solutions
Recent Development
- In April 2025, Delta’s launch of 5,500W high-power redundant supplies with 80 PLUS Ruby certification sets a new benchmark in energy-efficient power solutions. Achieving 97.5% peak efficiency and higher power density, this innovation is expected to drive the global redundancy power supply module market by encouraging adoption in AI servers and data centers, promoting energy savings, reliability, and advanced technological integration.
- In March 2025, Schneider Electric’s Galaxy VXL UPS, offering compact, high-density power protection for AI, data centers, and large-scale electrical workloads, strengthens the global redundancy power supply module market. Its advanced reliability and space-efficient design drive adoption across critical infrastructures, enhancing operational continuity, energy efficiency, and system resilience, thereby fueling market growth and supporting expanding digital and industrial demands worldwide.
Frequently Asked Questions (FAQ) :
Q1. What are the main growth-driving factors for this market?
The main driver is the explosion of data centers and the rising global reliance on cloud computing. Since any power failure can cause massive financial and operational losses for these digital infrastructures, businesses across IT, finance, and telecommunications are heavily investing in redundant power modules to ensure zero downtime.
Q2. What are the main restraining factors for this market?
The high initial investment and complexity are the primary drawbacks. Redundant systems require more physical space and involve higher maintenance and installation costs than basic power supplies. Also, some end-users still prefer lower-cost, traditional Uninterruptible Power Supply (UPS) systems, slowing market adoption.
Q3. Which segment is expected to witness high growth?
The Data Center application segment is projected to grow the fastest. As more data is generated, processed, and stored globally, hyperscale and enterprise data centers need scalable, high-availability power solutions, making redundant power supply modules essential for their continued rapid expansion.
Q4. Who are the top major players for this market?
The market is led by major industrial and electrical equipment manufacturers specializing in power solutions. Key companies include Eaton, Schneider Electric, ABB, Delta Electronics, and Vertiv Group Corp. These players focus on delivering highly efficient and scalable modular units.
Q5. Which country is the largest player?
North America, particularly the United States, holds the largest market share in terms of revenue. This dominance is due to the high concentration of large hyperscale data centers, advanced IT infrastructure, and early adoption of cloud and edge computing technologies demanding reliable, uninterrupted power.
List of Figures
Figure 1: Global Redundancy Power Supply Module Market Revenue Breakdown (USD Billion, %) by Region, 2022 & 2029
Figure 2: Global Redundancy Power Supply Module Market Value Share (%), By Segment 1, 2022 & 2029
Figure 3: Global Redundancy Power Supply Module Market Forecast (USD Billion), by Sub-Segment 1, 2018-2029
Figure 4: Global Redundancy Power Supply Module Market Forecast (USD Billion), by Sub-Segment 2, 2018-2029
Figure 5: Global Redundancy Power Supply Module Market Value Share (%), By Segment 2, 2022 & 2029
Figure 6: Global Redundancy Power Supply Module Market Forecast (USD Billion), by Sub-Segment 1, 2018-2029
Figure 7: Global Redundancy Power Supply Module Market Forecast (USD Billion), by Sub-Segment 2, 2018-2029
Figure 8: Global Redundancy Power Supply Module Market Forecast (USD Billion), by Sub-Segment 3, 2018-2029
Figure 9: Global Redundancy Power Supply Module Market Forecast (USD Billion), by Others, 2018-2029
Figure 10: Global Redundancy Power Supply Module Market Value Share (%), By Segment 3, 2022 & 2029
Figure 11: Global Redundancy Power Supply Module Market Forecast (USD Billion), by Sub-Segment 1, 2018-2029
Figure 12: Global Redundancy Power Supply Module Market Forecast (USD Billion), by Sub-Segment 2, 2018-2029
Figure 13: Global Redundancy Power Supply Module Market Forecast (USD Billion), by Sub-Segment 3, 2018-2029
Figure 14: Global Redundancy Power Supply Module Market Forecast (USD Billion), by Others, 2018-2029
Figure 15: Global Redundancy Power Supply Module Market Value (USD Billion), by Region, 2022 & 2029
Figure 16: North America Redundancy Power Supply Module Market Value Share (%), By Segment 1, 2022 & 2029
Figure 17: North America Redundancy Power Supply Module Market Forecast (USD Billion), by Sub-Segment 1, 2018-2029
Figure 18: North America Redundancy Power Supply Module Market Forecast (USD Billion), by Sub-Segment 2, 2018-2029
Figure 19: North America Redundancy Power Supply Module Market Value Share (%), By Segment 2, 2022 & 2029
Figure 20: North America Redundancy Power Supply Module Market Forecast (USD Billion), by Sub-Segment 1, 2018-2029
Figure 21: North America Redundancy Power Supply Module Market Forecast (USD Billion), by Sub-Segment 2, 2018-2029
Figure 22: North America Redundancy Power Supply Module Market Forecast (USD Billion), by Sub-Segment 3, 2018-2029
Figure 23: North America Redundancy Power Supply Module Market Forecast (USD Billion), by Others, 2018-2029
Figure 24: North America Redundancy Power Supply Module Market Value Share (%), By Segment 3, 2022 & 2029
Figure 25: North America Redundancy Power Supply Module Market Forecast (USD Billion), by Sub-Segment 1, 2018-2029
Figure 26: North America Redundancy Power Supply Module Market Forecast (USD Billion), by Sub-Segment 2, 2018-2029
Figure 27: North America Redundancy Power Supply Module Market Forecast (USD Billion), by Sub-Segment 3, 2018-2029
Figure 28: North America Redundancy Power Supply Module Market Forecast (USD Billion), by Others, 2018-2029
Figure 29: North America Redundancy Power Supply Module Market Forecast (USD Billion), by U.S., 2018-2029
Figure 30: North America Redundancy Power Supply Module Market Forecast (USD Billion), by Canada, 2018-2029
Figure 31: Latin America Redundancy Power Supply Module Market Value Share (%), By Segment 1, 2022 & 2029
Figure 32: Latin America Redundancy Power Supply Module Market Forecast (USD Billion), by Sub-Segment 1, 2018-2029
Figure 33: Latin America Redundancy Power Supply Module Market Forecast (USD Billion), by Sub-Segment 2, 2018-2029
Figure 34: Latin America Redundancy Power Supply Module Market Value Share (%), By Segment 2, 2022 & 2029
Figure 35: Latin America Redundancy Power Supply Module Market Forecast (USD Billion), by Sub-Segment 1, 2018-2029
Figure 36: Latin America Redundancy Power Supply Module Market Forecast (USD Billion), by Sub-Segment 2, 2018-2029
Figure 37: Latin America Redundancy Power Supply Module Market Forecast (USD Billion), by Sub-Segment 3, 2018-2029
Figure 38: Latin America Redundancy Power Supply Module Market Forecast (USD Billion), by Others, 2018-2029
Figure 39: Latin America Redundancy Power Supply Module Market Value Share (%), By Segment 3, 2022 & 2029
Figure 40: Latin America Redundancy Power Supply Module Market Forecast (USD Billion), by Sub-Segment 1, 2018-2029
Figure 41: Latin America Redundancy Power Supply Module Market Forecast (USD Billion), by Sub-Segment 2, 2018-2029
Figure 42: Latin America Redundancy Power Supply Module Market Forecast (USD Billion), by Sub-Segment 3, 2018-2029
Figure 43: Latin America Redundancy Power Supply Module Market Forecast (USD Billion), by Others, 2018-2029
Figure 44: Latin America Redundancy Power Supply Module Market Forecast (USD Billion), by Brazil, 2018-2029
Figure 45: Latin America Redundancy Power Supply Module Market Forecast (USD Billion), by Mexico, 2018-2029
Figure 46: Latin America Redundancy Power Supply Module Market Forecast (USD Billion), by Rest of Latin America, 2018-2029
Figure 47: Europe Redundancy Power Supply Module Market Value Share (%), By Segment 1, 2022 & 2029
Figure 48: Europe Redundancy Power Supply Module Market Forecast (USD Billion), by Sub-Segment 1, 2018-2029
Figure 49: Europe Redundancy Power Supply Module Market Forecast (USD Billion), by Sub-Segment 2, 2018-2029
Figure 50: Europe Redundancy Power Supply Module Market Value Share (%), By Segment 2, 2022 & 2029
Figure 51: Europe Redundancy Power Supply Module Market Forecast (USD Billion), by Sub-Segment 1, 2018-2029
Figure 52: Europe Redundancy Power Supply Module Market Forecast (USD Billion), by Sub-Segment 2, 2018-2029
Figure 53: Europe Redundancy Power Supply Module Market Forecast (USD Billion), by Sub-Segment 3, 2018-2029
Figure 54: Europe Redundancy Power Supply Module Market Forecast (USD Billion), by Others, 2018-2029
Figure 55: Europe Redundancy Power Supply Module Market Value Share (%), By Segment 3, 2022 & 2029
Figure 56: Europe Redundancy Power Supply Module Market Forecast (USD Billion), by Sub-Segment 1, 2018-2029
Figure 57: Europe Redundancy Power Supply Module Market Forecast (USD Billion), by Sub-Segment 2, 2018-2029
Figure 58: Europe Redundancy Power Supply Module Market Forecast (USD Billion), by Sub-Segment 3, 2018-2029
Figure 59: Europe Redundancy Power Supply Module Market Forecast (USD Billion), by Others, 2018-2029
Figure 60: Europe Redundancy Power Supply Module Market Forecast (USD Billion), by U.K., 2018-2029
Figure 61: Europe Redundancy Power Supply Module Market Forecast (USD Billion), by Germany, 2018-2029
Figure 62: Europe Redundancy Power Supply Module Market Forecast (USD Billion), by France, 2018-2029
Figure 63: Europe Redundancy Power Supply Module Market Forecast (USD Billion), by Italy, 2018-2029
Figure 64: Europe Redundancy Power Supply Module Market Forecast (USD Billion), by Spain, 2018-2029
Figure 65: Europe Redundancy Power Supply Module Market Forecast (USD Billion), by Russia, 2018-2029
Figure 66: Europe Redundancy Power Supply Module Market Forecast (USD Billion), by Rest of Europe, 2018-2029
Figure 67: Asia Pacific Redundancy Power Supply Module Market Value Share (%), By Segment 1, 2022 & 2029
Figure 68: Asia Pacific Redundancy Power Supply Module Market Forecast (USD Billion), by Sub-Segment 1, 2018-2029
Figure 69: Asia Pacific Redundancy Power Supply Module Market Forecast (USD Billion), by Sub-Segment 2, 2018-2029
Figure 70: Asia Pacific Redundancy Power Supply Module Market Value Share (%), By Segment 2, 2022 & 2029
Figure 71: Asia Pacific Redundancy Power Supply Module Market Forecast (USD Billion), by Sub-Segment 1, 2018-2029
Figure 72: Asia Pacific Redundancy Power Supply Module Market Forecast (USD Billion), by Sub-Segment 2, 2018-2029
Figure 73: Asia Pacific Redundancy Power Supply Module Market Forecast (USD Billion), by Sub-Segment 3, 2018-2029
Figure 74: Asia Pacific Redundancy Power Supply Module Market Forecast (USD Billion), by Others, 2018-2029
Figure 75: Asia Pacific Redundancy Power Supply Module Market Value Share (%), By Segment 3, 2022 & 2029
Figure 76: Asia Pacific Redundancy Power Supply Module Market Forecast (USD Billion), by Sub-Segment 1, 2018-2029
Figure 77: Asia Pacific Redundancy Power Supply Module Market Forecast (USD Billion), by Sub-Segment 2, 2018-2029
Figure 78: Asia Pacific Redundancy Power Supply Module Market Forecast (USD Billion), by Sub-Segment 3, 2018-2029
Figure 79: Asia Pacific Redundancy Power Supply Module Market Forecast (USD Billion), by Others, 2018-2029
Figure 80: Asia Pacific Redundancy Power Supply Module Market Forecast (USD Billion), by China, 2018-2029
Figure 81: Asia Pacific Redundancy Power Supply Module Market Forecast (USD Billion), by India, 2018-2029
Figure 82: Asia Pacific Redundancy Power Supply Module Market Forecast (USD Billion), by Japan, 2018-2029
Figure 83: Asia Pacific Redundancy Power Supply Module Market Forecast (USD Billion), by Australia, 2018-2029
Figure 84: Asia Pacific Redundancy Power Supply Module Market Forecast (USD Billion), by Southeast Asia, 2018-2029
Figure 85: Asia Pacific Redundancy Power Supply Module Market Forecast (USD Billion), by Rest of Asia Pacific, 2018-2029
Figure 86: Middle East & Africa Redundancy Power Supply Module Market Value Share (%), By Segment 1, 2022 & 2029
Figure 87: Middle East & Africa Redundancy Power Supply Module Market Forecast (USD Billion), by Sub-Segment 1, 2018-2029
Figure 88: Middle East & Africa Redundancy Power Supply Module Market Forecast (USD Billion), by Sub-Segment 2, 2018-2029
Figure 89: Middle East & Africa Redundancy Power Supply Module Market Value Share (%), By Segment 2, 2022 & 2029
Figure 90: Middle East & Africa Redundancy Power Supply Module Market Forecast (USD Billion), by Sub-Segment 1, 2018-2029
Figure 91: Middle East & Africa Redundancy Power Supply Module Market Forecast (USD Billion), by Sub-Segment 2, 2018-2029
Figure 92: Middle East & Africa Redundancy Power Supply Module Market Forecast (USD Billion), by Sub-Segment 3, 2018-2029
Figure 93: Middle East & Africa Redundancy Power Supply Module Market Forecast (USD Billion), by Others, 2018-2029
Figure 94: Middle East & Africa Redundancy Power Supply Module Market Value Share (%), By Segment 3, 2022 & 2029
Figure 95: Middle East & Africa Redundancy Power Supply Module Market Forecast (USD Billion), by Sub-Segment 1, 2018-2029
Figure 96: Middle East & Africa Redundancy Power Supply Module Market Forecast (USD Billion), by Sub-Segment 2, 2018-2029
Figure 97: Middle East & Africa Redundancy Power Supply Module Market Forecast (USD Billion), by Sub-Segment 3, 2018-2029
Figure 98: Middle East & Africa Redundancy Power Supply Module Market Forecast (USD Billion), by Others, 2018-2029
Figure 99: Middle East & Africa Redundancy Power Supply Module Market Forecast (USD Billion), by GCC, 2018-2029
Figure 100: Middle East & Africa Redundancy Power Supply Module Market Forecast (USD Billion), by South Africa, 2018-2029
Figure 101: Middle East & Africa Redundancy Power Supply Module Market Forecast (USD Billion), by Rest of Middle East & Africa, 2018-2029
List of Tables
Table 1: Global Redundancy Power Supply Module Market Revenue (USD Billion) Forecast, by Segment 1, 2018-2029
Table 2: Global Redundancy Power Supply Module Market Revenue (USD Billion) Forecast, by Segment 2, 2018-2029
Table 3: Global Redundancy Power Supply Module Market Revenue (USD Billion) Forecast, by Segment 3, 2018-2029
Table 4: Global Redundancy Power Supply Module Market Revenue (USD Billion) Forecast, by Region, 2018-2029
Table 5: North America Redundancy Power Supply Module Market Revenue (USD Billion) Forecast, by Segment 1, 2018-2029
Table 6: North America Redundancy Power Supply Module Market Revenue (USD Billion) Forecast, by Segment 2, 2018-2029
Table 7: North America Redundancy Power Supply Module Market Revenue (USD Billion) Forecast, by Segment 3, 2018-2029
Table 8: North America Redundancy Power Supply Module Market Revenue (USD Billion) Forecast, by Country, 2018-2029
Table 9: Europe Redundancy Power Supply Module Market Revenue (USD Billion) Forecast, by Segment 1, 2018-2029
Table 10: Europe Redundancy Power Supply Module Market Revenue (USD Billion) Forecast, by Segment 2, 2018-2029
Table 11: Europe Redundancy Power Supply Module Market Revenue (USD Billion) Forecast, by Segment 3, 2018-2029
Table 12: Europe Redundancy Power Supply Module Market Revenue (USD Billion) Forecast, by Country, 2018-2029
Table 13: Latin America Redundancy Power Supply Module Market Revenue (USD Billion) Forecast, by Segment 1, 2018-2029
Table 14: Latin America Redundancy Power Supply Module Market Revenue (USD Billion) Forecast, by Segment 2, 2018-2029
Table 15: Latin America Redundancy Power Supply Module Market Revenue (USD Billion) Forecast, by Segment 3, 2018-2029
Table 16: Latin America Redundancy Power Supply Module Market Revenue (USD Billion) Forecast, by Country, 2018-2029
Table 17: Asia Pacific Redundancy Power Supply Module Market Revenue (USD Billion) Forecast, by Segment 1, 2018-2029
Table 18: Asia Pacific Redundancy Power Supply Module Market Revenue (USD Billion) Forecast, by Segment 2, 2018-2029
Table 19: Asia Pacific Redundancy Power Supply Module Market Revenue (USD Billion) Forecast, by Segment 3, 2018-2029
Table 20: Asia Pacific Redundancy Power Supply Module Market Revenue (USD Billion) Forecast, by Country, 2018-2029
Table 21: Middle East & Africa Redundancy Power Supply Module Market Revenue (USD Billion) Forecast, by Segment 1, 2018-2029
Table 22: Middle East & Africa Redundancy Power Supply Module Market Revenue (USD Billion) Forecast, by Segment 2, 2018-2029
Table 23: Middle East & Africa Redundancy Power Supply Module Market Revenue (USD Billion) Forecast, by Segment 3, 2018-2029
Table 24: Middle East & Africa Redundancy Power Supply Module Market Revenue (USD Billion) Forecast, by Country, 2018-2029
Research Process
Data Library Research are conducted by industry experts who offer insight on
industry structure, market segmentations technology assessment and competitive landscape (CL), and penetration, as well as on emerging trends. Their analysis is based on primary interviews (~ 80%) and secondary research (~ 20%) as well as years of professional expertise in their respective industries. Adding to this, by analysing historical trends and current market positions, our analysts predict where the market will be headed for the next five years. Furthermore, the varying trends of segment & categories geographically presented are also studied and the estimated based on the primary & secondary research.
In this particular report from the supply side Data Library Research has conducted primary surveys (interviews) with the key level executives (VP, CEO’s, Marketing Director, Business Development Manager
and SOFT) of the companies that active & prominent as well as the midsized organization
FIGURE 1: DLR RESEARH PROCESS
![research-methodology1]()
Primary Research
Extensive primary research was conducted to gain a deeper insight of the market and industry performance. The analysis is based on both primary and secondary research as well as years of professional expertise in the respective industries.
In addition to analysing current and historical trends, our analysts predict where the market is headed over the next five years.
It varies by segment for these categories geographically presented in the list of market tables. Speaking about this particular report we have conducted primary surveys (interviews) with the key level executives (VP, CEO’s, Marketing Director, Business Development Manager and many more) of the major players active in the market.
Secondary Research
Secondary research was mainly used to collect and identify information useful for the extensive, technical, market-oriented, and Friend’s study of the Global Extra Neutral Alcohol. It was also used to obtain key information about major players, market classification and segmentation according to the industry trends, geographical markets, and developments related to the market and technology perspectives. For this study, analysts have gathered information from various credible sources, such as annual reports, sec filings, journals, white papers, SOFT presentations, and company web sites.
Market Size Estimation
Both, top-down and bottom-up approaches were used to estimate and validate the size of the Global market and to estimate the size of various other dependent submarkets in the overall Extra Neutral Alcohol. The key players in the market were identified through secondary research and their market contributions in the respective geographies were determined through primary and secondary research.
Forecast Model
![research-methodology2]()