Self Collimator Market Overview and Analysis

  • The Global Self Collimator Market size is expected to reach USD 2.20 billion in 2033, from USD 0.54 billion in 2026, growing at a CAGR of 12.65% from 2026-2033.

Self Collimator Market

Get Complete Analysis Of The Report - Download Updated Free Sample PDF

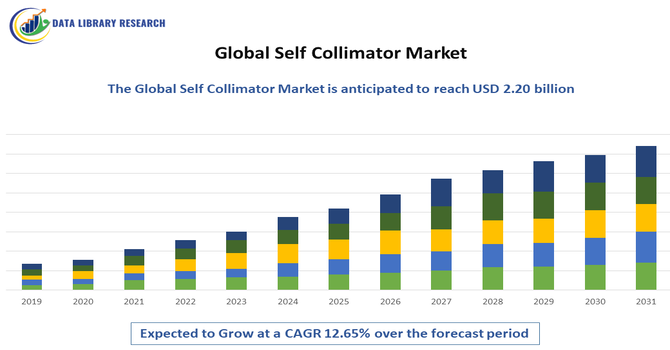
The Global Self Collimator Market refers to the worldwide industry focused on the production, distribution, and sales of self-collimators—precision optical instruments used to measure alignment, angular displacement, and straightness in industrial and metrology applications. This market grows with demand from automotive, aerospace, electronics, and manufacturing sectors where accurate optical measurement is critical. The key drivers include rising quality standards, automation, and technological advancements in optical sensing.

Self Collimator Market Latest Trends

The global self collimator market is evolving with strong growth driven by automation integration and technological innovation. Manufacturers increasingly embed self collimators into automated systems for improved precision and efficiency, while smart models with advanced sensors and data analytics are gaining traction. The key end-use sectors such as aerospace, automotive, medical technology, and manufacturing are pushing demand for high-precision alignment and calibration tools.

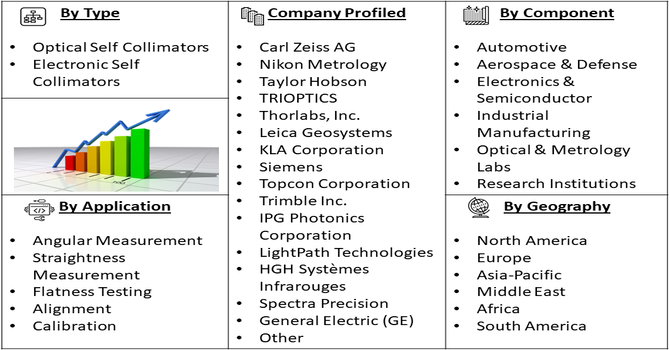
Segmentation: The Global Self Collimator Market is segmented by Type (Optical Self Collimators and Electronic Self Collimators), Technology (Manual, Semi-Automatic, and Fully Automatic Systems), Application (Angular Measurement, Straightness Measurement, Flatness Testing, Alignment, and Calibration), End-Use Industry (Automotive, Aerospace & Defense, Electronics & Semiconductor, Industrial Manufacturing, Optical & Metrology Labs, and Research Institutions), and Geography (North America, Europe, Asia-Pacific, Middle East and Africa, and South America). The report provides the value (in USD million) for the above segments.

Self Collimator Market segment

For Detailed Market Segmentation - Get a Free Sample PDF

Market Drivers:

  • Rising Demand for High-Precision Measurement

The growing need for high-precision measurement and alignment across industries is a major driver of the global self-collimator market. Sectors such as aerospace, automotive, semiconductor manufacturing, and defense require extremely accurate angular and straightness measurements to meet strict quality and safety standards. Self-collimators enable non-contact, high-resolution measurements that reduce errors during production and assembly. As product tolerances become tighter and components more complex, manufacturers increasingly rely on advanced metrology tools. This demand is further amplified by regulatory compliance requirements and the global emphasis on improving manufacturing accuracy and reliability.

  • Expansion of Automation and Smart Manufacturing

The rapid adoption of automation and Industry 4.0 practices is significantly driving the self collimator market. Modern manufacturing environments increasingly integrate digital and automated inspection systems to improve efficiency and reduce human intervention.

Electronic self-collimators with digital outputs, software integration, and real-time monitoring capabilities are well suited for smart factories. For instance, in 2024, Optikos released the ColliMeter measurement system, enabling precise setup and qualification of collimators. The system enhanced automation and smart manufacturing by improving accuracy, reducing manual intervention, and streamlining calibration processes. Its introduction strengthened the global self collimator market by supporting efficient, high-precision production and quality control in advanced industrial and manufacturing applications.

These systems support faster calibration, predictive maintenance, and data-driven decision-making. As manufacturers invest in automated production lines and quality control systems, the demand for precise, reliable, and automation-compatible alignment tools continues to rise, supporting sustained market growth globally.

Market Restraints:

  • High Cost and Technical Complexity

High initial costs and technical complexity act as key restraints on the global self collimator market. Advanced electronic and automated self collimators require significant capital investment, making them less accessible for small and medium-sized enterprises. In addition, operation and maintenance often require skilled personnel, specialized training, and calibration expertise, increasing overall ownership costs. Limited awareness and lack of technical infrastructure in developing regions further restrict adoption. These factors can delay purchasing decisions and encourage users to opt for lower-cost conventional measurement tools, thereby slowing market penetration, especially in price-sensitive markets.

Socioeconomic Impact on Self Collimator Market

The self collimator market contributes to socioeconomic development by enhancing industrial productivity and quality control across critical sectors like aerospace, defense, automotive, and healthcare. Precision measurement tools help minimize manufacturing errors, reducing waste and improving product safety and reliability. Adoption of advanced self collimation technology supports workforce upskilling, as operators require specialized training, creating higher-skill jobs. Increased use in infrastructure and R&D promotes technological competitiveness and supports export-oriented industrial growth. Expanding markets in emerging economies also attract foreign investment and stimulate local supplier ecosystems. Thus, the market drives efficiency, technological advancement, and economic growth within precision-engineering industries.

Segmental Analysis:

  • Optical Self Collimators segment is expected to witness highest growth over the forecast period

The optical self collimators segment is expected to witness the highest growth over the forecast period due to its wide adoption in precision alignment and calibration applications. These instruments offer high accuracy, non-contact measurement, and reliability, making them ideal for metrology labs, aerospace assembly, and optical component testing. Optical self collimators are preferred for their robustness, long operational life, and suitability in environments where electronic interference must be minimized. Growing demand for ultra-precise optical systems, lenses, and mirrors, along with increased quality control requirements in advanced manufacturing, is further accelerating the growth of this segment globally.

  • Fully Automatic Systems segment is expected to witness highest growth over the forecast period

The fully automatic systems segment is expected to witness the highest growth over the forecast period, driven by increasing automation across manufacturing industries. Fully automatic self collimators reduce manual intervention, improve measurement consistency, and enable faster inspection cycles. These systems integrate seamlessly with smart factories, digital quality control platforms, and Industry 4.0 frameworks. Real-time data processing, remote monitoring, and software-based analysis enhance productivity and reduce operational errors. As manufacturers prioritize efficiency, repeatability, and reduced downtime, investment in fully automatic alignment and measurement systems continues to rise, making this segment a key growth contributor to the global market.

  • Angular Measurement segment is expected to witness highest growth over the forecast period

The angular measurement segment is expected to witness the highest growth over the forecast period due to its critical role in precision engineering and alignment processes. Self collimators are extensively used for angular deviation measurement in machine tools, optical assemblies, and mechanical components. Increasing complexity of modern machinery and tighter tolerance requirements are driving demand for accurate angular measurement solutions. Industries such as aerospace, automotive, and semiconductor manufacturing rely heavily on precise angular alignment to ensure performance and safety. The ability of self collimators to deliver high-resolution, non-contact angular measurements positions this segment for strong and sustained growth.

  • Electronics & Semiconductor segment is expected to witness highest growth over the forecast period

The electronics and semiconductor segment is expected to witness the highest growth over the forecast period, supported by rapid advancements in microelectronics and chip manufacturing. Semiconductor fabrication requires extremely precise alignment and calibration to maintain product quality and yield. Self collimators play a vital role in lithography equipment alignment, optical inspection, and precision assembly processes. The growing demand for consumer electronics, electric vehicles, 5G infrastructure, and advanced computing technologies is driving increased semiconductor production worldwide. As fabs invest heavily in advanced metrology tools to meet shrinking node sizes, demand for high-precision self collimators continues to expand.

  • Europe Region is expected to witness highest growth over the forecast period

Europe is expected to witness the highest growth in the global self collimator market over the forecast period, driven by its strong industrial and technological base. The region is home to leading aerospace, automotive, optical, and precision engineering industries that require advanced alignment and measurement solutions.

Increased investment in automation, research and development, and high-end manufacturing supports market expansion. For instance, in 2024, Thorlabs and Infleqtion collaborated to commercialize an optical fiber collimator for quantum applications, originally developed under the UK-funded QT Assemble project. The solution provided high-performance, linearly polarized beams with integrated power monitoring, simplifying design and improving reliability. Its introduction strengthened Europe’s self collimator market by advancing precision optics for emerging quantum technologies, enhancing commercial readiness, and supporting wider adoption across high-tech industries.

Furthermore, the strict quality standards and regulatory compliance further encourage the adoption of advanced metrology tools. Additionally, the presence of key market players and growing focus on smart manufacturing and innovation position Europe as a major growth hub.

Self Collimator Market table

To Learn More About This Report - Request a Free Sample Copy
 

Self Collimator Market Competitive Landscape

The competitive landscape of the global self collimator market is characterized by established optical and metrology instrument manufacturers offering diverse product portfolios. Key players focus on innovation, accuracy, and integration with digital systems to differentiate their offerings. Major companies include Siemens, KLA, Photonics Industrial, Thorlabs, IPG Photonics, LightPath Technologies, HGH Systèmes Infrarouges, TAYLOR HOBSON, Nikon Metrology, and TRIOPTICS, among others. Competition is centered on enhancing precision, expanding into emerging regional markets, and adopting automation-friendly features.

The major players for above market are:

  • Carl Zeiss AG
  • Nikon Metrology
  • Taylor Hobson
  • TRIOPTICS
  • Thorlabs, Inc.
  • Leica Geosystems
  • KLA Corporation
  • Siemens
  • Topcon Corporation
  • Trimble Inc.
  • IPG Photonics Corporation
  • LightPath Technologies
  • HGH Systèmes Infrarouges
  • Spectra Precision
  • General Electric (GE)
  • Logitalent Inc.
  • Terranova Srl
  • TriAngle Optics
  • Photonics Industries International
  • AZoOptics

Recent Development

  • In June 2025, Pac-Dent, Inc. announced the launch of the EzAim® Defend 3-In-1 Collimator Positioning System, expanding its portfolio of x-ray accessories. The introduction strengthened Pac-Dent’s position as an innovative leader in the dental industry by offering a versatile solution designed to enhance accuracy, efficiency, and safety in dental imaging procedures.


  • In March 2025, Coherent Corp. announced the launch of its 2D Collimator Array, an advanced optical assembly designed for optical circuit switches used in next-generation data centers. The solution integrated a 2D lens and fiber array, delivering high port density, precision, and reliability. The company emphasized customization and collaboration, addressing growing demands from AI, machine learning, and high-performance computing applications.


Frequently Asked Questions (FAQ) :

Q1. What are the main growth-driving factors for this market?

The primary driver is the rising demand for high-precision optical alignment in semiconductor manufacturing and aerospace engineering. As components shrink, the need for sub-arcsecond angular measurements grows. Additionally, the expansion of the automotive industry’s LIDAR systems and advanced driver-assistance technologies requires the extreme accuracy that modern electronic autocollimators provide.

Q2. What are the main restraining factors for this market?

The high cost of advanced electronic self-collimators remains a significant barrier for smaller laboratories and manufacturers. Furthermore, these instruments are highly sensitive to environmental vibrations and thermal fluctuations, requiring controlled settings for accurate results. The complexity of operation and the need for highly skilled technicians also limit broader market penetration.

Q3. Which segment is expected to witness high growth?

The Electronic/Digital Autocollimators segment is projected to experience the highest growth. Unlike visual models, electronic versions offer automated data collection, higher resolution, and integration with industrial software. This makes them ideal for high-speed production environments where real-time monitoring of machine tool alignment and angular stability is critical for quality.

Q4. Who are the top major players for this market?

The market is dominated by precision instrumentation specialists including Taylor Hobson (AMETEK), Nikon Metrology, and Möller-Wedel Optical. Other prominent contributors include Keisoku Giken, Davidson Optronics, Trioptics GmbH, and Thorlabs. These companies maintain leadership through specialized optical engineering and the development of dual-axis measurement systems for industrial use.

Q5. Which country is the largest player?

Germany stands as the largest player and hub for the self-collimator market. Its dominance is rooted in a world-class precision optics cluster and a robust high-end manufacturing sector. German companies lead in exporting high-accuracy metrology tools, supported by the country's stringent industrial standards and leadership in Industry 4.0 integration.

Self Collimator MARKET STUDY GLOBAL MARKET ANALYSIS, INSIGHTS AND FORECAST, 2022-2029

    1. Introduction

    • 1.1. Research Scope
    • 1.2. Market Segmentation
    • 1.3. Research Methodology
    • 1.4. Definitions and Assumptions

    2. Executive Summary

      3. Market Dynamics

      • 3.1. Market Drivers
      • 3.2. Market Restraints
      • 3.3. Market Opportunities

      4. Key Insights

      • 4.1. Key Emerging Trends – For Major Countries
      • 4.2. Latest Technological Advancement
      • 4.3. Regulatory Landscape
      • 4.4. Industry SWOT Analysis
      • 4.5. Porters Five Forces Analysis

      5. Global Self Collimator Market Analysis (USD Billion), Insights and Forecast, 2018-2029

      • 5.1. Key Findings / Summary
      • 5.2. Market Analysis, Insights and Forecast – By Segment 1
        • 5.2.1. Sub-Segment 1
        • 5.2.2. Sub-Segment 2
      • 5.3. Market Analysis, Insights and Forecast – By Segment 2
        • 5.3.1. Sub-Segment 1
        • 5.3.2. Sub-Segment 2
        • 5.3.3. Sub-Segment 3
        • 5.3.4. Others
      • 5.4. Market Analysis, Insights and Forecast – By Segment 3
        • 5.4.1. Sub-Segment 1
        • 5.4.2. Sub-Segment 2
        • 5.4.3. Sub-Segment 3
        • 5.4.4. Others
      • 5.5. Market Analysis, Insights and Forecast – By Region
        • 5.5.1. North America
        • 5.5.2. Latin America
        • 5.5.3. Europe
        • 5.5.4. Asia Pacific
        • 5.5.5. Middle East and Africa

      6. North America Self Collimator Market Analysis (USD Billion), Insights and Forecast, 2018-2029

      • 6.1. Key Findings / Summary
      • 6.2. Market Analysis, Insights and Forecast – By Segment 1
        • 6.2.1. Sub-Segment 1
        • 6.2.2. Sub-Segment 2
      • 6.3. Market Analysis, Insights and Forecast – By Segment 2
        • 6.3.1. Sub-Segment 1
        • 6.3.2. Sub-Segment 2
        • 6.3.3. Sub-Segment 3
        • 6.3.4. Others
      • 6.4. Market Analysis, Insights and Forecast – By Segment 3
        • 6.4.1. Sub-Segment 1
        • 6.4.2. Sub-Segment 2
        • 6.4.3. Sub-Segment 3
        • 6.4.4. Others
      • 6.5. Market Analysis, Insights and Forecast – By Country
        • 6.5.1. U.S.
        • 6.5.2. Canada

      7. Latin America Self Collimator Market Analysis (USD Billion), Insights and Forecast, 2018-2029

      • 7.1. Key Findings / Summary
      • 7.2. Market Analysis, Insights and Forecast – By Segment 1
        • 7.2.1. Sub-Segment 1
        • 7.2.2. Sub-Segment 2
      • 7.3. Market Analysis, Insights and Forecast – By Segment 2
        • 7.3.1. Sub-Segment 1
        • 7.3.2. Sub-Segment 2
        • 7.3.3. Sub-Segment 3
        • 7.3.4. Others
      • 7.4. Market Analysis, Insights and Forecast – By Segment 3
        • 7.4.1. Sub-Segment 1
        • 7.4.2. Sub-Segment 2
        • 7.4.3. Sub-Segment 3
        • 7.4.4. Others
      • 7.5. Insights and Forecast – By Country
        • 7.5.1. Brazil
        • 7.5.2. Mexico
        • 7.5.3. Rest of Latin America

      8. Europe Self Collimator Market Analysis (USD Billion), Insights and Forecast, 2018-2029

      • 8.1. Key Findings / Summary
      • 8.2. Market Analysis, Insights and Forecast – By Segment 1
        • 8.2.1. Sub-Segment 1
        • 8.2.2. Sub-Segment 2
      • 8.3. Market Analysis, Insights and Forecast – By Segment 2
        • 8.3.1. Sub-Segment 1
        • 8.3.2. Sub-Segment 2
        • 8.3.3. Sub-Segment 3
        • 8.3.4. Others
      • 8.4. Market Analysis, Insights and Forecast – By Segment 3
        • 8.4.1. Sub-Segment 1
        • 8.4.2. Sub-Segment 2
        • 8.4.3. Sub-Segment 3
        • 8.4.4. Others
      • 8.5. Market Analysis, Insights and Forecast – By Country
        • 8.5.1. UK
        • 8.5.2. Germany
        • 8.5.3. France
        • 8.5.4. Italy
        • 8.5.5. Spain
        • 8.5.6. Russia
        • 8.5.7. Rest of Europe

      9. Asia Pacific Self Collimator Market Analysis (USD Billion), Insights and Forecast, 2018-2029

      • 9.1. Key Findings / Summary
      • 9.2. Market Analysis, Insights and Forecast – By Segment 1
        • 9.2.1. Sub-Segment 1
        • 9.2.2. Sub-Segment 2
      • 9.3. Market Analysis, Insights and Forecast – By Segment 2
        • 9.3.1. Sub-Segment 1
        • 9.3.2. Sub-Segment 2
        • 9.3.3. Sub-Segment 3
        • 9.3.4. Others
      • 9.4. Market Analysis, Insights and Forecast – By Segment 3
        • 9.4.1. Sub-Segment 1
        • 9.4.2. Sub-Segment 2
        • 9.4.3. Sub-Segment 3
        • 9.4.4. Others
      • 9.5. Market Analysis, Insights and Forecast – By Country
        • 9.5.1. China
        • 9.5.2. India
        • 9.5.3. Japan
        • 9.5.4. Australia
        • 9.5.5. South East Asia
        • 9.5.6. Rest of Asia Pacific

      10. Middle East & Africa Self Collimator Market Analysis (USD Billion), Insights and Forecast, 2018-2029

      • 10.1. Key Findings / Summary
      • 10.2. Market Analysis, Insights and Forecast – By Segment 1
        • 10.2.1. Sub-Segment 1
        • 10.2.2. Sub-Segment 2
      • 10.3. Market Analysis, Insights and Forecast – By Segment 2
        • 10.3.1. Sub-Segment 1
        • 10.3.2. Sub-Segment 2
        • 10.3.3. Sub-Segment 3
        • 10.3.4. Others
      • 10.4. Market Analysis, Insights and Forecast – By Segment 3
        • 10.4.1. Sub-Segment 1
        • 10.4.2. Sub-Segment 2
        • 10.4.3. Sub-Segment 3
        • 10.4.4. Others
      • 10.5. Market Analysis, Insights and Forecast – By Country
        • 10.5.1. GCC
        • 10.5.2. South Africa
        • 10.5.3. Rest of Middle East & Africa

      11. Competitive Analysis

      • 11.1. Company Market Share Analysis, 2018
      • 11.2. Key Industry Developments
      • 11.3. Company Profile
        • 11.3.1. Company 1
          • 11.3.1.1. Business Overview
          • 11.3.1.2. Segment 1 & Service Offering
          • 11.3.1.3. Overall Revenue
          • 11.3.1.4. Geographic Presence
          • 11.3.1.5. Recent Development
        *Similar details will be provided for the following companies
        • 11.3.2. Company 2
        • 11.3.3. Company 3
        • 11.3.4. Company 4
        • 11.3.5. Company 5
        • 11.3.6. Company 6
        • 11.3.7. Company 7
        • 11.3.8. Company 8
        • 11.3.9. Company 9
        • 11.3.10. Company 10
        • 11.3.11. Company 11
        • 11.3.12. Company 12
      List of Figures

      Figure 1: Global Self Collimator Market Revenue Breakdown (USD Billion, %) by Region, 2022 & 2029
      Figure 2: Global Self Collimator Market Value Share (%), By Segment 1, 2022 & 2029
      Figure 3: Global Self Collimator Market Forecast (USD Billion), by Sub-Segment 1, 2018-2029
      Figure 4: Global Self Collimator Market Forecast (USD Billion), by Sub-Segment 2, 2018-2029
      Figure 5: Global Self Collimator Market Value Share (%), By Segment 2, 2022 & 2029
      Figure 6: Global Self Collimator Market Forecast (USD Billion), by Sub-Segment 1, 2018-2029
      Figure 7: Global Self Collimator Market Forecast (USD Billion), by Sub-Segment 2, 2018-2029
      Figure 8: Global Self Collimator Market Forecast (USD Billion), by Sub-Segment 3, 2018-2029
      Figure 9: Global Self Collimator Market Forecast (USD Billion), by Others, 2018-2029
      Figure 10: Global Self Collimator Market Value Share (%), By Segment 3, 2022 & 2029
      Figure 11: Global Self Collimator Market Forecast (USD Billion), by Sub-Segment 1, 2018-2029
      Figure 12: Global Self Collimator Market Forecast (USD Billion), by Sub-Segment 2, 2018-2029
      Figure 13: Global Self Collimator Market Forecast (USD Billion), by Sub-Segment 3, 2018-2029
      Figure 14: Global Self Collimator Market Forecast (USD Billion), by Others, 2018-2029
      Figure 15: Global Self Collimator Market Value (USD Billion), by Region, 2022 & 2029
      Figure 16: North America Self Collimator Market Value Share (%), By Segment 1, 2022 & 2029
      Figure 17: North America Self Collimator Market Forecast (USD Billion), by Sub-Segment 1, 2018-2029
      Figure 18: North America Self Collimator Market Forecast (USD Billion), by Sub-Segment 2, 2018-2029
      Figure 19: North America Self Collimator Market Value Share (%), By Segment 2, 2022 & 2029
      Figure 20: North America Self Collimator Market Forecast (USD Billion), by Sub-Segment 1, 2018-2029
      Figure 21: North America Self Collimator Market Forecast (USD Billion), by Sub-Segment 2, 2018-2029
      Figure 22: North America Self Collimator Market Forecast (USD Billion), by Sub-Segment 3, 2018-2029
      Figure 23: North America Self Collimator Market Forecast (USD Billion), by Others, 2018-2029
      Figure 24: North America Self Collimator Market Value Share (%), By Segment 3, 2022 & 2029
      Figure 25: North America Self Collimator Market Forecast (USD Billion), by Sub-Segment 1, 2018-2029
      Figure 26: North America Self Collimator Market Forecast (USD Billion), by Sub-Segment 2, 2018-2029
      Figure 27: North America Self Collimator Market Forecast (USD Billion), by Sub-Segment 3, 2018-2029
      Figure 28: North America Self Collimator Market Forecast (USD Billion), by Others, 2018-2029
      Figure 29: North America Self Collimator Market Forecast (USD Billion), by U.S., 2018-2029
      Figure 30: North America Self Collimator Market Forecast (USD Billion), by Canada, 2018-2029
      Figure 31: Latin America Self Collimator Market Value Share (%), By Segment 1, 2022 & 2029
      Figure 32: Latin America Self Collimator Market Forecast (USD Billion), by Sub-Segment 1, 2018-2029
      Figure 33: Latin America Self Collimator Market Forecast (USD Billion), by Sub-Segment 2, 2018-2029
      Figure 34: Latin America Self Collimator Market Value Share (%), By Segment 2, 2022 & 2029
      Figure 35: Latin America Self Collimator Market Forecast (USD Billion), by Sub-Segment 1, 2018-2029
      Figure 36: Latin America Self Collimator Market Forecast (USD Billion), by Sub-Segment 2, 2018-2029
      Figure 37: Latin America Self Collimator Market Forecast (USD Billion), by Sub-Segment 3, 2018-2029
      Figure 38: Latin America Self Collimator Market Forecast (USD Billion), by Others, 2018-2029
      Figure 39: Latin America Self Collimator Market Value Share (%), By Segment 3, 2022 & 2029
      Figure 40: Latin America Self Collimator Market Forecast (USD Billion), by Sub-Segment 1, 2018-2029
      Figure 41: Latin America Self Collimator Market Forecast (USD Billion), by Sub-Segment 2, 2018-2029
      Figure 42: Latin America Self Collimator Market Forecast (USD Billion), by Sub-Segment 3, 2018-2029
      Figure 43: Latin America Self Collimator Market Forecast (USD Billion), by Others, 2018-2029
      Figure 44: Latin America Self Collimator Market Forecast (USD Billion), by Brazil, 2018-2029
      Figure 45: Latin America Self Collimator Market Forecast (USD Billion), by Mexico, 2018-2029
      Figure 46: Latin America Self Collimator Market Forecast (USD Billion), by Rest of Latin America, 2018-2029
      Figure 47: Europe Self Collimator Market Value Share (%), By Segment 1, 2022 & 2029
      Figure 48: Europe Self Collimator Market Forecast (USD Billion), by Sub-Segment 1, 2018-2029
      Figure 49: Europe Self Collimator Market Forecast (USD Billion), by Sub-Segment 2, 2018-2029
      Figure 50: Europe Self Collimator Market Value Share (%), By Segment 2, 2022 & 2029
      Figure 51: Europe Self Collimator Market Forecast (USD Billion), by Sub-Segment 1, 2018-2029
      Figure 52: Europe Self Collimator Market Forecast (USD Billion), by Sub-Segment 2, 2018-2029
      Figure 53: Europe Self Collimator Market Forecast (USD Billion), by Sub-Segment 3, 2018-2029
      Figure 54: Europe Self Collimator Market Forecast (USD Billion), by Others, 2018-2029
      Figure 55: Europe Self Collimator Market Value Share (%), By Segment 3, 2022 & 2029
      Figure 56: Europe Self Collimator Market Forecast (USD Billion), by Sub-Segment 1, 2018-2029
      Figure 57: Europe Self Collimator Market Forecast (USD Billion), by Sub-Segment 2, 2018-2029
      Figure 58: Europe Self Collimator Market Forecast (USD Billion), by Sub-Segment 3, 2018-2029
      Figure 59: Europe Self Collimator Market Forecast (USD Billion), by Others, 2018-2029
      Figure 60: Europe Self Collimator Market Forecast (USD Billion), by U.K., 2018-2029
      Figure 61: Europe Self Collimator Market Forecast (USD Billion), by Germany, 2018-2029
      Figure 62: Europe Self Collimator Market Forecast (USD Billion), by France, 2018-2029
      Figure 63: Europe Self Collimator Market Forecast (USD Billion), by Italy, 2018-2029
      Figure 64: Europe Self Collimator Market Forecast (USD Billion), by Spain, 2018-2029
      Figure 65: Europe Self Collimator Market Forecast (USD Billion), by Russia, 2018-2029
      Figure 66: Europe Self Collimator Market Forecast (USD Billion), by Rest of Europe, 2018-2029
      Figure 67: Asia Pacific Self Collimator Market Value Share (%), By Segment 1, 2022 & 2029
      Figure 68: Asia Pacific Self Collimator Market Forecast (USD Billion), by Sub-Segment 1, 2018-2029
      Figure 69: Asia Pacific Self Collimator Market Forecast (USD Billion), by Sub-Segment 2, 2018-2029
      Figure 70: Asia Pacific Self Collimator Market Value Share (%), By Segment 2, 2022 & 2029
      Figure 71: Asia Pacific Self Collimator Market Forecast (USD Billion), by Sub-Segment 1, 2018-2029
      Figure 72: Asia Pacific Self Collimator Market Forecast (USD Billion), by Sub-Segment 2, 2018-2029
      Figure 73: Asia Pacific Self Collimator Market Forecast (USD Billion), by Sub-Segment 3, 2018-2029
      Figure 74: Asia Pacific Self Collimator Market Forecast (USD Billion), by Others, 2018-2029
      Figure 75: Asia Pacific Self Collimator Market Value Share (%), By Segment 3, 2022 & 2029
      Figure 76: Asia Pacific Self Collimator Market Forecast (USD Billion), by Sub-Segment 1, 2018-2029
      Figure 77: Asia Pacific Self Collimator Market Forecast (USD Billion), by Sub-Segment 2, 2018-2029
      Figure 78: Asia Pacific Self Collimator Market Forecast (USD Billion), by Sub-Segment 3, 2018-2029
      Figure 79: Asia Pacific Self Collimator Market Forecast (USD Billion), by Others, 2018-2029
      Figure 80: Asia Pacific Self Collimator Market Forecast (USD Billion), by China, 2018-2029
      Figure 81: Asia Pacific Self Collimator Market Forecast (USD Billion), by India, 2018-2029
      Figure 82: Asia Pacific Self Collimator Market Forecast (USD Billion), by Japan, 2018-2029
      Figure 83: Asia Pacific Self Collimator Market Forecast (USD Billion), by Australia, 2018-2029
      Figure 84: Asia Pacific Self Collimator Market Forecast (USD Billion), by Southeast Asia, 2018-2029
      Figure 85: Asia Pacific Self Collimator Market Forecast (USD Billion), by Rest of Asia Pacific, 2018-2029
      Figure 86: Middle East & Africa Self Collimator Market Value Share (%), By Segment 1, 2022 & 2029
      Figure 87: Middle East & Africa Self Collimator Market Forecast (USD Billion), by Sub-Segment 1, 2018-2029
      Figure 88: Middle East & Africa Self Collimator Market Forecast (USD Billion), by Sub-Segment 2, 2018-2029
      Figure 89: Middle East & Africa Self Collimator Market Value Share (%), By Segment 2, 2022 & 2029
      Figure 90: Middle East & Africa Self Collimator Market Forecast (USD Billion), by Sub-Segment 1, 2018-2029
      Figure 91: Middle East & Africa Self Collimator Market Forecast (USD Billion), by Sub-Segment 2, 2018-2029
      Figure 92: Middle East & Africa Self Collimator Market Forecast (USD Billion), by Sub-Segment 3, 2018-2029
      Figure 93: Middle East & Africa Self Collimator Market Forecast (USD Billion), by Others, 2018-2029
      Figure 94: Middle East & Africa Self Collimator Market Value Share (%), By Segment 3, 2022 & 2029
      Figure 95: Middle East & Africa Self Collimator Market Forecast (USD Billion), by Sub-Segment 1, 2018-2029
      Figure 96: Middle East & Africa Self Collimator Market Forecast (USD Billion), by Sub-Segment 2, 2018-2029
      Figure 97: Middle East & Africa Self Collimator Market Forecast (USD Billion), by Sub-Segment 3, 2018-2029
      Figure 98: Middle East & Africa Self Collimator Market Forecast (USD Billion), by Others, 2018-2029
      Figure 99: Middle East & Africa Self Collimator Market Forecast (USD Billion), by GCC, 2018-2029
      Figure 100: Middle East & Africa Self Collimator Market Forecast (USD Billion), by South Africa, 2018-2029
      Figure 101: Middle East & Africa Self Collimator Market Forecast (USD Billion), by Rest of Middle East & Africa, 2018-2029 
      List of Tables
      Table 1: Global Self Collimator Market Revenue (USD Billion) Forecast, by Segment 1, 2018-2029
      Table 2: Global Self Collimator Market Revenue (USD Billion) Forecast, by Segment 2, 2018-2029
      Table 3: Global Self Collimator Market Revenue (USD Billion) Forecast, by Segment 3, 2018-2029
      Table 4: Global Self Collimator Market Revenue (USD Billion) Forecast, by Region, 2018-2029
      Table 5: North America Self Collimator Market Revenue (USD Billion) Forecast, by Segment 1, 2018-2029
      Table 6: North America Self Collimator Market Revenue (USD Billion) Forecast, by Segment 2, 2018-2029
      Table 7: North America Self Collimator Market Revenue (USD Billion) Forecast, by Segment 3, 2018-2029
      Table 8: North America Self Collimator Market Revenue (USD Billion) Forecast, by Country, 2018-2029
      Table 9: Europe Self Collimator Market Revenue (USD Billion) Forecast, by Segment 1, 2018-2029
      Table 10: Europe Self Collimator Market Revenue (USD Billion) Forecast, by Segment 2, 2018-2029
      Table 11: Europe Self Collimator Market Revenue (USD Billion) Forecast, by Segment 3, 2018-2029
      Table 12: Europe Self Collimator Market Revenue (USD Billion) Forecast, by Country, 2018-2029
      Table 13: Latin America Self Collimator Market Revenue (USD Billion) Forecast, by Segment 1, 2018-2029
      Table 14: Latin America Self Collimator Market Revenue (USD Billion) Forecast, by Segment 2, 2018-2029
      Table 15: Latin America Self Collimator Market Revenue (USD Billion) Forecast, by Segment 3, 2018-2029
      Table 16: Latin America Self Collimator Market Revenue (USD Billion) Forecast, by Country, 2018-2029
      Table 17: Asia Pacific Self Collimator Market Revenue (USD Billion) Forecast, by Segment 1, 2018-2029
      Table 18: Asia Pacific Self Collimator Market Revenue (USD Billion) Forecast, by Segment 2, 2018-2029
      Table 19: Asia Pacific Self Collimator Market Revenue (USD Billion) Forecast, by Segment 3, 2018-2029
      Table 20: Asia Pacific Self Collimator Market Revenue (USD Billion) Forecast, by Country, 2018-2029
      Table 21: Middle East & Africa Self Collimator Market Revenue (USD Billion) Forecast, by Segment 1, 2018-2029
      Table 22: Middle East & Africa Self Collimator Market Revenue (USD Billion) Forecast, by Segment 2, 2018-2029
      Table 23: Middle East & Africa Self Collimator Market Revenue (USD Billion) Forecast, by Segment 3, 2018-2029
      Table 24: Middle East & Africa Self Collimator Market Revenue (USD Billion) Forecast, by Country, 2018-2029
      Research Process

      Data Library Research are conducted by industry experts who offer insight on industry structure, market segmentations technology assessment and competitive landscape (CL), and penetration, as well as on emerging trends. Their analysis is based on primary interviews (~ 80%) and secondary research (~ 20%) as well as years of professional expertise in their respective industries. Adding to this, by analysing historical trends and current market positions, our analysts predict where the market will be headed for the next five years. Furthermore, the varying trends of segment & categories geographically presented are also studied and the estimated based on the primary & secondary research.

      In this particular report from the supply side Data Library Research has conducted primary surveys (interviews) with the key level executives (VP, CEO’s, Marketing Director, Business Development Manager and SOFT) of the companies that active & prominent as well as the midsized organization

      FIGURE 1: DLR RESEARH PROCESS

      research-methodology1

      Primary Research

      Extensive primary research was conducted to gain a deeper insight of the market and industry performance. The analysis is based on both primary and secondary research as well as years of professional expertise in the respective industries.

      In addition to analysing current and historical trends, our analysts predict where the market is headed over the next five years.

      It varies by segment for these categories geographically presented in the list of market tables. Speaking about this particular report we have conducted primary surveys (interviews) with the key level executives (VP, CEO’s, Marketing Director, Business Development Manager and many more) of the major players active in the market.

      Secondary Research

      Secondary research was mainly used to collect and identify information useful for the extensive, technical, market-oriented, and Friend’s study of the Global Extra Neutral Alcohol. It was also used to obtain key information about major players, market classification and segmentation according to the industry trends, geographical markets, and developments related to the market and technology perspectives. For this study, analysts have gathered information from various credible sources, such as annual reports, sec filings, journals, white papers, SOFT presentations, and company web sites.

      Market Size Estimation

      Both, top-down and bottom-up approaches were used to estimate and validate the size of the Global market and to estimate the size of various other dependent submarkets in the overall Extra Neutral Alcohol. The key players in the market were identified through secondary research and their market contributions in the respective geographies were determined through primary and secondary research.

      Forecast Model

      research-methodology2