Semiconductor Capital Equipment Market Overview
The semiconductor capital equipment is mainly used in the manufacturing of ICs (Integrated Circuits). The semiconductor capital equipment is commonly used in manufacturing plants called fab or fabrication facilities. Further, semiconductor capital equipment finds its uses in the production of electronic components. The semiconductor capital equipment is classified into two types namely front end or back end. The global Semiconductor Capital Equipment market is expected to rise at a considerable rate in the forecast period. The growing construction of fabrication labs across the world is one of the prime factors that boost the growth of the global Semiconductor Capital Equipment market. In addition, the fabrication labs of semiconductors manufacture an extensive range of semiconductor components and devices including ICs.
Furthermore, with the arrival of technology, the demand for semiconductor components is also rising. Also, the increasing competition has led to factories introducing new fabrication labs for the semiconductor. These factors are majorly contributed to the growth of the Semiconductor Capital Equipment market at a large scale. Moreover, the growing sales of most electronic devices such as smartphones, tablets, and laptops are projected to intensify the growth of the global Semiconductor Capital Equipment market during the forecast period.
On the downside, the fluctuating cost of copper and silicon, which are used as raw materials in semiconductor components is a major limitation on the semiconductor capital equipment market's growth. Furthermore, the high initial cost of setup and installation as a result of the limited number of manufacturers of manufacturing machines and setup has a negative impact on the semiconductor capital equipment industry.
| Report Metric | Details |
| Market size available for years | 2023–2030 |
| Base year considered | 2023 |
| Forecast period | 2024–2030 |
| Forecast unit | Value (USD Million) |
| Segments covered | Type, Application, Industry Vertical, and Region |
| Regions covered | North America (the U.S. and Canada), Europe (UK, Germany, France, Italy, Spain, Russia, Rest of Europe), Asia-Pacific (China, India, Japan, Australia, South East Asia, Rest of Asia Pacific), Latin America and the Middle East and Africa (Brazil, Saudi Arabia, UAE, Rest of LAMEA) |
| Companies covered | Applied Materials, Inc., Concurrent Design, Inc., EV Group, ASML Holding, Hitachi High-Technologies, Lam Research Corporation, Tokyo Electron Limited, Advantest, AMEC, and ACCRETECH – Tokyo Seimitsu. |
Covid-19 Impact on Semiconductor Capital Equipment Market
Like many other industries, COVID-19 badly knocked the electronic and semiconductor industries. This unprecedented event has impacted nearly 230 countries in just a few weeks, resulting in the forced shutdown of manufacturing and transportation activities within and across the countries. This has directly affected the overall sector's growth. It is estimated that COVID-19 to leave more than USD 30 billion impacts on the electronics and semiconductor industry. The sector is majorly affected due to transport restrictions on major electronics and semiconductor raw material providers. However, the emerging need for semiconductors in several industries will offer rapid market recovery over the future period.
Semiconductor Capital Equipment Market Segment Overview
Based on Type, the Automated Test Equipment segment is anticipated to grow at a significant rate in the coming years. This is due to the increasing number of connected devices and consumer electronics. By Application, Wafer Processing is one of the largest segments in the market. Wafer Processing is a procedure composed of many repeated sequential processes to produce complete electrical or photonic circuits on semiconductor wafers. It is used to build components with the necessary electrical structures.
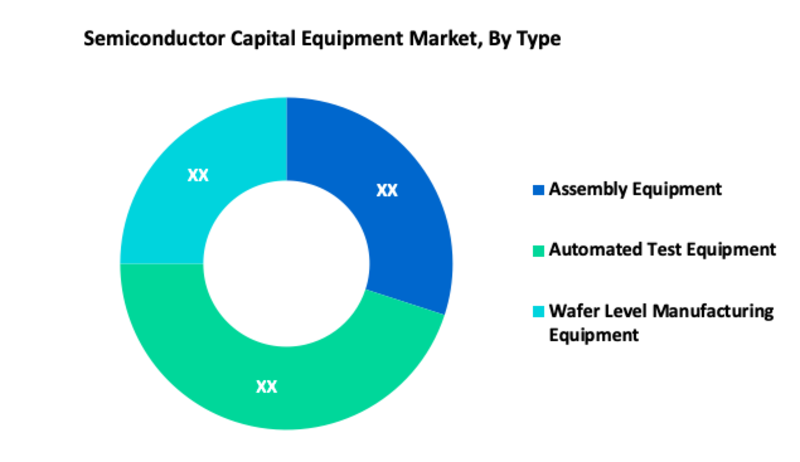
Semiconductor Capital Equipment Market, By Type
· Assembly Equipment
· Automated Test Equipment
· Wafer Level Manufacturing Equipment
Semiconductor Capital Equipment Market, By Application
· Wafer Processing
· Surface Conditioning
· Chemical Mechanical Planarization
· Chemical Vapor Deposition
· Assembly and Packaging Equipment
Semiconductor Capital Equipment Market, By Industry Vertical
· Consumer electronics
· Healthcare
· Automotive
· IT & Telecommunication
Semiconductor Capital Equipment Market Regional Overview
In terms of region, Asia Pacific holds the largest share in the global Semiconductor Capital Equipment market. This can be mainly attributed to the increasing usage of semiconductor capital equipment in the consumer electronics industry. In addition, countries such as India, China, and Japan are contributing majorly to the growth of the semiconductor capital equipment market.
Semiconductor Capital Equipment Market, By Geography
· North America (US & Canada)
· Europe (UK, Germany, France, Italy, Spain, Russia & Rest of Europe)
· Asia-Pacific (Japan, China, India, Australia, & South Korea, & Rest of Asia-Pacific)
· LAMEA (Brazil, Saudi Arabia, UAE & Rest of LAMEA)
Semiconductor Capital Equipment Market Competitor overview
Some key developments and strategies adopted by manufacturers in Semiconductor Capital Equipment are highlighted below.
· In October 2021, YES (Yield Engineering Systems, Inc.), a leading manufacturer of process equipment for semiconductor advanced packaging, life sciences and "More-than-Moore" applications, announced that it has purchased the semiconductor equipment business of Swedish heating technology provider Kanthal.
· In October 2021, Graycliff Partners LP announced that it has completed an equity investment and recapitalization of CHawk Technology International a manufacturer of precision plastic and metal components and assemblies for the semiconductor capital equipment, aerospace, and medical device industries.
Semiconductor Capital Equipment Market, Key Players
· Applied Materials, Inc.
· Concurrent Design, Inc.
· EV Group
· ASML Holding
· Hitachi High-Technologies
· Lam Research Corporation
· Tokyo Electron Limited
· Advantest
· AMEC
· ACCRETECH – Tokyo Seimitsu
Q1. What are the driving factors for the Semiconductor Capital Equipment market?
The technological advancements in circuitry board technology along with the rising construction of fabrication facilities are some major factors that boost the growth of the Semiconductor Capital Equipment market.
Q2. What are the restraining factors for the Semiconductor Capital Equipment market?
The fluctuating cost of copper and silicon and the high initial cost of setup and installation are some major factors that hamper the growth of the global Semiconductor Capital Equipment market.
Q3. Which Segments are covered in the Semiconductor Capital Equipment market report?
Type, Application, Industry Vertical, and Region, these segments are covered in the Semiconductor Capital Equipment market report.
Q4. Which segment is projected to hold the largest share in the Semiconductor Capital Equipment Market?
The Automated Test Equipment segment is projected to hold the largest share in the Semiconductor Capital Equipment Market.
Q5. Which are the prominent players in the Semiconductor Capital Equipment Market?
Applied Materials, Inc., Concurrent Design, Inc., EV Group, ASML Holding, Hitachi High-Technologies, Lam Research Corporation, Tokyo Electron Limited, Advantest, AMEC, and ACCRETECH – Tokyo Seimitsu. are some key players in the Semiconductor Capital Equipment Market.
Data Library Research are conducted by industry experts who offer insight on industry structure, market segmentations technology assessment and competitive landscape (CL), and penetration, as well as on emerging trends. Their analysis is based on primary interviews (~ 80%) and secondary research (~ 20%) as well as years of professional expertise in their respective industries. Adding to this, by analysing historical trends and current market positions, our analysts predict where the market will be headed for the next five years. Furthermore, the varying trends of segment & categories geographically presented are also studied and the estimated based on the primary & secondary research.
In this particular report from the supply side Data Library Research has conducted primary surveys (interviews) with the key level executives (VP, CEO’s, Marketing Director, Business Development Manager and SOFT) of the companies that active & prominent as well as the midsized organization
FIGURE 1: DLR RESEARH PROCESS
Extensive primary research was conducted to gain a deeper insight of the market and industry performance. The analysis is based on both primary and secondary research as well as years of professional expertise in the respective industries.
In addition to analysing current and historical trends, our analysts predict where the market is headed over the next five years.
It varies by segment for these categories geographically presented in the list of market tables. Speaking about this particular report we have conducted primary surveys (interviews) with the key level executives (VP, CEO’s, Marketing Director, Business Development Manager and many more) of the major players active in the market.
Secondary ResearchSecondary research was mainly used to collect and identify information useful for the extensive, technical, market-oriented, and Friend’s study of the Global Extra Neutral Alcohol. It was also used to obtain key information about major players, market classification and segmentation according to the industry trends, geographical markets, and developments related to the market and technology perspectives. For this study, analysts have gathered information from various credible sources, such as annual reports, sec filings, journals, white papers, SOFT presentations, and company web sites.
Market Size EstimationBoth, top-down and bottom-up approaches were used to estimate and validate the size of the Global market and to estimate the size of various other dependent submarkets in the overall Extra Neutral Alcohol. The key players in the market were identified through secondary research and their market contributions in the respective geographies were determined through primary and secondary research.
Forecast Model