Ship Charging System Market Overview and Analysis

The Global Electric Ship Market (encompassing charging systems) is expanding rapidly, projected to reach around USD 18.73 billion by 2032, up from approximately USD 3.96 billion in 2025. This substantial market growth is backed by a Compound Annual Growth Rate (CAGR) of about 18.86% over the 2024–2032 forecast period, driven by stringent global decarbonization regulations and continuous battery technology advancements.

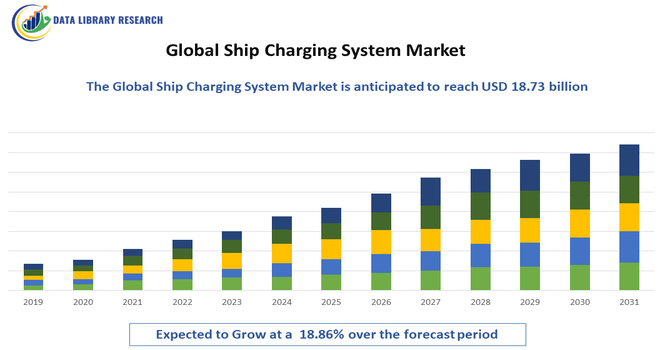
The Global Ship Charging System Market is experiencing strong growth driven by the rapid electrification of marine vessels, rising adoption of hybrid and fully electric ships, and the maritime industry’s shift toward low-emission and zero-emission transportation. Increasing global regulations targeting decarbonization—such as IMO emission reduction mandates—are compelling ports and ship operators to invest in advanced on-shore charging and power supply infrastructure.

Ship Charging System Market Latest Trends

The global ship charging system market is being shaped by several significant trends as the maritime industry accelerates its transition toward electrification and sustainability. A major trend is the advancement and adoption of high-power, ultra-fast charging technologies that reduce vessel downtime and enhance operational efficiency, making electric and hybrid ships more commercially viable. There is also a growing integration of renewable energy sources into charging infrastructure, enabling ports to power vessels with cleaner electricity and align with global decarbonization goals. Public-private partnerships and government incentives are increasingly facilitating investments in charging infrastructure, particularly in green port initiatives across Europe, Asia Pacific, and North America.

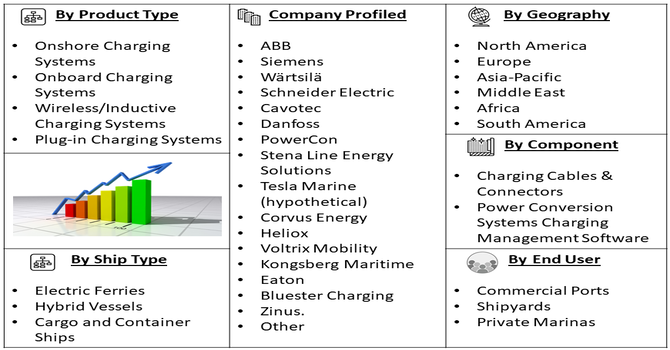
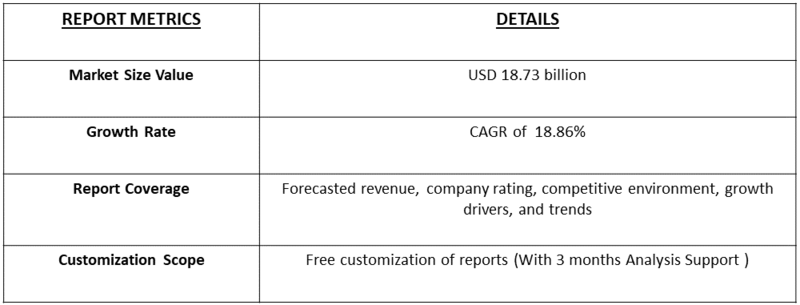
Segmentation: Global Ship Charging System Market is segmented By Charging Type (Onshore Charging Systems, Onboard Charging Systems, Wireless/Inductive Charging Systems, Plug-in Charging Systems), Installation Type (Fixed Charging Stations, Mobile/Portable Charging Units, Floating Charging Platforms), Ship Type (Electric Ferries, Hybrid Vessels, Cargo and Container Ships), By End-User (Commercial Ports, Shipyards, Private Marinas), Component (Charging Cables & Connectors, Power Conversion Systems, Charging Management Software), and Geography (North America, Europe, Asia-Pacific, Middle East and Africa, and South America). The report provides the value (in USD million) for the above segments.

Market Drivers:

  • Growing Electrification of Marine Vessels and Shift Toward Zero-Emission Shipping

A primary driver of the Global Ship Charging System Market is the rapid shift toward electric and hybrid vessels as the maritime industry aims to reduce its carbon footprint. Governments and international bodies, particularly the International Maritime Organization (IMO), have introduced strict emission-reduction regulations that require ships to significantly lower greenhouse gas emissions by 2030 and 2050. This is forcing shipping companies, ports, and vessel manufacturers to adopt cleaner propulsion technologies, including battery-powered ships. Electric ferries, patrol boats, short-range commercial vessels, and port service boats are among the earliest adopters, creating substantial demand for advanced charging infrastructure.

  • Expansion of Smart and Green Ports Supporting Shore Power (Cold Ironing) Adoption

The rapid evolution of ports into smart, sustainable, and energy-efficient hubs is another major factor driving the ship charging system market. Ports worldwide are adopting shore-to-ship power systems (cold ironing) that allow vessels to plug into the power grid while docked, significantly reducing air pollution, noise, and fuel consumption. This trend is driven by increasing pressure from environmental agencies and urban communities located near port areas.

Many governments are offering incentives, grants, and regulatory support to accelerate the deployment of shore power infrastructure in commercial ports, naval bases, and marinas. Green port initiatives—especially in the U.S., Canada, China, South Korea, Germany, Norway, and the Netherlands—are investing heavily in high-capacity charging systems integrated with renewable energy and smart grid technologies. These systems not only reduce emissions but also improve port efficiency, encourage more electric vessel visits, and support the long-term transition to clean maritime logistics. As global port modernization intensifies, the adoption of ship charging systems is set to rise steadily.

Market Restraints:

  • High Initial Capital Investment for Infrastructure Development

One of the most significant restraints in the ship charging system market is the high upfront cost associated with installing large-scale charging infrastructure at ports and marinas. Building high-capacity charging stations—especially megawatt-level systems required for commercial vessels—demands substantial investment in equipment, transformers, cables, grid upgrades, and safety systems. Many ports also need to reinforce or modernize their existing electrical infrastructure to handle the increased power demand, which significantly raises overall expenditure. These high costs are particularly challenging for small and medium-sized ports and for developing economies where budgets for green port initiatives are limited.

Socioeconomic Impact on Ship Charging System Market

The socioeconomic impact of the Global Ship Charging System Market is increasingly significant as maritime industries transition toward cleaner energy. Growing investment in electric and hybrid vessels stimulates job creation in engineering, manufacturing, and port-side infrastructure development. This shift encourages technological innovation, supporting high-skill employment and new business opportunities in battery systems, power electronics, and smart-grid integration. For port communities, expanded charging infrastructure reduces emissions, improving public health and environmental quality. Developing nations participating in this market gain access to modern maritime technologies, strengthening trade competitiveness.

Segmental Analysis:

  • Fixed Charging Stations segment is expected to witness highest growth over the forecast period

Fixed Charging Stations dominate installations as major commercial ports require permanent, high-capacity charging points to support frequent vessel traffic. These systems offer stable power delivery, high reliability, and seamless integration with port electrical grids. They are particularly favored for busy ferry terminals and cargo ports where consistent vessel operations demand continuous service availability. Growing adoption of megawatt-scale fixed stations further increases this segment’s market valuation, supporting long-term port modernization plans.

  • Electric Ferries segment is expected to witness highest growth over the forecast period

Electric Ferries represent one of the fastest-growing ship types adopting charging systems due to rising demand for clean public transport and short-distance maritime connectivity. Countries in Europe and Asia-Pacific are heavily investing in all-electric ferry fleets to cut emissions, noise, and operational costs. Frequent docking patterns make ferries ideal for fast charging and automated systems. This segment contributes significantly to overall market value as governments support ferry electrification with large-scale funding initiatives.

  • Commercial Ports segment is expected to witness highest growth over the forecast period

Commercial Ports account for the largest share of end-user demand since they handle high volumes of passenger and cargo vessels that increasingly rely on shore power. Ports are under pressure to comply with emission reduction regulations and improve air quality in surrounding urban areas, driving the adoption of advanced charging infrastructure. Continuous upgrades, grid expansions, and sustainability mandates make commercial ports the strongest revenue-generating segment in USD million terms.

  • Charging Cables & Connectors segment is expected to witness highest growth over the forecast period

Charging Cables & Connectors form an essential component segment, enabling the safe and efficient transfer of high-power electricity from shore systems to vessels. As charging capacities increase—especially with megawatt charging systems—the need for durable, heat-resistant, and standardized cables grows rapidly. This segment gains steady revenue due to ongoing port retrofits, rising electric vessel adoption, and the requirement for frequent replacement and upgrading of cables in high-use environments.

  • North America segment is expected to witness highest growth over the forecast period

North America remains a significant regional market driven by investments in sustainable port infrastructure, particularly in the United States and Canada. Major coastal cities are adopting shore power to reduce emissions from busy ports like Los Angeles, Long Beach, Vancouver, and Seattle. Government-backed green port policies, funding for electrification, and increasing deployment of electric ferries contribute to continuous growth in the regional market value.

In addition to port electrification efforts, North America benefits from strong collaboration between government agencies, utility providers, and maritime operators to standardize and expand ship charging capabilities. For instance, in December 2023, ABB’s deployment of the world’s first megawatt charging system for Auckland Transport demonstrated how standardized, high-capacity solutions advanced global confidence in electric ferry technology. This progress positively influenced North America’s Ship Charging System Market, as ports and operators drew on the project’s success to accelerate electrification plans, strengthen investment in MCS-compatible infrastructure, and validate the competitiveness of large-scale electric and hybrid vessels.

Research institutions and technology firms in the region are accelerating advancements in high-capacity charging solutions, supporting faster turnaround times for commercial vessels. The rise of autonomous and hybrid tugboats, alongside electrified short-sea shipping routes, further boosts demand for reliable charging infrastructure.

Ship Charging System Market Competitive Landscape

The Global Ship Charging System Market features a competitive landscape driven by rapid electrification of marine transportation and rising investments in green port infrastructure. Leading companies are focusing on developing high-power shore-to-ship charging solutions, automated charging technologies, and integrated smart grid systems to support the growing adoption of electric and hybrid vessels. Strategic partnerships between technology providers, port authorities, and shipbuilders are accelerating innovation and large-scale deployments. Companies are also expanding their global presence through collaborations, new product launches, and upgrades to comply with international marine standards. As ports worldwide continue their transition toward sustainable operations, market players are intensifying efforts to offer reliable, cost-effective, and scalable charging solutions across diverse vessel types and port environments.

Key Companies:

  • ABB • Siemens
  • Wärtsilä
  • Schneider Electric
  • Cavotec
  • Danfoss
  • PowerCon
  • Stena Line Energy Solutions
  • Tesla Marine (hypothetical)
  • Corvus Energy
  • Heliox
  • Voltrix Mobility
  • Kongsberg Maritime
  • Eaton
  • Bluester Charging
  • Zinus
  • MJR Power & Automation
  • Plug Power Marine
  • Wärtsilä SAM Electronics
  • Rolls-Royce Power Systems

Recent Development

  • In January 2024, Artemis Technologies’ work on the world’s first retrofit E-CTV, featuring both onshore and offshore wind-powered charging, advanced the Global Ship Charging System Market by proving the feasibility of dual-mode charging and large-battery retrofits, encouraging wider investment in versatile, zero-emission maritime charging solutions.


  • In June 2025, Kempower’s rollout of its MORE Power solution, delivering 1.2 MW of dynamic charging across multiple points, strengthened the Global Ship Charging System Market by showcasing scalable, high-capacity DC technology that supported larger electric vessels and encouraged wider adoption of megawatt-level maritime charging infrastructure.


Frequently Asked Questions (FAQ) :

Q1. What are the main growth-driving factors for this market?

The market is driven by strict global environmental rules from organizations like the IMO, which demand maritime decarbonization. This push forces ports and vessels to adopt shore power, or "cold ironing," dramatically reducing harmful emissions and noise in port cities. The rising trend of electric and hybrid ships also boosts demand for specialized charging solutions.

Q2. What are the main restraining factors for this market?

The biggest challenges are the extremely high initial costs for infrastructure. Installing complex high-voltage charging systems at ports and adapting ships for compatibility requires major capital investment. Another restraint is the lack of a single, standardized global interface, which makes it complicated for ships to plug in at different ports worldwide.

Q3. Which segment is expected to witness high growth?

The fastest growth is anticipated in the Shore-to-Ship segment, primarily due to expanding government regulations that mandate ships shut off their engines in port. Regionally, Asia Pacific is projected to see the highest growth rate. This surge is fueled by massive port modernization efforts and stricter environmental policies across busy maritime nations like China and South Korea.

Q4. Who are the top major players for this market?

The market is led by major industrial and electrical technology companies that specialize in high-power infrastructure. Key players include ABB, Siemens, Schneider Electric, Wärtsilä, and Cavotec. These companies provide the essential electrical distribution and connection systems needed to link ships to the port's power grid safely and efficiently.

Q5. Which country is the largest player?

North America currently holds the largest share of the market revenue. This is primarily driven by early adoption and strict environmental regulations, especially in the US and Canada, which were among the first to mandate shore power use in their major ports. Europe is also a significant market due to its strong governmental focus on green shipping initiatives.

Ship Charging System MARKET STUDY GLOBAL MARKET ANALYSIS, INSIGHTS AND FORECAST, 2022-2029

    1. Introduction

    • 1.1. Research Scope
    • 1.2. Market Segmentation
    • 1.3. Research Methodology
    • 1.4. Definitions and Assumptions

    2. Executive Summary

      3. Market Dynamics

      • 3.1. Market Drivers
      • 3.2. Market Restraints
      • 3.3. Market Opportunities

      4. Key Insights

      • 4.1. Key Emerging Trends – For Major Countries
      • 4.2. Latest Technological Advancement
      • 4.3. Regulatory Landscape
      • 4.4. Industry SWOT Analysis
      • 4.5. Porters Five Forces Analysis

      5. Global Ship Charging System Market Analysis (USD Billion), Insights and Forecast, 2018-2029

      • 5.1. Key Findings / Summary
      • 5.2. Market Analysis, Insights and Forecast – By Segment 1
        • 5.2.1. Sub-Segment 1
        • 5.2.2. Sub-Segment 2
      • 5.3. Market Analysis, Insights and Forecast – By Segment 2
        • 5.3.1. Sub-Segment 1
        • 5.3.2. Sub-Segment 2
        • 5.3.3. Sub-Segment 3
        • 5.3.4. Others
      • 5.4. Market Analysis, Insights and Forecast – By Segment 3
        • 5.4.1. Sub-Segment 1
        • 5.4.2. Sub-Segment 2
        • 5.4.3. Sub-Segment 3
        • 5.4.4. Others
      • 5.5. Market Analysis, Insights and Forecast – By Region
        • 5.5.1. North America
        • 5.5.2. Latin America
        • 5.5.3. Europe
        • 5.5.4. Asia Pacific
        • 5.5.5. Middle East and Africa

      6. North America Ship Charging System Market Analysis (USD Billion), Insights and Forecast, 2018-2029

      • 6.1. Key Findings / Summary
      • 6.2. Market Analysis, Insights and Forecast – By Segment 1
        • 6.2.1. Sub-Segment 1
        • 6.2.2. Sub-Segment 2
      • 6.3. Market Analysis, Insights and Forecast – By Segment 2
        • 6.3.1. Sub-Segment 1
        • 6.3.2. Sub-Segment 2
        • 6.3.3. Sub-Segment 3
        • 6.3.4. Others
      • 6.4. Market Analysis, Insights and Forecast – By Segment 3
        • 6.4.1. Sub-Segment 1
        • 6.4.2. Sub-Segment 2
        • 6.4.3. Sub-Segment 3
        • 6.4.4. Others
      • 6.5. Market Analysis, Insights and Forecast – By Country
        • 6.5.1. U.S.
        • 6.5.2. Canada

      7. Latin America Ship Charging System Market Analysis (USD Billion), Insights and Forecast, 2018-2029

      • 7.1. Key Findings / Summary
      • 7.2. Market Analysis, Insights and Forecast – By Segment 1
        • 7.2.1. Sub-Segment 1
        • 7.2.2. Sub-Segment 2
      • 7.3. Market Analysis, Insights and Forecast – By Segment 2
        • 7.3.1. Sub-Segment 1
        • 7.3.2. Sub-Segment 2
        • 7.3.3. Sub-Segment 3
        • 7.3.4. Others
      • 7.4. Market Analysis, Insights and Forecast – By Segment 3
        • 7.4.1. Sub-Segment 1
        • 7.4.2. Sub-Segment 2
        • 7.4.3. Sub-Segment 3
        • 7.4.4. Others
      • 7.5. Insights and Forecast – By Country
        • 7.5.1. Brazil
        • 7.5.2. Mexico
        • 7.5.3. Rest of Latin America

      8. Europe Ship Charging System Market Analysis (USD Billion), Insights and Forecast, 2018-2029

      • 8.1. Key Findings / Summary
      • 8.2. Market Analysis, Insights and Forecast – By Segment 1
        • 8.2.1. Sub-Segment 1
        • 8.2.2. Sub-Segment 2
      • 8.3. Market Analysis, Insights and Forecast – By Segment 2
        • 8.3.1. Sub-Segment 1
        • 8.3.2. Sub-Segment 2
        • 8.3.3. Sub-Segment 3
        • 8.3.4. Others
      • 8.4. Market Analysis, Insights and Forecast – By Segment 3
        • 8.4.1. Sub-Segment 1
        • 8.4.2. Sub-Segment 2
        • 8.4.3. Sub-Segment 3
        • 8.4.4. Others
      • 8.5. Market Analysis, Insights and Forecast – By Country
        • 8.5.1. UK
        • 8.5.2. Germany
        • 8.5.3. France
        • 8.5.4. Italy
        • 8.5.5. Spain
        • 8.5.6. Russia
        • 8.5.7. Rest of Europe

      9. Asia Pacific Ship Charging System Market Analysis (USD Billion), Insights and Forecast, 2018-2029

      • 9.1. Key Findings / Summary
      • 9.2. Market Analysis, Insights and Forecast – By Segment 1
        • 9.2.1. Sub-Segment 1
        • 9.2.2. Sub-Segment 2
      • 9.3. Market Analysis, Insights and Forecast – By Segment 2
        • 9.3.1. Sub-Segment 1
        • 9.3.2. Sub-Segment 2
        • 9.3.3. Sub-Segment 3
        • 9.3.4. Others
      • 9.4. Market Analysis, Insights and Forecast – By Segment 3
        • 9.4.1. Sub-Segment 1
        • 9.4.2. Sub-Segment 2
        • 9.4.3. Sub-Segment 3
        • 9.4.4. Others
      • 9.5. Market Analysis, Insights and Forecast – By Country
        • 9.5.1. China
        • 9.5.2. India
        • 9.5.3. Japan
        • 9.5.4. Australia
        • 9.5.5. South East Asia
        • 9.5.6. Rest of Asia Pacific

      10. Middle East & Africa Ship Charging System Market Analysis (USD Billion), Insights and Forecast, 2018-2029

      • 10.1. Key Findings / Summary
      • 10.2. Market Analysis, Insights and Forecast – By Segment 1
        • 10.2.1. Sub-Segment 1
        • 10.2.2. Sub-Segment 2
      • 10.3. Market Analysis, Insights and Forecast – By Segment 2
        • 10.3.1. Sub-Segment 1
        • 10.3.2. Sub-Segment 2
        • 10.3.3. Sub-Segment 3
        • 10.3.4. Others
      • 10.4. Market Analysis, Insights and Forecast – By Segment 3
        • 10.4.1. Sub-Segment 1
        • 10.4.2. Sub-Segment 2
        • 10.4.3. Sub-Segment 3
        • 10.4.4. Others
      • 10.5. Market Analysis, Insights and Forecast – By Country
        • 10.5.1. GCC
        • 10.5.2. South Africa
        • 10.5.3. Rest of Middle East & Africa

      11. Competitive Analysis

      • 11.1. Company Market Share Analysis, 2018
      • 11.2. Key Industry Developments
      • 11.3. Company Profile
        • 11.3.1. Company 1
          • 11.3.1.1. Business Overview
          • 11.3.1.2. Segment 1 & Service Offering
          • 11.3.1.3. Overall Revenue
          • 11.3.1.4. Geographic Presence
          • 11.3.1.5. Recent Development
        *Similar details will be provided for the following companies
        • 11.3.2. Company 2
        • 11.3.3. Company 3
        • 11.3.4. Company 4
        • 11.3.5. Company 5
        • 11.3.6. Company 6
        • 11.3.7. Company 7
        • 11.3.8. Company 8
        • 11.3.9. Company 9
        • 11.3.10. Company 10
        • 11.3.11. Company 11
        • 11.3.12. Company 12
      List of Figures

      Figure 1: Global Ship Charging System Market Revenue Breakdown (USD Billion, %) by Region, 2022 & 2029
      Figure 2: Global Ship Charging System Market Value Share (%), By Segment 1, 2022 & 2029
      Figure 3: Global Ship Charging System Market Forecast (USD Billion), by Sub-Segment 1, 2018-2029
      Figure 4: Global Ship Charging System Market Forecast (USD Billion), by Sub-Segment 2, 2018-2029
      Figure 5: Global Ship Charging System Market Value Share (%), By Segment 2, 2022 & 2029
      Figure 6: Global Ship Charging System Market Forecast (USD Billion), by Sub-Segment 1, 2018-2029
      Figure 7: Global Ship Charging System Market Forecast (USD Billion), by Sub-Segment 2, 2018-2029
      Figure 8: Global Ship Charging System Market Forecast (USD Billion), by Sub-Segment 3, 2018-2029
      Figure 9: Global Ship Charging System Market Forecast (USD Billion), by Others, 2018-2029
      Figure 10: Global Ship Charging System Market Value Share (%), By Segment 3, 2022 & 2029
      Figure 11: Global Ship Charging System Market Forecast (USD Billion), by Sub-Segment 1, 2018-2029
      Figure 12: Global Ship Charging System Market Forecast (USD Billion), by Sub-Segment 2, 2018-2029
      Figure 13: Global Ship Charging System Market Forecast (USD Billion), by Sub-Segment 3, 2018-2029
      Figure 14: Global Ship Charging System Market Forecast (USD Billion), by Others, 2018-2029
      Figure 15: Global Ship Charging System Market Value (USD Billion), by Region, 2022 & 2029
      Figure 16: North America Ship Charging System Market Value Share (%), By Segment 1, 2022 & 2029
      Figure 17: North America Ship Charging System Market Forecast (USD Billion), by Sub-Segment 1, 2018-2029
      Figure 18: North America Ship Charging System Market Forecast (USD Billion), by Sub-Segment 2, 2018-2029
      Figure 19: North America Ship Charging System Market Value Share (%), By Segment 2, 2022 & 2029
      Figure 20: North America Ship Charging System Market Forecast (USD Billion), by Sub-Segment 1, 2018-2029
      Figure 21: North America Ship Charging System Market Forecast (USD Billion), by Sub-Segment 2, 2018-2029
      Figure 22: North America Ship Charging System Market Forecast (USD Billion), by Sub-Segment 3, 2018-2029
      Figure 23: North America Ship Charging System Market Forecast (USD Billion), by Others, 2018-2029
      Figure 24: North America Ship Charging System Market Value Share (%), By Segment 3, 2022 & 2029
      Figure 25: North America Ship Charging System Market Forecast (USD Billion), by Sub-Segment 1, 2018-2029
      Figure 26: North America Ship Charging System Market Forecast (USD Billion), by Sub-Segment 2, 2018-2029
      Figure 27: North America Ship Charging System Market Forecast (USD Billion), by Sub-Segment 3, 2018-2029
      Figure 28: North America Ship Charging System Market Forecast (USD Billion), by Others, 2018-2029
      Figure 29: North America Ship Charging System Market Forecast (USD Billion), by U.S., 2018-2029
      Figure 30: North America Ship Charging System Market Forecast (USD Billion), by Canada, 2018-2029
      Figure 31: Latin America Ship Charging System Market Value Share (%), By Segment 1, 2022 & 2029
      Figure 32: Latin America Ship Charging System Market Forecast (USD Billion), by Sub-Segment 1, 2018-2029
      Figure 33: Latin America Ship Charging System Market Forecast (USD Billion), by Sub-Segment 2, 2018-2029
      Figure 34: Latin America Ship Charging System Market Value Share (%), By Segment 2, 2022 & 2029
      Figure 35: Latin America Ship Charging System Market Forecast (USD Billion), by Sub-Segment 1, 2018-2029
      Figure 36: Latin America Ship Charging System Market Forecast (USD Billion), by Sub-Segment 2, 2018-2029
      Figure 37: Latin America Ship Charging System Market Forecast (USD Billion), by Sub-Segment 3, 2018-2029
      Figure 38: Latin America Ship Charging System Market Forecast (USD Billion), by Others, 2018-2029
      Figure 39: Latin America Ship Charging System Market Value Share (%), By Segment 3, 2022 & 2029
      Figure 40: Latin America Ship Charging System Market Forecast (USD Billion), by Sub-Segment 1, 2018-2029
      Figure 41: Latin America Ship Charging System Market Forecast (USD Billion), by Sub-Segment 2, 2018-2029
      Figure 42: Latin America Ship Charging System Market Forecast (USD Billion), by Sub-Segment 3, 2018-2029
      Figure 43: Latin America Ship Charging System Market Forecast (USD Billion), by Others, 2018-2029
      Figure 44: Latin America Ship Charging System Market Forecast (USD Billion), by Brazil, 2018-2029
      Figure 45: Latin America Ship Charging System Market Forecast (USD Billion), by Mexico, 2018-2029
      Figure 46: Latin America Ship Charging System Market Forecast (USD Billion), by Rest of Latin America, 2018-2029
      Figure 47: Europe Ship Charging System Market Value Share (%), By Segment 1, 2022 & 2029
      Figure 48: Europe Ship Charging System Market Forecast (USD Billion), by Sub-Segment 1, 2018-2029
      Figure 49: Europe Ship Charging System Market Forecast (USD Billion), by Sub-Segment 2, 2018-2029
      Figure 50: Europe Ship Charging System Market Value Share (%), By Segment 2, 2022 & 2029
      Figure 51: Europe Ship Charging System Market Forecast (USD Billion), by Sub-Segment 1, 2018-2029
      Figure 52: Europe Ship Charging System Market Forecast (USD Billion), by Sub-Segment 2, 2018-2029
      Figure 53: Europe Ship Charging System Market Forecast (USD Billion), by Sub-Segment 3, 2018-2029
      Figure 54: Europe Ship Charging System Market Forecast (USD Billion), by Others, 2018-2029
      Figure 55: Europe Ship Charging System Market Value Share (%), By Segment 3, 2022 & 2029
      Figure 56: Europe Ship Charging System Market Forecast (USD Billion), by Sub-Segment 1, 2018-2029
      Figure 57: Europe Ship Charging System Market Forecast (USD Billion), by Sub-Segment 2, 2018-2029
      Figure 58: Europe Ship Charging System Market Forecast (USD Billion), by Sub-Segment 3, 2018-2029
      Figure 59: Europe Ship Charging System Market Forecast (USD Billion), by Others, 2018-2029
      Figure 60: Europe Ship Charging System Market Forecast (USD Billion), by U.K., 2018-2029
      Figure 61: Europe Ship Charging System Market Forecast (USD Billion), by Germany, 2018-2029
      Figure 62: Europe Ship Charging System Market Forecast (USD Billion), by France, 2018-2029
      Figure 63: Europe Ship Charging System Market Forecast (USD Billion), by Italy, 2018-2029
      Figure 64: Europe Ship Charging System Market Forecast (USD Billion), by Spain, 2018-2029
      Figure 65: Europe Ship Charging System Market Forecast (USD Billion), by Russia, 2018-2029
      Figure 66: Europe Ship Charging System Market Forecast (USD Billion), by Rest of Europe, 2018-2029
      Figure 67: Asia Pacific Ship Charging System Market Value Share (%), By Segment 1, 2022 & 2029
      Figure 68: Asia Pacific Ship Charging System Market Forecast (USD Billion), by Sub-Segment 1, 2018-2029
      Figure 69: Asia Pacific Ship Charging System Market Forecast (USD Billion), by Sub-Segment 2, 2018-2029
      Figure 70: Asia Pacific Ship Charging System Market Value Share (%), By Segment 2, 2022 & 2029
      Figure 71: Asia Pacific Ship Charging System Market Forecast (USD Billion), by Sub-Segment 1, 2018-2029
      Figure 72: Asia Pacific Ship Charging System Market Forecast (USD Billion), by Sub-Segment 2, 2018-2029
      Figure 73: Asia Pacific Ship Charging System Market Forecast (USD Billion), by Sub-Segment 3, 2018-2029
      Figure 74: Asia Pacific Ship Charging System Market Forecast (USD Billion), by Others, 2018-2029
      Figure 75: Asia Pacific Ship Charging System Market Value Share (%), By Segment 3, 2022 & 2029
      Figure 76: Asia Pacific Ship Charging System Market Forecast (USD Billion), by Sub-Segment 1, 2018-2029
      Figure 77: Asia Pacific Ship Charging System Market Forecast (USD Billion), by Sub-Segment 2, 2018-2029
      Figure 78: Asia Pacific Ship Charging System Market Forecast (USD Billion), by Sub-Segment 3, 2018-2029
      Figure 79: Asia Pacific Ship Charging System Market Forecast (USD Billion), by Others, 2018-2029
      Figure 80: Asia Pacific Ship Charging System Market Forecast (USD Billion), by China, 2018-2029
      Figure 81: Asia Pacific Ship Charging System Market Forecast (USD Billion), by India, 2018-2029
      Figure 82: Asia Pacific Ship Charging System Market Forecast (USD Billion), by Japan, 2018-2029
      Figure 83: Asia Pacific Ship Charging System Market Forecast (USD Billion), by Australia, 2018-2029
      Figure 84: Asia Pacific Ship Charging System Market Forecast (USD Billion), by Southeast Asia, 2018-2029
      Figure 85: Asia Pacific Ship Charging System Market Forecast (USD Billion), by Rest of Asia Pacific, 2018-2029
      Figure 86: Middle East & Africa Ship Charging System Market Value Share (%), By Segment 1, 2022 & 2029
      Figure 87: Middle East & Africa Ship Charging System Market Forecast (USD Billion), by Sub-Segment 1, 2018-2029
      Figure 88: Middle East & Africa Ship Charging System Market Forecast (USD Billion), by Sub-Segment 2, 2018-2029
      Figure 89: Middle East & Africa Ship Charging System Market Value Share (%), By Segment 2, 2022 & 2029
      Figure 90: Middle East & Africa Ship Charging System Market Forecast (USD Billion), by Sub-Segment 1, 2018-2029
      Figure 91: Middle East & Africa Ship Charging System Market Forecast (USD Billion), by Sub-Segment 2, 2018-2029
      Figure 92: Middle East & Africa Ship Charging System Market Forecast (USD Billion), by Sub-Segment 3, 2018-2029
      Figure 93: Middle East & Africa Ship Charging System Market Forecast (USD Billion), by Others, 2018-2029
      Figure 94: Middle East & Africa Ship Charging System Market Value Share (%), By Segment 3, 2022 & 2029
      Figure 95: Middle East & Africa Ship Charging System Market Forecast (USD Billion), by Sub-Segment 1, 2018-2029
      Figure 96: Middle East & Africa Ship Charging System Market Forecast (USD Billion), by Sub-Segment 2, 2018-2029
      Figure 97: Middle East & Africa Ship Charging System Market Forecast (USD Billion), by Sub-Segment 3, 2018-2029
      Figure 98: Middle East & Africa Ship Charging System Market Forecast (USD Billion), by Others, 2018-2029
      Figure 99: Middle East & Africa Ship Charging System Market Forecast (USD Billion), by GCC, 2018-2029
      Figure 100: Middle East & Africa Ship Charging System Market Forecast (USD Billion), by South Africa, 2018-2029
      Figure 101: Middle East & Africa Ship Charging System Market Forecast (USD Billion), by Rest of Middle East & Africa, 2018-2029 
      List of Tables
      Table 1: Global Ship Charging System Market Revenue (USD Billion) Forecast, by Segment 1, 2018-2029
      Table 2: Global Ship Charging System Market Revenue (USD Billion) Forecast, by Segment 2, 2018-2029
      Table 3: Global Ship Charging System Market Revenue (USD Billion) Forecast, by Segment 3, 2018-2029
      Table 4: Global Ship Charging System Market Revenue (USD Billion) Forecast, by Region, 2018-2029
      Table 5: North America Ship Charging System Market Revenue (USD Billion) Forecast, by Segment 1, 2018-2029
      Table 6: North America Ship Charging System Market Revenue (USD Billion) Forecast, by Segment 2, 2018-2029
      Table 7: North America Ship Charging System Market Revenue (USD Billion) Forecast, by Segment 3, 2018-2029
      Table 8: North America Ship Charging System Market Revenue (USD Billion) Forecast, by Country, 2018-2029
      Table 9: Europe Ship Charging System Market Revenue (USD Billion) Forecast, by Segment 1, 2018-2029
      Table 10: Europe Ship Charging System Market Revenue (USD Billion) Forecast, by Segment 2, 2018-2029
      Table 11: Europe Ship Charging System Market Revenue (USD Billion) Forecast, by Segment 3, 2018-2029
      Table 12: Europe Ship Charging System Market Revenue (USD Billion) Forecast, by Country, 2018-2029
      Table 13: Latin America Ship Charging System Market Revenue (USD Billion) Forecast, by Segment 1, 2018-2029
      Table 14: Latin America Ship Charging System Market Revenue (USD Billion) Forecast, by Segment 2, 2018-2029
      Table 15: Latin America Ship Charging System Market Revenue (USD Billion) Forecast, by Segment 3, 2018-2029
      Table 16: Latin America Ship Charging System Market Revenue (USD Billion) Forecast, by Country, 2018-2029
      Table 17: Asia Pacific Ship Charging System Market Revenue (USD Billion) Forecast, by Segment 1, 2018-2029
      Table 18: Asia Pacific Ship Charging System Market Revenue (USD Billion) Forecast, by Segment 2, 2018-2029
      Table 19: Asia Pacific Ship Charging System Market Revenue (USD Billion) Forecast, by Segment 3, 2018-2029
      Table 20: Asia Pacific Ship Charging System Market Revenue (USD Billion) Forecast, by Country, 2018-2029
      Table 21: Middle East & Africa Ship Charging System Market Revenue (USD Billion) Forecast, by Segment 1, 2018-2029
      Table 22: Middle East & Africa Ship Charging System Market Revenue (USD Billion) Forecast, by Segment 2, 2018-2029
      Table 23: Middle East & Africa Ship Charging System Market Revenue (USD Billion) Forecast, by Segment 3, 2018-2029
      Table 24: Middle East & Africa Ship Charging System Market Revenue (USD Billion) Forecast, by Country, 2018-2029
      Research Process

      Data Library Research are conducted by industry experts who offer insight on industry structure, market segmentations technology assessment and competitive landscape (CL), and penetration, as well as on emerging trends. Their analysis is based on primary interviews (~ 80%) and secondary research (~ 20%) as well as years of professional expertise in their respective industries. Adding to this, by analysing historical trends and current market positions, our analysts predict where the market will be headed for the next five years. Furthermore, the varying trends of segment & categories geographically presented are also studied and the estimated based on the primary & secondary research.

      In this particular report from the supply side Data Library Research has conducted primary surveys (interviews) with the key level executives (VP, CEO’s, Marketing Director, Business Development Manager and SOFT) of the companies that active & prominent as well as the midsized organization

      FIGURE 1: DLR RESEARH PROCESS

      research-methodology1

      Primary Research

      Extensive primary research was conducted to gain a deeper insight of the market and industry performance. The analysis is based on both primary and secondary research as well as years of professional expertise in the respective industries.

      In addition to analysing current and historical trends, our analysts predict where the market is headed over the next five years.

      It varies by segment for these categories geographically presented in the list of market tables. Speaking about this particular report we have conducted primary surveys (interviews) with the key level executives (VP, CEO’s, Marketing Director, Business Development Manager and many more) of the major players active in the market.

      Secondary Research

      Secondary research was mainly used to collect and identify information useful for the extensive, technical, market-oriented, and Friend’s study of the Global Extra Neutral Alcohol. It was also used to obtain key information about major players, market classification and segmentation according to the industry trends, geographical markets, and developments related to the market and technology perspectives. For this study, analysts have gathered information from various credible sources, such as annual reports, sec filings, journals, white papers, SOFT presentations, and company web sites.

      Market Size Estimation

      Both, top-down and bottom-up approaches were used to estimate and validate the size of the Global market and to estimate the size of various other dependent submarkets in the overall Extra Neutral Alcohol. The key players in the market were identified through secondary research and their market contributions in the respective geographies were determined through primary and secondary research.

      Forecast Model

      research-methodology2