Skin Boosters Market Overview and Analysis:

The Global Skin Boosters Market was valued at approximately USD 1.41 billion in 2025 and is projected to reach about USD 4.81 billion by 2032, growing at a Compound Annual Growth Rate (CAGR) of around 7.05%, 2025-2032.

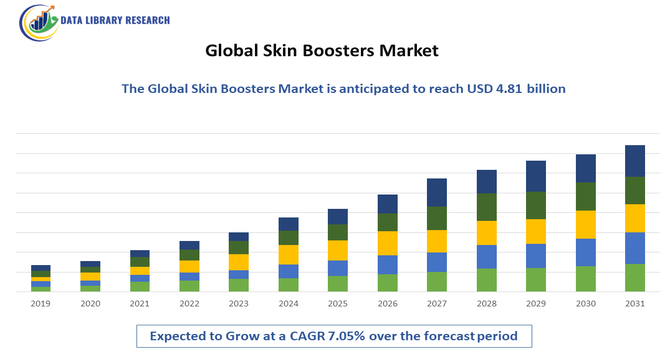
The global skin boosters market growth is being driven primarily by rising demand for minimally invasive, natural-looking aesthetic treatments consumers increasingly prefer injectable hydrators and mesotherapy over surgery for skin rejuvenation alongside advances in hyaluronic-acid and bioactive formulations that improve efficacy and safety. Rapid expansion of medical-spa and dermatology clinics, greater availability of trained practitioners, and expanding distribution in high-growth regions (particularly Asia-Pacific) have improved access and affordability, further boosting uptake.

Skin Boosters Market Latest Trends:

The global skin boosters market includes continued dominance of hyaluronic-acid (HA) formulations and a strong shift toward mesotherapy-style injectable hydrators that prioritize skin quality (texture, elasticity and radiance) over volumizing—driving product innovation and clinician adoption. Regional innovation hubs, especially South Korea, are accelerating interest in alternative bioactive boosters (polynucleotides / PDRN like Rejuran, exosome-based serums and other regenerative ingredients), which are crossing over from Asia into Western clinics and fueling demand for novel, science-forward treatments.

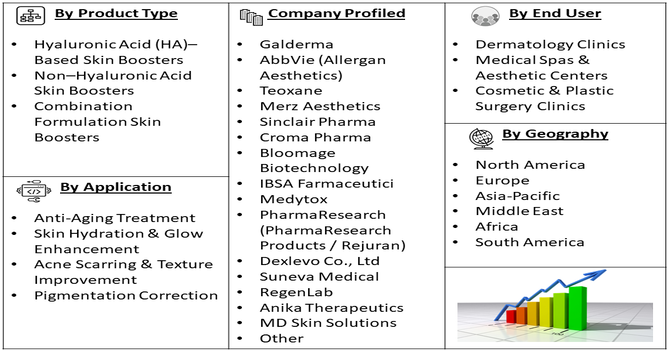
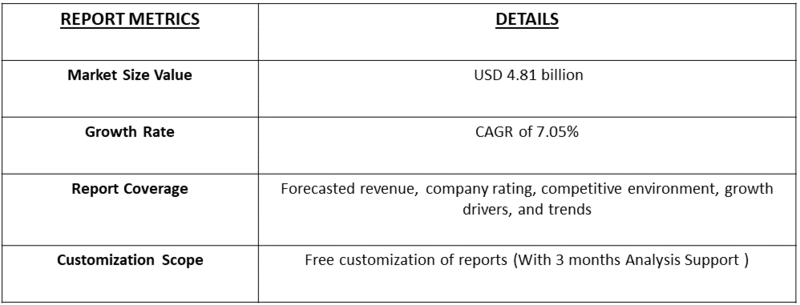
Segmentation: Global Skin Boosters Market is segmented By Product Type (Hyaluronic Acid (HA)–Based Skin Boosters, Non–Hyaluronic Acid Skin Boosters, Combination Formulation Skin Boosters), Ingredient Type (Stabilized HA Boosters, Non-Stabilized HA Boosters, Polynucleotide (PN/PDRN) Boosters, Exosome-Based Boosters, Collagen-Stimulating Boosters), Treatment Type (Mesotherapy-Based Skin Boosters, Microinjection / Injectable Skin Boosters, Microneedling with Booster Infusion), Application (Anti-Aging Treatment, Skin Hydration & Glow Enhancement, Acne Scarring & Texture Improvement, Pigmentation Correction), End User (Dermatology Clinics, Medical Spas & Aesthetic Centers, Cosmetic & Plastic Surgery Clinics), and Geography (North America, Europe, Asia-Pacific, Middle East and Africa, and South America). The report provides the value (in USD million) for the above segments.

Market Drivers:

  • Rising Demand for Minimally Invasive Aesthetic Procedures

A major driver of the global skin boosters market is the rapid shift in consumer preference toward non-surgical, minimally invasive cosmetic enhancements. Skin boosters—such as hyaluronic acid microinjections and polynucleotide (PN/PDRN) therapies—offer visible improvements in skin hydration, elasticity, fine lines, and overall radiance without altering facial structure, making them highly attractive to a wide demographic. For instance, in 2024, The ISAPS survey revealing a 5.5% rise in surgical and over 19.1 million non-surgical procedures had highlighted growing consumer preference for minimally invasive treatments. This surge in demand had driven the Global Skin Boosters Market, encouraging product innovation, wider adoption, and increased investment in non-surgical aesthetic solutions worldwide. This shift toward “skin quality treatments” rather than structural corrections is heavily supporting the growth of the skin boosters market globally.

  • Technological Advancements and Innovation in Formulations

Continuous innovation in injectable technologies and bioactive formulations is another key growth driver. Early-generation skin boosters relied primarily on simple hyaluronic acid gels, but today’s market is witnessing advanced formulations such as cross-linked HA boosters, polynucleotide (PN/PDRN) regenerative injectables, peptide complexes, amino acid blends, and exosome-based boosters. For instance, in May 2023, Allergan Aesthetics’ FDA approval of SKINVIVE™ by JUVÉDERM had marked a breakthrough in intradermal microdroplet HA injections. Its minimally invasive, all-skin-type applicability had advanced formulation innovation, improved treatment precision and comfort, and stimulated growth in the Global Skin Boosters Market by expanding adoption of technologically sophisticated, patient-friendly skin enhancement solutions.

Additionally, improvements in injection techniques, device-assisted delivery (microneedling pens, jet injectors), and combination treatment protocols have expanded the clinical use-cases of skin boosters. This steady wave of technological advancement continues to increase treatment efficacy, broaden indications, and reinforce the market’s upward trajectory.

Market Restraints

  • High Cost of Treatment

The key challenge is the high cost of treatment, as skin boosters often require multiple sessions and periodic maintenance, making them less accessible to price-sensitive consumers, especially in developing regions. Another restraint is the risk of side effects and procedure-related complications—such as bruising, swelling, allergic reactions, or improper injection techniques—which can deter new users and require skilled practitioners to minimize risks. Additionally, the market is affected by regulatory variability across countries, with stringent approval processes and compliance requirements that delay product launches and increase development costs for manufacturers.

Socio Economic Impact on Skin Boosters Market

The Global Skin Boosters Market has had significant socioeconomic impacts, driven by rising consumer awareness of aesthetic treatments, increasing disposable incomes, and the desire for minimally invasive cosmetic procedures. The market’s growth has created employment opportunities across healthcare, dermatology, and cosmetic sectors, including skilled practitioners, product developers, and marketing professionals. It has also stimulated investment in research, innovation, and distribution networks, contributing to economic activity in both developed and emerging regions. However, high treatment costs may limit accessibility, potentially exacerbating social disparities in beauty and wellness. Thus, the market supports economic growth, technological advancement, and lifestyle-oriented consumer spending worldwide.

Segmental Analysis:

  • Hyaluronic Acid (HA)–Based Skin Boosters segment is expected to witness highest growth over the forecast period

Hyaluronic Acid–based skin boosters dominate the market due to their exceptional hydrating properties, biocompatibility, and proven safety profile. These boosters help improve skin elasticity, radiance, and overall texture by delivering deep hydration through microinjections. Their high demand is driven by their ability to offer natural-looking results, minimal downtime, and wide clinical acceptance. Continuous innovation in stabilized and cross-linked HA formulations is further strengthening this segment’s growth and expanding its use across anti-aging and rejuvenation treatments.

  • Polynucleotide (PN/PDRN) Boosters segment is expected to witness highest growth over the forecast period

Polynucleotide (PN/PDRN) boosters are emerging as one of the fastest-growing ingredient segments due to their regenerative and anti-inflammatory properties. These DNA-based injectables promote tissue repair, collagen synthesis, and improved skin elasticity. Originating from advanced aesthetic markets such as South Korea, PN/PDRN boosters are gaining global popularity as they offer long-lasting skin rejuvenation benefits compared to traditional HA formulations. Their rising adoption in treating aging skin, acne scars, and dull texture makes this segment a high-potential growth driver.

  • Microinjection / Injectable Skin Boosters segment is expected to witness highest growth over the forecast period

Microinjection-based injectable skin boosters represent the most widely adopted treatment method, providing precise delivery of active ingredients into the dermal layers. This technique ensures uniform distribution, effective hydration, and predictable clinical outcomes. It is preferred by dermatologists due to its efficiency, versatility, and suitability for treating fine lines, wrinkles, and skin dullness. The rising availability of trained injectors and growing patient acceptance of minimally invasive procedures continue to fuel the strong growth of this segment.

  • Skin Hydration & Glow Enhancement segment is expected to witness highest growth over the forecast period

Skin hydration and glow enhancement remain the largest application area for skin boosters, as consumers increasingly seek treatments that improve overall skin quality rather than alter facial features. Skin boosters effectively restore moisture balance, improve dermal thickness, and enhance radiance—making them ideal for patients seeking refreshed, healthy-looking skin. Increased awareness of “skin quality treatments” and the popularity of glass skin and dewy skin trends globally are significantly boosting demand in this segment.

  • Dermatology Clinics segment is expected to witness highest growth over the forecast period

Dermatology clinics hold a major share of the market due to their high patient footfall, access to certified specialists, and availability of advanced injection techniques. These clinics are often the first choice for patients seeking safe, professional aesthetic treatments. The ability of dermatologists to customize treatment plans, manage complications, and integrate skin boosters with complementary procedures (such as lasers or microneedling) enhances patient trust and drives growth in this segment.

  • North America region is expected to witness highest growth over the forecast period

North America region is expected to witness the highest growth over the forecast period, driven by strong consumer adoption of advanced aesthetic treatments, high disposable incomes, and a rapidly expanding network of dermatology clinics and medical spas offering skin booster procedures. @@@@ The region benefits from early availability of innovative formulations, strong presence of leading aesthetic brands, and increasing acceptance of minimally invasive, skin-quality–focused treatments among both younger and aging populations. For instance,

Moreover, the rising awareness of preventive aesthetics, coupled with continuous product approvals and technological advancements, is further accelerating market growth across the United States and Canada.

Skin Boosters Market Competitive Landscape:

The global skin boosters market is highly competitive, characterized by the presence of several key players focusing on product innovation, strategic collaborations, and geographic expansion to strengthen their market position. Leading companies such as Galderma, AbbVie (Allergan Aesthetics), Teoxane, Merz Aesthetics, Sinclair Pharma, and Croma Pharma dominate the market with a wide portfolio of hyaluronic acid–based and bioactive skin booster products. Competitive strategies such as collaborations with dermatology clinics, medical spas, and aesthetic centers, along with marketing campaigns highlighting minimally invasive and regenerative treatments, are driving market growth and helping these companies capture a larger share of the rapidly growing skin boosters market.

Key Players:

  • Galderma
  • AbbVie (Allergan Aesthetics)
  • Teoxane
  • Merz Aesthetics
  • Sinclair Pharma
  • Croma Pharma
  • Bloomage Biotechnology
  • IBSA Farmaceutici
  • Medytox
  • PharmaResearch (PharmaResearch Products / Rejuran)
  • Dexlevo Co., Ltd
  • Suneva Medical
  • RegenLab
  • Anika Therapeutics
  • MD Skin Solutions
  • LG Household & Health (LG Pra.L)
  • Hugel
  • Revance Therapeutics
  • Dermapen (and associated device makers)
  • Jeisys Medical.

Recent Development

  • In November 2025, Galderma’s FDA approval of Restylane Lyft with Lidocaine for chin augmentation had marked a significant advancement in HA injectable technology. Its versatile applications and extensive safety data had driven innovation in formulations, enhanced treatment options, and strengthened growth in the Global Skin Boosters Market by encouraging wider adoption of advanced, minimally invasive solutions.


  • In October 2025, Mesoskin’s achievement of over 1.1 million global procedures had underscored its impact on non-invasive virtual mesotherapy innovation. This milestone had demonstrated growing acceptance of advanced, technology-driven skin and scalp treatments, driving formulation advancements and reinforcing growth and confidence in the Global Skin Boosters Market through safer, efficient, and innovative solutions.


Frequently Asked Questions (FAQ) :

Q1. What are the main growth-driving factors for this market?

The market is primarily driven by the rising consumer demand for minimally invasive cosmetic procedures and a strong focus on preventative skincare. Social media and rising awareness of skin health have increased the popularity of treatments that improve overall skin quality, hydration, and texture without the significant downtime associated with traditional surgery. The increasing aging population also contributes significantly to this demand.

Q2. What are the main restraining factors for this market?

One significant restraining factor is the high cost of skin booster treatments, especially when considering the necessity of repeated sessions for sustained results, which limits accessibility for middle-income consumers. Additionally, safety concerns and the fear of potential side effects like bruising or swelling, alongside a lack of standardized regulatory guidelines in some regions, can deter potential customers.

Q3. Which segment is expected to witness high growth?

The Hyaluronic Acid (HA) Ingredient segment is expected to maintain high growth, given HA's proven efficacy in deep skin hydration and elasticity improvement. Furthermore, the Male Gender segment is projected to grow rapidly, as men increasingly seek out non-invasive aesthetic treatments to improve appearance, driven by rising self-care consciousness and evolving beauty standards.

Q4. Who are the top major players for this market?

The Global Skin Boosters Market features strong competition among leading aesthetic pharmaceutical companies. Top major players include AbbVie Inc. (Allergan), known for its extensive portfolio of fillers, Galderma, Merz Aesthetics, and specialized companies like IBSA Farmaceutici Italia Srl (maker of Profhilo) and Teoxane. These players focus heavily on R&D for better formulations.

Q5. Which country is the largest player?

North America holds the largest market share globally, largely fueled by the high disposable income of consumers, strong healthcare infrastructure, and widespread acceptance of cosmetic procedures, particularly in the United States. However, the Asia-Pacific region, led by countries like South Korea and China, is projected to be the fastest-growing market due to favorable beauty trends and increased medical tourism.

Skin Boosters MARKET STUDY GLOBAL MARKET ANALYSIS, INSIGHTS AND FORECAST, 2022-2029

    1. Introduction

    • 1.1. Research Scope
    • 1.2. Market Segmentation
    • 1.3. Research Methodology
    • 1.4. Definitions and Assumptions

    2. Executive Summary

      3. Market Dynamics

      • 3.1. Market Drivers
      • 3.2. Market Restraints
      • 3.3. Market Opportunities

      4. Key Insights

      • 4.1. Key Emerging Trends – For Major Countries
      • 4.2. Latest Technological Advancement
      • 4.3. Regulatory Landscape
      • 4.4. Industry SWOT Analysis
      • 4.5. Porters Five Forces Analysis

      5. Global Skin Boosters Market Analysis (USD Billion), Insights and Forecast, 2018-2029

      • 5.1. Key Findings / Summary
      • 5.2. Market Analysis, Insights and Forecast – By Segment 1
        • 5.2.1. Sub-Segment 1
        • 5.2.2. Sub-Segment 2
      • 5.3. Market Analysis, Insights and Forecast – By Segment 2
        • 5.3.1. Sub-Segment 1
        • 5.3.2. Sub-Segment 2
        • 5.3.3. Sub-Segment 3
        • 5.3.4. Others
      • 5.4. Market Analysis, Insights and Forecast – By Segment 3
        • 5.4.1. Sub-Segment 1
        • 5.4.2. Sub-Segment 2
        • 5.4.3. Sub-Segment 3
        • 5.4.4. Others
      • 5.5. Market Analysis, Insights and Forecast – By Region
        • 5.5.1. North America
        • 5.5.2. Latin America
        • 5.5.3. Europe
        • 5.5.4. Asia Pacific
        • 5.5.5. Middle East and Africa

      6. North America Skin Boosters Market Analysis (USD Billion), Insights and Forecast, 2018-2029

      • 6.1. Key Findings / Summary
      • 6.2. Market Analysis, Insights and Forecast – By Segment 1
        • 6.2.1. Sub-Segment 1
        • 6.2.2. Sub-Segment 2
      • 6.3. Market Analysis, Insights and Forecast – By Segment 2
        • 6.3.1. Sub-Segment 1
        • 6.3.2. Sub-Segment 2
        • 6.3.3. Sub-Segment 3
        • 6.3.4. Others
      • 6.4. Market Analysis, Insights and Forecast – By Segment 3
        • 6.4.1. Sub-Segment 1
        • 6.4.2. Sub-Segment 2
        • 6.4.3. Sub-Segment 3
        • 6.4.4. Others
      • 6.5. Market Analysis, Insights and Forecast – By Country
        • 6.5.1. U.S.
        • 6.5.2. Canada

      7. Latin America Skin Boosters Market Analysis (USD Billion), Insights and Forecast, 2018-2029

      • 7.1. Key Findings / Summary
      • 7.2. Market Analysis, Insights and Forecast – By Segment 1
        • 7.2.1. Sub-Segment 1
        • 7.2.2. Sub-Segment 2
      • 7.3. Market Analysis, Insights and Forecast – By Segment 2
        • 7.3.1. Sub-Segment 1
        • 7.3.2. Sub-Segment 2
        • 7.3.3. Sub-Segment 3
        • 7.3.4. Others
      • 7.4. Market Analysis, Insights and Forecast – By Segment 3
        • 7.4.1. Sub-Segment 1
        • 7.4.2. Sub-Segment 2
        • 7.4.3. Sub-Segment 3
        • 7.4.4. Others
      • 7.5. Insights and Forecast – By Country
        • 7.5.1. Brazil
        • 7.5.2. Mexico
        • 7.5.3. Rest of Latin America

      8. Europe Skin Boosters Market Analysis (USD Billion), Insights and Forecast, 2018-2029

      • 8.1. Key Findings / Summary
      • 8.2. Market Analysis, Insights and Forecast – By Segment 1
        • 8.2.1. Sub-Segment 1
        • 8.2.2. Sub-Segment 2
      • 8.3. Market Analysis, Insights and Forecast – By Segment 2
        • 8.3.1. Sub-Segment 1
        • 8.3.2. Sub-Segment 2
        • 8.3.3. Sub-Segment 3
        • 8.3.4. Others
      • 8.4. Market Analysis, Insights and Forecast – By Segment 3
        • 8.4.1. Sub-Segment 1
        • 8.4.2. Sub-Segment 2
        • 8.4.3. Sub-Segment 3
        • 8.4.4. Others
      • 8.5. Market Analysis, Insights and Forecast – By Country
        • 8.5.1. UK
        • 8.5.2. Germany
        • 8.5.3. France
        • 8.5.4. Italy
        • 8.5.5. Spain
        • 8.5.6. Russia
        • 8.5.7. Rest of Europe

      9. Asia Pacific Skin Boosters Market Analysis (USD Billion), Insights and Forecast, 2018-2029

      • 9.1. Key Findings / Summary
      • 9.2. Market Analysis, Insights and Forecast – By Segment 1
        • 9.2.1. Sub-Segment 1
        • 9.2.2. Sub-Segment 2
      • 9.3. Market Analysis, Insights and Forecast – By Segment 2
        • 9.3.1. Sub-Segment 1
        • 9.3.2. Sub-Segment 2
        • 9.3.3. Sub-Segment 3
        • 9.3.4. Others
      • 9.4. Market Analysis, Insights and Forecast – By Segment 3
        • 9.4.1. Sub-Segment 1
        • 9.4.2. Sub-Segment 2
        • 9.4.3. Sub-Segment 3
        • 9.4.4. Others
      • 9.5. Market Analysis, Insights and Forecast – By Country
        • 9.5.1. China
        • 9.5.2. India
        • 9.5.3. Japan
        • 9.5.4. Australia
        • 9.5.5. South East Asia
        • 9.5.6. Rest of Asia Pacific

      10. Middle East & Africa Skin Boosters Market Analysis (USD Billion), Insights and Forecast, 2018-2029

      • 10.1. Key Findings / Summary
      • 10.2. Market Analysis, Insights and Forecast – By Segment 1
        • 10.2.1. Sub-Segment 1
        • 10.2.2. Sub-Segment 2
      • 10.3. Market Analysis, Insights and Forecast – By Segment 2
        • 10.3.1. Sub-Segment 1
        • 10.3.2. Sub-Segment 2
        • 10.3.3. Sub-Segment 3
        • 10.3.4. Others
      • 10.4. Market Analysis, Insights and Forecast – By Segment 3
        • 10.4.1. Sub-Segment 1
        • 10.4.2. Sub-Segment 2
        • 10.4.3. Sub-Segment 3
        • 10.4.4. Others
      • 10.5. Market Analysis, Insights and Forecast – By Country
        • 10.5.1. GCC
        • 10.5.2. South Africa
        • 10.5.3. Rest of Middle East & Africa

      11. Competitive Analysis

      • 11.1. Company Market Share Analysis, 2018
      • 11.2. Key Industry Developments
      • 11.3. Company Profile
        • 11.3.1. Company 1
          • 11.3.1.1. Business Overview
          • 11.3.1.2. Segment 1 & Service Offering
          • 11.3.1.3. Overall Revenue
          • 11.3.1.4. Geographic Presence
          • 11.3.1.5. Recent Development
        *Similar details will be provided for the following companies
        • 11.3.2. Company 2
        • 11.3.3. Company 3
        • 11.3.4. Company 4
        • 11.3.5. Company 5
        • 11.3.6. Company 6
        • 11.3.7. Company 7
        • 11.3.8. Company 8
        • 11.3.9. Company 9
        • 11.3.10. Company 10
        • 11.3.11. Company 11
        • 11.3.12. Company 12
      List of Figures

      Figure 1: Global Skin Boosters Market Revenue Breakdown (USD Billion, %) by Region, 2022 & 2029
      Figure 2: Global Skin Boosters Market Value Share (%), By Segment 1, 2022 & 2029
      Figure 3: Global Skin Boosters Market Forecast (USD Billion), by Sub-Segment 1, 2018-2029
      Figure 4: Global Skin Boosters Market Forecast (USD Billion), by Sub-Segment 2, 2018-2029
      Figure 5: Global Skin Boosters Market Value Share (%), By Segment 2, 2022 & 2029
      Figure 6: Global Skin Boosters Market Forecast (USD Billion), by Sub-Segment 1, 2018-2029
      Figure 7: Global Skin Boosters Market Forecast (USD Billion), by Sub-Segment 2, 2018-2029
      Figure 8: Global Skin Boosters Market Forecast (USD Billion), by Sub-Segment 3, 2018-2029
      Figure 9: Global Skin Boosters Market Forecast (USD Billion), by Others, 2018-2029
      Figure 10: Global Skin Boosters Market Value Share (%), By Segment 3, 2022 & 2029
      Figure 11: Global Skin Boosters Market Forecast (USD Billion), by Sub-Segment 1, 2018-2029
      Figure 12: Global Skin Boosters Market Forecast (USD Billion), by Sub-Segment 2, 2018-2029
      Figure 13: Global Skin Boosters Market Forecast (USD Billion), by Sub-Segment 3, 2018-2029
      Figure 14: Global Skin Boosters Market Forecast (USD Billion), by Others, 2018-2029
      Figure 15: Global Skin Boosters Market Value (USD Billion), by Region, 2022 & 2029
      Figure 16: North America Skin Boosters Market Value Share (%), By Segment 1, 2022 & 2029
      Figure 17: North America Skin Boosters Market Forecast (USD Billion), by Sub-Segment 1, 2018-2029
      Figure 18: North America Skin Boosters Market Forecast (USD Billion), by Sub-Segment 2, 2018-2029
      Figure 19: North America Skin Boosters Market Value Share (%), By Segment 2, 2022 & 2029
      Figure 20: North America Skin Boosters Market Forecast (USD Billion), by Sub-Segment 1, 2018-2029
      Figure 21: North America Skin Boosters Market Forecast (USD Billion), by Sub-Segment 2, 2018-2029
      Figure 22: North America Skin Boosters Market Forecast (USD Billion), by Sub-Segment 3, 2018-2029
      Figure 23: North America Skin Boosters Market Forecast (USD Billion), by Others, 2018-2029
      Figure 24: North America Skin Boosters Market Value Share (%), By Segment 3, 2022 & 2029
      Figure 25: North America Skin Boosters Market Forecast (USD Billion), by Sub-Segment 1, 2018-2029
      Figure 26: North America Skin Boosters Market Forecast (USD Billion), by Sub-Segment 2, 2018-2029
      Figure 27: North America Skin Boosters Market Forecast (USD Billion), by Sub-Segment 3, 2018-2029
      Figure 28: North America Skin Boosters Market Forecast (USD Billion), by Others, 2018-2029
      Figure 29: North America Skin Boosters Market Forecast (USD Billion), by U.S., 2018-2029
      Figure 30: North America Skin Boosters Market Forecast (USD Billion), by Canada, 2018-2029
      Figure 31: Latin America Skin Boosters Market Value Share (%), By Segment 1, 2022 & 2029
      Figure 32: Latin America Skin Boosters Market Forecast (USD Billion), by Sub-Segment 1, 2018-2029
      Figure 33: Latin America Skin Boosters Market Forecast (USD Billion), by Sub-Segment 2, 2018-2029
      Figure 34: Latin America Skin Boosters Market Value Share (%), By Segment 2, 2022 & 2029
      Figure 35: Latin America Skin Boosters Market Forecast (USD Billion), by Sub-Segment 1, 2018-2029
      Figure 36: Latin America Skin Boosters Market Forecast (USD Billion), by Sub-Segment 2, 2018-2029
      Figure 37: Latin America Skin Boosters Market Forecast (USD Billion), by Sub-Segment 3, 2018-2029
      Figure 38: Latin America Skin Boosters Market Forecast (USD Billion), by Others, 2018-2029
      Figure 39: Latin America Skin Boosters Market Value Share (%), By Segment 3, 2022 & 2029
      Figure 40: Latin America Skin Boosters Market Forecast (USD Billion), by Sub-Segment 1, 2018-2029
      Figure 41: Latin America Skin Boosters Market Forecast (USD Billion), by Sub-Segment 2, 2018-2029
      Figure 42: Latin America Skin Boosters Market Forecast (USD Billion), by Sub-Segment 3, 2018-2029
      Figure 43: Latin America Skin Boosters Market Forecast (USD Billion), by Others, 2018-2029
      Figure 44: Latin America Skin Boosters Market Forecast (USD Billion), by Brazil, 2018-2029
      Figure 45: Latin America Skin Boosters Market Forecast (USD Billion), by Mexico, 2018-2029
      Figure 46: Latin America Skin Boosters Market Forecast (USD Billion), by Rest of Latin America, 2018-2029
      Figure 47: Europe Skin Boosters Market Value Share (%), By Segment 1, 2022 & 2029
      Figure 48: Europe Skin Boosters Market Forecast (USD Billion), by Sub-Segment 1, 2018-2029
      Figure 49: Europe Skin Boosters Market Forecast (USD Billion), by Sub-Segment 2, 2018-2029
      Figure 50: Europe Skin Boosters Market Value Share (%), By Segment 2, 2022 & 2029
      Figure 51: Europe Skin Boosters Market Forecast (USD Billion), by Sub-Segment 1, 2018-2029
      Figure 52: Europe Skin Boosters Market Forecast (USD Billion), by Sub-Segment 2, 2018-2029
      Figure 53: Europe Skin Boosters Market Forecast (USD Billion), by Sub-Segment 3, 2018-2029
      Figure 54: Europe Skin Boosters Market Forecast (USD Billion), by Others, 2018-2029
      Figure 55: Europe Skin Boosters Market Value Share (%), By Segment 3, 2022 & 2029
      Figure 56: Europe Skin Boosters Market Forecast (USD Billion), by Sub-Segment 1, 2018-2029
      Figure 57: Europe Skin Boosters Market Forecast (USD Billion), by Sub-Segment 2, 2018-2029
      Figure 58: Europe Skin Boosters Market Forecast (USD Billion), by Sub-Segment 3, 2018-2029
      Figure 59: Europe Skin Boosters Market Forecast (USD Billion), by Others, 2018-2029
      Figure 60: Europe Skin Boosters Market Forecast (USD Billion), by U.K., 2018-2029
      Figure 61: Europe Skin Boosters Market Forecast (USD Billion), by Germany, 2018-2029
      Figure 62: Europe Skin Boosters Market Forecast (USD Billion), by France, 2018-2029
      Figure 63: Europe Skin Boosters Market Forecast (USD Billion), by Italy, 2018-2029
      Figure 64: Europe Skin Boosters Market Forecast (USD Billion), by Spain, 2018-2029
      Figure 65: Europe Skin Boosters Market Forecast (USD Billion), by Russia, 2018-2029
      Figure 66: Europe Skin Boosters Market Forecast (USD Billion), by Rest of Europe, 2018-2029
      Figure 67: Asia Pacific Skin Boosters Market Value Share (%), By Segment 1, 2022 & 2029
      Figure 68: Asia Pacific Skin Boosters Market Forecast (USD Billion), by Sub-Segment 1, 2018-2029
      Figure 69: Asia Pacific Skin Boosters Market Forecast (USD Billion), by Sub-Segment 2, 2018-2029
      Figure 70: Asia Pacific Skin Boosters Market Value Share (%), By Segment 2, 2022 & 2029
      Figure 71: Asia Pacific Skin Boosters Market Forecast (USD Billion), by Sub-Segment 1, 2018-2029
      Figure 72: Asia Pacific Skin Boosters Market Forecast (USD Billion), by Sub-Segment 2, 2018-2029
      Figure 73: Asia Pacific Skin Boosters Market Forecast (USD Billion), by Sub-Segment 3, 2018-2029
      Figure 74: Asia Pacific Skin Boosters Market Forecast (USD Billion), by Others, 2018-2029
      Figure 75: Asia Pacific Skin Boosters Market Value Share (%), By Segment 3, 2022 & 2029
      Figure 76: Asia Pacific Skin Boosters Market Forecast (USD Billion), by Sub-Segment 1, 2018-2029
      Figure 77: Asia Pacific Skin Boosters Market Forecast (USD Billion), by Sub-Segment 2, 2018-2029
      Figure 78: Asia Pacific Skin Boosters Market Forecast (USD Billion), by Sub-Segment 3, 2018-2029
      Figure 79: Asia Pacific Skin Boosters Market Forecast (USD Billion), by Others, 2018-2029
      Figure 80: Asia Pacific Skin Boosters Market Forecast (USD Billion), by China, 2018-2029
      Figure 81: Asia Pacific Skin Boosters Market Forecast (USD Billion), by India, 2018-2029
      Figure 82: Asia Pacific Skin Boosters Market Forecast (USD Billion), by Japan, 2018-2029
      Figure 83: Asia Pacific Skin Boosters Market Forecast (USD Billion), by Australia, 2018-2029
      Figure 84: Asia Pacific Skin Boosters Market Forecast (USD Billion), by Southeast Asia, 2018-2029
      Figure 85: Asia Pacific Skin Boosters Market Forecast (USD Billion), by Rest of Asia Pacific, 2018-2029
      Figure 86: Middle East & Africa Skin Boosters Market Value Share (%), By Segment 1, 2022 & 2029
      Figure 87: Middle East & Africa Skin Boosters Market Forecast (USD Billion), by Sub-Segment 1, 2018-2029
      Figure 88: Middle East & Africa Skin Boosters Market Forecast (USD Billion), by Sub-Segment 2, 2018-2029
      Figure 89: Middle East & Africa Skin Boosters Market Value Share (%), By Segment 2, 2022 & 2029
      Figure 90: Middle East & Africa Skin Boosters Market Forecast (USD Billion), by Sub-Segment 1, 2018-2029
      Figure 91: Middle East & Africa Skin Boosters Market Forecast (USD Billion), by Sub-Segment 2, 2018-2029
      Figure 92: Middle East & Africa Skin Boosters Market Forecast (USD Billion), by Sub-Segment 3, 2018-2029
      Figure 93: Middle East & Africa Skin Boosters Market Forecast (USD Billion), by Others, 2018-2029
      Figure 94: Middle East & Africa Skin Boosters Market Value Share (%), By Segment 3, 2022 & 2029
      Figure 95: Middle East & Africa Skin Boosters Market Forecast (USD Billion), by Sub-Segment 1, 2018-2029
      Figure 96: Middle East & Africa Skin Boosters Market Forecast (USD Billion), by Sub-Segment 2, 2018-2029
      Figure 97: Middle East & Africa Skin Boosters Market Forecast (USD Billion), by Sub-Segment 3, 2018-2029
      Figure 98: Middle East & Africa Skin Boosters Market Forecast (USD Billion), by Others, 2018-2029
      Figure 99: Middle East & Africa Skin Boosters Market Forecast (USD Billion), by GCC, 2018-2029
      Figure 100: Middle East & Africa Skin Boosters Market Forecast (USD Billion), by South Africa, 2018-2029
      Figure 101: Middle East & Africa Skin Boosters Market Forecast (USD Billion), by Rest of Middle East & Africa, 2018-2029 
      List of Tables
      Table 1: Global Skin Boosters Market Revenue (USD Billion) Forecast, by Segment 1, 2018-2029
      Table 2: Global Skin Boosters Market Revenue (USD Billion) Forecast, by Segment 2, 2018-2029
      Table 3: Global Skin Boosters Market Revenue (USD Billion) Forecast, by Segment 3, 2018-2029
      Table 4: Global Skin Boosters Market Revenue (USD Billion) Forecast, by Region, 2018-2029
      Table 5: North America Skin Boosters Market Revenue (USD Billion) Forecast, by Segment 1, 2018-2029
      Table 6: North America Skin Boosters Market Revenue (USD Billion) Forecast, by Segment 2, 2018-2029
      Table 7: North America Skin Boosters Market Revenue (USD Billion) Forecast, by Segment 3, 2018-2029
      Table 8: North America Skin Boosters Market Revenue (USD Billion) Forecast, by Country, 2018-2029
      Table 9: Europe Skin Boosters Market Revenue (USD Billion) Forecast, by Segment 1, 2018-2029
      Table 10: Europe Skin Boosters Market Revenue (USD Billion) Forecast, by Segment 2, 2018-2029
      Table 11: Europe Skin Boosters Market Revenue (USD Billion) Forecast, by Segment 3, 2018-2029
      Table 12: Europe Skin Boosters Market Revenue (USD Billion) Forecast, by Country, 2018-2029
      Table 13: Latin America Skin Boosters Market Revenue (USD Billion) Forecast, by Segment 1, 2018-2029
      Table 14: Latin America Skin Boosters Market Revenue (USD Billion) Forecast, by Segment 2, 2018-2029
      Table 15: Latin America Skin Boosters Market Revenue (USD Billion) Forecast, by Segment 3, 2018-2029
      Table 16: Latin America Skin Boosters Market Revenue (USD Billion) Forecast, by Country, 2018-2029
      Table 17: Asia Pacific Skin Boosters Market Revenue (USD Billion) Forecast, by Segment 1, 2018-2029
      Table 18: Asia Pacific Skin Boosters Market Revenue (USD Billion) Forecast, by Segment 2, 2018-2029
      Table 19: Asia Pacific Skin Boosters Market Revenue (USD Billion) Forecast, by Segment 3, 2018-2029
      Table 20: Asia Pacific Skin Boosters Market Revenue (USD Billion) Forecast, by Country, 2018-2029
      Table 21: Middle East & Africa Skin Boosters Market Revenue (USD Billion) Forecast, by Segment 1, 2018-2029
      Table 22: Middle East & Africa Skin Boosters Market Revenue (USD Billion) Forecast, by Segment 2, 2018-2029
      Table 23: Middle East & Africa Skin Boosters Market Revenue (USD Billion) Forecast, by Segment 3, 2018-2029
      Table 24: Middle East & Africa Skin Boosters Market Revenue (USD Billion) Forecast, by Country, 2018-2029
      Research Process

      Data Library Research are conducted by industry experts who offer insight on industry structure, market segmentations technology assessment and competitive landscape (CL), and penetration, as well as on emerging trends. Their analysis is based on primary interviews (~ 80%) and secondary research (~ 20%) as well as years of professional expertise in their respective industries. Adding to this, by analysing historical trends and current market positions, our analysts predict where the market will be headed for the next five years. Furthermore, the varying trends of segment & categories geographically presented are also studied and the estimated based on the primary & secondary research.

      In this particular report from the supply side Data Library Research has conducted primary surveys (interviews) with the key level executives (VP, CEO’s, Marketing Director, Business Development Manager and SOFT) of the companies that active & prominent as well as the midsized organization

      FIGURE 1: DLR RESEARH PROCESS

      research-methodology1

      Primary Research

      Extensive primary research was conducted to gain a deeper insight of the market and industry performance. The analysis is based on both primary and secondary research as well as years of professional expertise in the respective industries.

      In addition to analysing current and historical trends, our analysts predict where the market is headed over the next five years.

      It varies by segment for these categories geographically presented in the list of market tables. Speaking about this particular report we have conducted primary surveys (interviews) with the key level executives (VP, CEO’s, Marketing Director, Business Development Manager and many more) of the major players active in the market.

      Secondary Research

      Secondary research was mainly used to collect and identify information useful for the extensive, technical, market-oriented, and Friend’s study of the Global Extra Neutral Alcohol. It was also used to obtain key information about major players, market classification and segmentation according to the industry trends, geographical markets, and developments related to the market and technology perspectives. For this study, analysts have gathered information from various credible sources, such as annual reports, sec filings, journals, white papers, SOFT presentations, and company web sites.

      Market Size Estimation

      Both, top-down and bottom-up approaches were used to estimate and validate the size of the Global market and to estimate the size of various other dependent submarkets in the overall Extra Neutral Alcohol. The key players in the market were identified through secondary research and their market contributions in the respective geographies were determined through primary and secondary research.

      Forecast Model

      research-methodology2

      Happy to Assist You

      If you have a question?

      info@datalibraryresearch.com

      IND : +91 955 279 0357

      Browse Related Reports