Smart City Market Overview
The global Smart City market is expected to rise at a significant rate in the forecast period. This market is growing rapidly, primarily to the rising urbanization and migration of people from rural to urban locations around the world. Consumer awareness of energy conservation and the growing trend of green infrastructure are also helping to propel this market forward.
Furthermore, the global Smart City market has been primarily driven by increased investments by city governments, central/federal governments, and dedicated governing organizations. Financing and funding models, technological ecosystems, governance arrangements, and infrastructure investments all play important roles in smart city deployments and are likely to propel market expansion during the projection period.
On the other hand, significant security issues and a lack of stakeholder engagement may restrain the growth of the global smart cities market in the near future. Besides this, the introduction of driverless cars, electronic waste management systems, and wearable computing devices, according to the study paper, is projected to reduce the impact of constraints in the next years.
| Report Metric |
Details |
| Market size available for years |
2023–2030 |
| Base year considered |
2023 |
| Forecast period |
2024–2030 |
| Forecast unit |
Value (USD Million) |
| Segments covered |
End User, and Region |
| Regions covered |
North America (the U.S. and Canada), Europe (UK, Germany, France, Italy, Spain, Russia, Rest of Europe), Asia-Pacific (China, India, Japan, Australia, South East Asia, Rest of Asia Pacific), Latin America and the Middle East and Africa (Brazil, Saudi Arabia, UAE, Rest of LAMEA) |
| Companies covered |
Oracle Corp., Intel Corp., Hitachi Ltd., International Business Machines (IBM) Corp., General Electric Co., Honeywell International Inc., Telefonaktiebolaget L. M. Ericsson, Dassault Systemes S.A., Cisco Systems Inc., Alcatel-Lucent SA., Alstom S.A., Siemens AG., Accenture Plc, ABB Ltd. |
Covid-19 Impact on Smart City Market Market
Like many other industries, COVID-19 badly knocked the electronic and semiconductor industries. This unprecedented event has impacted nearly 230 countries in just a few weeks, resulting in the forced shutdown of manufacturing and transportation activities within and across the countries. This has directly affected the overall sector's growth. It is estimated that COVID-19 to leave more than USD 30 billion impacts on the electronics and semiconductor industry. The sector is majorly affected due to transport restrictions on major electronics and semiconductor raw material providers. However, the emerging need for semiconductors in several industries will offer rapid market recovery over the future period.
Smart City Market Segment Overview
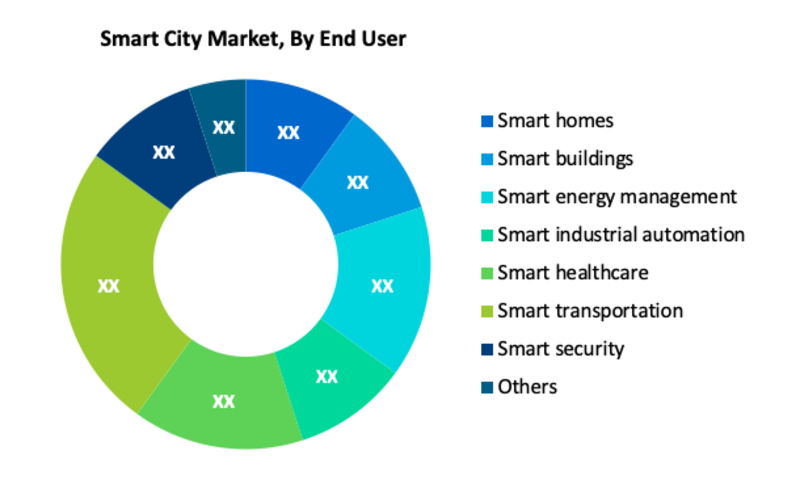
According to End User, Smart transportation is one of the largest segments in the global Smart City market. In the transportation industry, smart city technologies have a wide range of applications. The situation is anticipated to stay unchanged in the coming years, given the rising demand for sophisticated traffic management and the growing need to reduce the number of delivery vehicles and provide a better transportation environment.
Smart City Market, By End User
· Smart homes
· Smart buildings
· Smart energy management
· Smart industrial automation
· Smart healthcare
· Smart transportation
· Smart security
· Others (smart education, smart water management, so on)
Smart City Market Regional Overview
Region-wise, North America dominated the Smart City market in 2020 and is predicted to maintain its supremacy in the forthcoming years. The growth can be mainly attributed to the constant digital transformation across several industry verticals such as telecom, retail, and banking. Furthermore, North America is the main region for the market due to its well-developed ICT infrastructure, the collaboration of federal and local governments with ICT vendors and start-ups, and the presence of prominent technology vendors. These aspects are anticipated to drive innovation around smart technologies in the region. Similarly, Asia Pacific is projected to emerge as the fastest-growing regional market in the forecast period. This growth can be primarily attributed to the increased focus on the development of digital infrastructure in the region. Besides, increasing urbanization and growth in disposable income are further projected to propel the regional market growth over the forecast period.
Smart City Market, By Geography
· North America (US & Canada)
· Europe (UK, Germany, France, Italy, Spain, Russia & Rest of Europe)
· Asia-Pacific (Japan, China, India, Australia, & South Korea, & Rest of Asia-Pacific)
· LAMEA (Brazil, Saudi Arabia, UAE & Rest of LAMEA)
Smart City Market, Key Players
· Oracle Corp.
· Intel Corp.
· Hitachi Ltd.
· International Business Machines (IBM) Corp.
· General Electric Co.
· Honeywell International Inc.
· Telefonaktiebolaget L. M. Ericsson
· Dassault Systemes S.A.
· Cisco Systems Inc.
· Alcatel-Lucent SA.
· Alstom S.A.
· Siemens AG.
· Accenture Plc
· ABB Ltd.
Frequently Asked Questions (FAQ) :
Q1. What are the driving factors for the Smart City market?
The global Smart City market has been primarily driven by increased investments by city governments, central/federal governments, and dedicated governing organizations.
Q2. What are the restraining factors for the Smart City market?
Significant security issues and a lack of stakeholder engagement may restrain the growth of the global smart cities market in the near future.
Q3. Which region holds the largest share in the Smart City market?
North America held the largest share in the global Smart City market.
Q4. Which segment is projected to hold the largest share in the Smart City Market?
Smart transportation segment is projected to hold the largest share in the Smart City Market.
Q5. Which are the prominent players in the Smart City Market?
Oracle Corp., Intel Corp., Hitachi Ltd., International Business Machines (IBM) Corp., General Electric Co., Honeywell International Inc., Telefonaktiebolaget L. M. Ericsson, Dassault Systemes S.A., Cisco Systems Inc., Alcatel-Lucent SA., Alstom S.A., Siemens AG., Accenture Plc, ABB Ltd. are some key players in the Smart City Market.
List of Figures
Figure 1: Global Smart City Market Revenue Breakdown (USD Billion, %) by Region, 2019 & 2027
Figure 2: Global Smart City Market Value Share (%), By Segment 1, 2019 & 2027
Figure 3: Global Smart City Market Forecast (USD Billion), by Sub-Segment 1, 2016-2027
Figure 4: Global Smart City Market Forecast (USD Billion), by Sub-Segment 2, 2016-2027
Figure 5: Global Smart City Market Value Share (%), By Segment 2, 2019 & 2027
Figure 6: Global Smart City Market Forecast (USD Billion), by Sub-Segment 1, 2016-2027
Figure 7: Global Smart City Market Forecast (USD Billion), by Sub-Segment 2, 2016-2027
Figure 8: Global Smart City Market Forecast (USD Billion), by Sub-Segment 3, 2016-2027
Figure 9: Global Smart City Market Forecast (USD Billion), by Others, 2016-2027
Figure 10: Global Smart City Market Value Share (%), By Segment 3, 2019 & 2027
Figure 11: Global Smart City Market Forecast (USD Billion), by Sub-Segment 1, 2016-2027
Figure 12: Global Smart City Market Forecast (USD Billion), by Sub-Segment 2, 2016-2027
Figure 13: Global Smart City Market Forecast (USD Billion), by Sub-Segment 3, 2016-2027
Figure 14: Global Smart City Market Forecast (USD Billion), by Others, 2016-2027
Figure 15: Global Smart City Market Value (USD Billion), by Region, 2019 & 2027
Figure 16: North America Smart City Market Value Share (%), By Segment 1, 2019 & 2027
Figure 17: North America Smart City Market Forecast (USD Billion), by Sub-Segment 1, 2016-2027
Figure 18: North America Smart City Market Forecast (USD Billion), by Sub-Segment 2, 2016-2027
Figure 19: North America Smart City Market Value Share (%), By Segment 2, 2019 & 2027
Figure 20: North America Smart City Market Forecast (USD Billion), by Sub-Segment 1, 2016-2027
Figure 21: North America Smart City Market Forecast (USD Billion), by Sub-Segment 2, 2016-2027
Figure 22: North America Smart City Market Forecast (USD Billion), by Sub-Segment 3, 2016-2027
Figure 23: North America Smart City Market Forecast (USD Billion), by Others, 2016-2027
Figure 24: North America Smart City Market Value Share (%), By Segment 3, 2019 & 2027
Figure 25: North America Smart City Market Forecast (USD Billion), by Sub-Segment 1, 2016-2027
Figure 26: North America Smart City Market Forecast (USD Billion), by Sub-Segment 2, 2016-2027
Figure 27: North America Smart City Market Forecast (USD Billion), by Sub-Segment 3, 2016-2027
Figure 28: North America Smart City Market Forecast (USD Billion), by Others, 2016-2027
Figure 29: North America Smart City Market Forecast (USD Billion), by U.S., 2016-2027
Figure 30: North America Smart City Market Forecast (USD Billion), by Canada, 2016-2027
Figure 31: Latin America Smart City Market Value Share (%), By Segment 1, 2019 & 2027
Figure 32: Latin America Smart City Market Forecast (USD Billion), by Sub-Segment 1, 2016-2027
Figure 33: Latin America Smart City Market Forecast (USD Billion), by Sub-Segment 2, 2016-2027
Figure 34: Latin America Smart City Market Value Share (%), By Segment 2, 2019 & 2027
Figure 35: Latin America Smart City Market Forecast (USD Billion), by Sub-Segment 1, 2016-2027
Figure 36: Latin America Smart City Market Forecast (USD Billion), by Sub-Segment 2, 2016-2027
Figure 37: Latin America Smart City Market Forecast (USD Billion), by Sub-Segment 3, 2016-2027
Figure 38: Latin America Smart City Market Forecast (USD Billion), by Others, 2016-2027
Figure 39: Latin America Smart City Market Value Share (%), By Segment 3, 2019 & 2027
Figure 40: Latin America Smart City Market Forecast (USD Billion), by Sub-Segment 1, 2016-2027
Figure 41: Latin America Smart City Market Forecast (USD Billion), by Sub-Segment 2, 2016-2027
Figure 42: Latin America Smart City Market Forecast (USD Billion), by Sub-Segment 3, 2016-2027
Figure 43: Latin America Smart City Market Forecast (USD Billion), by Others, 2016-2027
Figure 44: Latin America Smart City Market Forecast (USD Billion), by Brazil, 2016-2027
Figure 45: Latin America Smart City Market Forecast (USD Billion), by Mexico, 2016-2027
Figure 46: Latin America Smart City Market Forecast (USD Billion), by Rest of Latin America, 2016-2027
Figure 47: Europe Smart City Market Value Share (%), By Segment 1, 2019 & 2027
Figure 48: Europe Smart City Market Forecast (USD Billion), by Sub-Segment 1, 2016-2027
Figure 49: Europe Smart City Market Forecast (USD Billion), by Sub-Segment 2, 2016-2027
Figure 50: Europe Smart City Market Value Share (%), By Segment 2, 2019 & 2027
Figure 51: Europe Smart City Market Forecast (USD Billion), by Sub-Segment 1, 2016-2027
Figure 52: Europe Smart City Market Forecast (USD Billion), by Sub-Segment 2, 2016-2027
Figure 53: Europe Smart City Market Forecast (USD Billion), by Sub-Segment 3, 2016-2027
Figure 54: Europe Smart City Market Forecast (USD Billion), by Others, 2016-2027
Figure 55: Europe Smart City Market Value Share (%), By Segment 3, 2019 & 2027
Figure 56: Europe Smart City Market Forecast (USD Billion), by Sub-Segment 1, 2016-2027
Figure 57: Europe Smart City Market Forecast (USD Billion), by Sub-Segment 2, 2016-2027
Figure 58: Europe Smart City Market Forecast (USD Billion), by Sub-Segment 3, 2016-2027
Figure 59: Europe Smart City Market Forecast (USD Billion), by Others, 2016-2027
Figure 60: Europe Smart City Market Forecast (USD Billion), by U.K., 2016-2027
Figure 61: Europe Smart City Market Forecast (USD Billion), by Germany, 2016-2027
Figure 62: Europe Smart City Market Forecast (USD Billion), by France, 2016-2027
Figure 63: Europe Smart City Market Forecast (USD Billion), by Italy, 2016-2027
Figure 64: Europe Smart City Market Forecast (USD Billion), by Spain, 2016-2027
Figure 65: Europe Smart City Market Forecast (USD Billion), by Russia, 2016-2027
Figure 66: Europe Smart City Market Forecast (USD Billion), by Rest of Europe, 2016-2027
Figure 67: Asia Pacific Smart City Market Value Share (%), By Segment 1, 2019 & 2027
Figure 68: Asia Pacific Smart City Market Forecast (USD Billion), by Sub-Segment 1, 2016-2027
Figure 69: Asia Pacific Smart City Market Forecast (USD Billion), by Sub-Segment 2, 2016-2027
Figure 70: Asia Pacific Smart City Market Value Share (%), By Segment 2, 2019 & 2027
Figure 71: Asia Pacific Smart City Market Forecast (USD Billion), by Sub-Segment 1, 2016-2027
Figure 72: Asia Pacific Smart City Market Forecast (USD Billion), by Sub-Segment 2, 2016-2027
Figure 73: Asia Pacific Smart City Market Forecast (USD Billion), by Sub-Segment 3, 2016-2027
Figure 74: Asia Pacific Smart City Market Forecast (USD Billion), by Others, 2016-2027
Figure 75: Asia Pacific Smart City Market Value Share (%), By Segment 3, 2019 & 2027
Figure 76: Asia Pacific Smart City Market Forecast (USD Billion), by Sub-Segment 1, 2016-2027
Figure 77: Asia Pacific Smart City Market Forecast (USD Billion), by Sub-Segment 2, 2016-2027
Figure 78: Asia Pacific Smart City Market Forecast (USD Billion), by Sub-Segment 3, 2016-2027
Figure 79: Asia Pacific Smart City Market Forecast (USD Billion), by Others, 2016-2027
Figure 80: Asia Pacific Smart City Market Forecast (USD Billion), by China, 2016-2027
Figure 81: Asia Pacific Smart City Market Forecast (USD Billion), by India, 2016-2027
Figure 82: Asia Pacific Smart City Market Forecast (USD Billion), by Japan, 2016-2027
Figure 83: Asia Pacific Smart City Market Forecast (USD Billion), by Australia, 2016-2027
Figure 84: Asia Pacific Smart City Market Forecast (USD Billion), by Southeast Asia, 2016-2027
Figure 85: Asia Pacific Smart City Market Forecast (USD Billion), by Rest of Asia Pacific, 2016-2027
Figure 86: Middle East & Africa Smart City Market Value Share (%), By Segment 1, 2019 & 2027
Figure 87: Middle East & Africa Smart City Market Forecast (USD Billion), by Sub-Segment 1, 2016-2027
Figure 88: Middle East & Africa Smart City Market Forecast (USD Billion), by Sub-Segment 2, 2016-2027
Figure 89: Middle East & Africa Smart City Market Value Share (%), By Segment 2, 2019 & 2027
Figure 90: Middle East & Africa Smart City Market Forecast (USD Billion), by Sub-Segment 1, 2016-2027
Figure 91: Middle East & Africa Smart City Market Forecast (USD Billion), by Sub-Segment 2, 2016-2027
Figure 92: Middle East & Africa Smart City Market Forecast (USD Billion), by Sub-Segment 3, 2016-2027
Figure 93: Middle East & Africa Smart City Market Forecast (USD Billion), by Others, 2016-2027
Figure 94: Middle East & Africa Smart City Market Value Share (%), By Segment 3, 2019 & 2027
Figure 95: Middle East & Africa Smart City Market Forecast (USD Billion), by Sub-Segment 1, 2016-2027
Figure 96: Middle East & Africa Smart City Market Forecast (USD Billion), by Sub-Segment 2, 2016-2027
Figure 97: Middle East & Africa Smart City Market Forecast (USD Billion), by Sub-Segment 3, 2016-2027
Figure 98: Middle East & Africa Smart City Market Forecast (USD Billion), by Others, 2016-2027
Figure 99: Middle East & Africa Smart City Market Forecast (USD Billion), by GCC, 2016-2027
Figure 100: Middle East & Africa Smart City Market Forecast (USD Billion), by South Africa, 2016-2027
Figure 101: Middle East & Africa Smart City Market Forecast (USD Billion), by Rest of Middle East & Africa, 2016-2027
List of Tables
Table 1: Global Smart City Market Revenue (USD Billion) Forecast, by Segment 1, 2016-2027
Table 2: Global Smart City Market Revenue (USD Billion) Forecast, by Segment 2, 2016-2027
Table 3: Global Smart City Market Revenue (USD Billion) Forecast, by Segment 3, 2016-2027
Table 4: Global Smart City Market Revenue (USD Billion) Forecast, by Region, 2016-2027
Table 5: North America Smart City Market Revenue (USD Billion) Forecast, by Segment 1, 2016-2027
Table 6: North America Smart City Market Revenue (USD Billion) Forecast, by Segment 2, 2016-2027
Table 7: North America Smart City Market Revenue (USD Billion) Forecast, by Segment 3, 2016-2027
Table 8: North America Smart City Market Revenue (USD Billion) Forecast, by Country, 2016-2027
Table 9: Europe Smart City Market Revenue (USD Billion) Forecast, by Segment 1, 2016-2027
Table 10: Europe Smart City Market Revenue (USD Billion) Forecast, by Segment 2, 2016-2027
Table 11: Europe Smart City Market Revenue (USD Billion) Forecast, by Segment 3, 2016-2027
Table 12: Europe Smart City Market Revenue (USD Billion) Forecast, by Country, 2016-2027
Table 13: Latin America Smart City Market Revenue (USD Billion) Forecast, by Segment 1, 2016-2027
Table 14: Latin America Smart City Market Revenue (USD Billion) Forecast, by Segment 2, 2016-2027
Table 15: Latin America Smart City Market Revenue (USD Billion) Forecast, by Segment 3, 2016-2027
Table 16: Latin America Smart City Market Revenue (USD Billion) Forecast, by Country, 2016-2027
Table 17: Asia Pacific Smart City Market Revenue (USD Billion) Forecast, by Segment 1, 2016-2027
Table 18: Asia Pacific Smart City Market Revenue (USD Billion) Forecast, by Segment 2, 2016-2027
Table 19: Asia Pacific Smart City Market Revenue (USD Billion) Forecast, by Segment 3, 2016-2027
Table 20: Asia Pacific Smart City Market Revenue (USD Billion) Forecast, by Country, 2016-2027
Table 21: Middle East & Africa Smart City Market Revenue (USD Billion) Forecast, by Segment 1, 2016-2027
Table 22: Middle East & Africa Smart City Market Revenue (USD Billion) Forecast, by Segment 2, 2016-2027
Table 23: Middle East & Africa Smart City Market Revenue (USD Billion) Forecast, by Segment 3, 2016-2027
Table 24: Middle East & Africa Smart City Market Revenue (USD Billion) Forecast, by Country, 2016-2027
Research Process
Data Library Research are conducted by industry experts who offer insight on
industry structure, market segmentations technology assessment and competitive landscape (CL), and penetration, as well as on emerging trends. Their analysis is based on primary interviews (~ 80%) and secondary research (~ 20%) as well as years of professional expertise in their respective industries. Adding to this, by analysing historical trends and current market positions, our analysts predict where the market will be headed for the next five years. Furthermore, the varying trends of segment & categories geographically presented are also studied and the estimated based on the primary & secondary research.
In this particular report from the supply side Data Library Research has conducted primary surveys (interviews) with the key level executives (VP, CEO’s, Marketing Director, Business Development Manager
and SOFT) of the companies that active & prominent as well as the midsized organization
FIGURE 1: DLR RESEARH PROCESS
![research-methodology1]()
Primary Research
Extensive primary research was conducted to gain a deeper insight of the market and industry performance. The analysis is based on both primary and secondary research as well as years of professional expertise in the respective industries.
In addition to analysing current and historical trends, our analysts predict where the market is headed over the next five years.
It varies by segment for these categories geographically presented in the list of market tables. Speaking about this particular report we have conducted primary surveys (interviews) with the key level executives (VP, CEO’s, Marketing Director, Business Development Manager and many more) of the major players active in the market.
Secondary Research
Secondary research was mainly used to collect and identify information useful for the extensive, technical, market-oriented, and Friend’s study of the Global Extra Neutral Alcohol. It was also used to obtain key information about major players, market classification and segmentation according to the industry trends, geographical markets, and developments related to the market and technology perspectives. For this study, analysts have gathered information from various credible sources, such as annual reports, sec filings, journals, white papers, SOFT presentations, and company web sites.
Market Size Estimation
Both, top-down and bottom-up approaches were used to estimate and validate the size of the Global market and to estimate the size of various other dependent submarkets in the overall Extra Neutral Alcohol. The key players in the market were identified through secondary research and their market contributions in the respective geographies were determined through primary and secondary research.
Forecast Model
![research-methodology2]()