Smart Demand Response Market Overview and Analysis
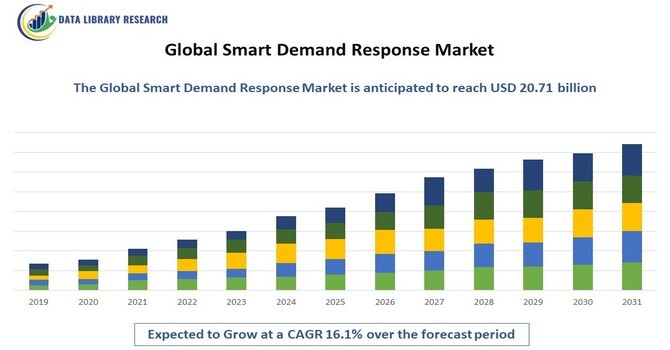
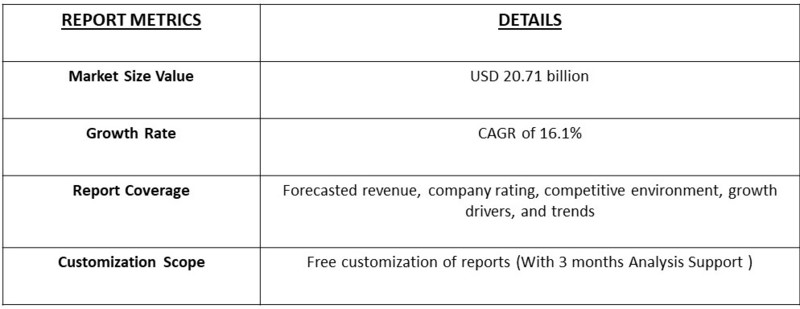
The global smart demand response market size was valued at USD 20.71 billion in 2022 and is expected to grow at a compound annual growth rate (CAGR) of 16.1% from 2023 to 2032
Get Complete Analysis Of The Report - Download Free Sample PDF
Smart Demand Response (SDR) is a critical component of modern energy management systems, enabling utilities and consumers to optimize electricity usage in real time. By leveraging advanced technologies such as IoT, AI, and big data analytics, SDR helps balance supply and demand, reduce peak load, and enhance grid stability.
Growing demand for power supplemented by capacity constraints is projected to boost growth in the global smart demand response market. The introduction of smart grid technologies such as smart meters and communication systems is probable to expand growth in the global smart demand response market.
Burgeoning power demand propels the adoption of demand response programs. Growing demand for power supplemented by capacity constraints is projected to boost growth in the global smart demand response market.
On the other hand, the high cost of technology and equipment and limited customer awareness of demand response programs can restrain the market’s growth. However, technological advancements and developments by top market players are expected to enhance the growth of the market.
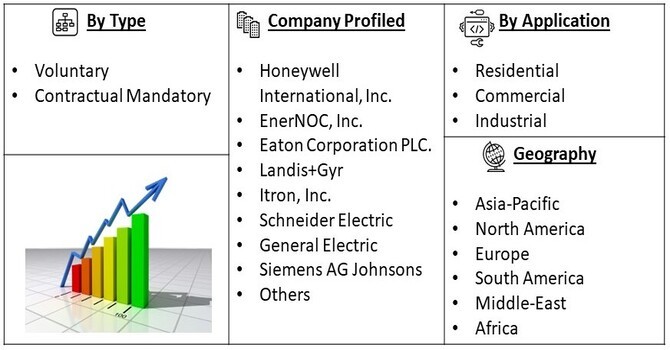
Smart Demand Response Market Segment
The residential segment is one of the fastest-growing segments. The introduction of smart meters and communication technology is likely to allow utilities to control residential loads. For residential customers, DR programs involve direct load control of the larger appliances at home. which includes water heaters, pool pumps, and air conditioning systems. Thus, considering the above-mentioned factor is expected to expand the market’s growth in the residential segment. Profitable financial incentives for the commercial and industrial segments are anticipated to record significant growth in these segments.
For Detailed Market Segmentation - Download Free Sample PDF
Smart Demand Response Market Regional
North America was dominated the global smart demand response market followed by Europe and the Asia Pacific. Electricity markets are identifying the need for demand response programs to manage scheduled or emergency downtime for power plants. In addition, demand response is also recognized as a mechanism to mitigate higher wholesale prices and lower overall grid costs in this region. Thus, Considering the aforementioned factors are likely to drive growth in North America’s smart demand response market. The market in Europe is expected to show noteworthy growth due to expected regulatory support through a change in the demand response policies. The Asia Pacific is expected to grow at the highest rates in the future. Owing to bigger adoption of demand response in the Asia Pacific is projected to drive growth in the market.
Smart Demand Response Market Competitor overview
Ø July 2016, developed in its Building Automation & HVAC Centre in Montreal, Schneider Electric announced its Wiser Air Wi-Fi smart thermostat—featuring the new Eco IQ self-learning feature—is now available across Canada.
Ø April 2014, Honeywell has announced a two- year program with CPS Energy in San Antonio, Texas. The utility will use automated demand response (ADR) technology and services from Honeywell to connect and collaborate with commercial and industrial customers, and adjust electricity consumption when the demand for energy peaks.
Smart Demand Response Market, By Application
· Residential
· Commercial
· Industrial
Smart Demand Response Market, By Region
- North America
- Europe
- UK
- Germany
- France
- Italy
- Spain
- Rest of Europe
- Asia-Pacific
- Japan
- China
- India
- Australia
- South Korea
- Rest of Asia-Pacific
- South America
- Brazil
- Argentina
- Rest of South America
- Middle East and Africa
- GCC
- South Africa
- Rest of Middle East and Africa
Get Complete Analysis Of The Report - Download Free Sample PDF
Smart Demand Response Market, Key Players
- Honeywell International, Inc.
- EnerNOC, Inc.
- Eaton Corporation PLC.
- Landis+Gyr
- Itron, Inc.
- Schneider Electric
- General Electric
- Siemens AG Johnsons Control, Inc.
- BB
- Comverge, Inc.
- Opower, Inc
List of Figures
Figure 1: Global Smart Demand Response Market Revenue Breakdown (USD Billion, %) by Region, 2019 & 2027
Figure 2: Global Smart Demand Response Market Value Share (%), By Segment 1, 2019 & 2027
Figure 3: Global Smart Demand Response Market Forecast (USD Billion), by Sub-Segment 1, 2016-2027
Figure 4: Global Smart Demand Response Market Forecast (USD Billion), by Sub-Segment 2, 2016-2027
Figure 5: Global Smart Demand Response Market Value Share (%), By Segment 2, 2019 & 2027
Figure 6: Global Smart Demand Response Market Forecast (USD Billion), by Sub-Segment 1, 2016-2027
Figure 7: Global Smart Demand Response Market Forecast (USD Billion), by Sub-Segment 2, 2016-2027
Figure 8: Global Smart Demand Response Market Forecast (USD Billion), by Sub-Segment 3, 2016-2027
Figure 9: Global Smart Demand Response Market Forecast (USD Billion), by Others, 2016-2027
Figure 10: Global Smart Demand Response Market Value Share (%), By Segment 3, 2019 & 2027
Figure 11: Global Smart Demand Response Market Forecast (USD Billion), by Sub-Segment 1, 2016-2027
Figure 12: Global Smart Demand Response Market Forecast (USD Billion), by Sub-Segment 2, 2016-2027
Figure 13: Global Smart Demand Response Market Forecast (USD Billion), by Sub-Segment 3, 2016-2027
Figure 14: Global Smart Demand Response Market Forecast (USD Billion), by Others, 2016-2027
Figure 15: Global Smart Demand Response Market Value (USD Billion), by Region, 2019 & 2027
Figure 16: North America Smart Demand Response Market Value Share (%), By Segment 1, 2019 & 2027
Figure 17: North America Smart Demand Response Market Forecast (USD Billion), by Sub-Segment 1, 2016-2027
Figure 18: North America Smart Demand Response Market Forecast (USD Billion), by Sub-Segment 2, 2016-2027
Figure 19: North America Smart Demand Response Market Value Share (%), By Segment 2, 2019 & 2027
Figure 20: North America Smart Demand Response Market Forecast (USD Billion), by Sub-Segment 1, 2016-2027
Figure 21: North America Smart Demand Response Market Forecast (USD Billion), by Sub-Segment 2, 2016-2027
Figure 22: North America Smart Demand Response Market Forecast (USD Billion), by Sub-Segment 3, 2016-2027
Figure 23: North America Smart Demand Response Market Forecast (USD Billion), by Others, 2016-2027
Figure 24: North America Smart Demand Response Market Value Share (%), By Segment 3, 2019 & 2027
Figure 25: North America Smart Demand Response Market Forecast (USD Billion), by Sub-Segment 1, 2016-2027
Figure 26: North America Smart Demand Response Market Forecast (USD Billion), by Sub-Segment 2, 2016-2027
Figure 27: North America Smart Demand Response Market Forecast (USD Billion), by Sub-Segment 3, 2016-2027
Figure 28: North America Smart Demand Response Market Forecast (USD Billion), by Others, 2016-2027
Figure 29: North America Smart Demand Response Market Forecast (USD Billion), by U.S., 2016-2027
Figure 30: North America Smart Demand Response Market Forecast (USD Billion), by Canada, 2016-2027
Figure 31: Latin America Smart Demand Response Market Value Share (%), By Segment 1, 2019 & 2027
Figure 32: Latin America Smart Demand Response Market Forecast (USD Billion), by Sub-Segment 1, 2016-2027
Figure 33: Latin America Smart Demand Response Market Forecast (USD Billion), by Sub-Segment 2, 2016-2027
Figure 34: Latin America Smart Demand Response Market Value Share (%), By Segment 2, 2019 & 2027
Figure 35: Latin America Smart Demand Response Market Forecast (USD Billion), by Sub-Segment 1, 2016-2027
Figure 36: Latin America Smart Demand Response Market Forecast (USD Billion), by Sub-Segment 2, 2016-2027
Figure 37: Latin America Smart Demand Response Market Forecast (USD Billion), by Sub-Segment 3, 2016-2027
Figure 38: Latin America Smart Demand Response Market Forecast (USD Billion), by Others, 2016-2027
Figure 39: Latin America Smart Demand Response Market Value Share (%), By Segment 3, 2019 & 2027
Figure 40: Latin America Smart Demand Response Market Forecast (USD Billion), by Sub-Segment 1, 2016-2027
Figure 41: Latin America Smart Demand Response Market Forecast (USD Billion), by Sub-Segment 2, 2016-2027
Figure 42: Latin America Smart Demand Response Market Forecast (USD Billion), by Sub-Segment 3, 2016-2027
Figure 43: Latin America Smart Demand Response Market Forecast (USD Billion), by Others, 2016-2027
Figure 44: Latin America Smart Demand Response Market Forecast (USD Billion), by Brazil, 2016-2027
Figure 45: Latin America Smart Demand Response Market Forecast (USD Billion), by Mexico, 2016-2027
Figure 46: Latin America Smart Demand Response Market Forecast (USD Billion), by Rest of Latin America, 2016-2027
Figure 47: Europe Smart Demand Response Market Value Share (%), By Segment 1, 2019 & 2027
Figure 48: Europe Smart Demand Response Market Forecast (USD Billion), by Sub-Segment 1, 2016-2027
Figure 49: Europe Smart Demand Response Market Forecast (USD Billion), by Sub-Segment 2, 2016-2027
Figure 50: Europe Smart Demand Response Market Value Share (%), By Segment 2, 2019 & 2027
Figure 51: Europe Smart Demand Response Market Forecast (USD Billion), by Sub-Segment 1, 2016-2027
Figure 52: Europe Smart Demand Response Market Forecast (USD Billion), by Sub-Segment 2, 2016-2027
Figure 53: Europe Smart Demand Response Market Forecast (USD Billion), by Sub-Segment 3, 2016-2027
Figure 54: Europe Smart Demand Response Market Forecast (USD Billion), by Others, 2016-2027
Figure 55: Europe Smart Demand Response Market Value Share (%), By Segment 3, 2019 & 2027
Figure 56: Europe Smart Demand Response Market Forecast (USD Billion), by Sub-Segment 1, 2016-2027
Figure 57: Europe Smart Demand Response Market Forecast (USD Billion), by Sub-Segment 2, 2016-2027
Figure 58: Europe Smart Demand Response Market Forecast (USD Billion), by Sub-Segment 3, 2016-2027
Figure 59: Europe Smart Demand Response Market Forecast (USD Billion), by Others, 2016-2027
Figure 60: Europe Smart Demand Response Market Forecast (USD Billion), by U.K., 2016-2027
Figure 61: Europe Smart Demand Response Market Forecast (USD Billion), by Germany, 2016-2027
Figure 62: Europe Smart Demand Response Market Forecast (USD Billion), by France, 2016-2027
Figure 63: Europe Smart Demand Response Market Forecast (USD Billion), by Italy, 2016-2027
Figure 64: Europe Smart Demand Response Market Forecast (USD Billion), by Spain, 2016-2027
Figure 65: Europe Smart Demand Response Market Forecast (USD Billion), by Russia, 2016-2027
Figure 66: Europe Smart Demand Response Market Forecast (USD Billion), by Rest of Europe, 2016-2027
Figure 67: Asia Pacific Smart Demand Response Market Value Share (%), By Segment 1, 2019 & 2027
Figure 68: Asia Pacific Smart Demand Response Market Forecast (USD Billion), by Sub-Segment 1, 2016-2027
Figure 69: Asia Pacific Smart Demand Response Market Forecast (USD Billion), by Sub-Segment 2, 2016-2027
Figure 70: Asia Pacific Smart Demand Response Market Value Share (%), By Segment 2, 2019 & 2027
Figure 71: Asia Pacific Smart Demand Response Market Forecast (USD Billion), by Sub-Segment 1, 2016-2027
Figure 72: Asia Pacific Smart Demand Response Market Forecast (USD Billion), by Sub-Segment 2, 2016-2027
Figure 73: Asia Pacific Smart Demand Response Market Forecast (USD Billion), by Sub-Segment 3, 2016-2027
Figure 74: Asia Pacific Smart Demand Response Market Forecast (USD Billion), by Others, 2016-2027
Figure 75: Asia Pacific Smart Demand Response Market Value Share (%), By Segment 3, 2019 & 2027
Figure 76: Asia Pacific Smart Demand Response Market Forecast (USD Billion), by Sub-Segment 1, 2016-2027
Figure 77: Asia Pacific Smart Demand Response Market Forecast (USD Billion), by Sub-Segment 2, 2016-2027
Figure 78: Asia Pacific Smart Demand Response Market Forecast (USD Billion), by Sub-Segment 3, 2016-2027
Figure 79: Asia Pacific Smart Demand Response Market Forecast (USD Billion), by Others, 2016-2027
Figure 80: Asia Pacific Smart Demand Response Market Forecast (USD Billion), by China, 2016-2027
Figure 81: Asia Pacific Smart Demand Response Market Forecast (USD Billion), by India, 2016-2027
Figure 82: Asia Pacific Smart Demand Response Market Forecast (USD Billion), by Japan, 2016-2027
Figure 83: Asia Pacific Smart Demand Response Market Forecast (USD Billion), by Australia, 2016-2027
Figure 84: Asia Pacific Smart Demand Response Market Forecast (USD Billion), by Southeast Asia, 2016-2027
Figure 85: Asia Pacific Smart Demand Response Market Forecast (USD Billion), by Rest of Asia Pacific, 2016-2027
Figure 86: Middle East & Africa Smart Demand Response Market Value Share (%), By Segment 1, 2019 & 2027
Figure 87: Middle East & Africa Smart Demand Response Market Forecast (USD Billion), by Sub-Segment 1, 2016-2027
Figure 88: Middle East & Africa Smart Demand Response Market Forecast (USD Billion), by Sub-Segment 2, 2016-2027
Figure 89: Middle East & Africa Smart Demand Response Market Value Share (%), By Segment 2, 2019 & 2027
Figure 90: Middle East & Africa Smart Demand Response Market Forecast (USD Billion), by Sub-Segment 1, 2016-2027
Figure 91: Middle East & Africa Smart Demand Response Market Forecast (USD Billion), by Sub-Segment 2, 2016-2027
Figure 92: Middle East & Africa Smart Demand Response Market Forecast (USD Billion), by Sub-Segment 3, 2016-2027
Figure 93: Middle East & Africa Smart Demand Response Market Forecast (USD Billion), by Others, 2016-2027
Figure 94: Middle East & Africa Smart Demand Response Market Value Share (%), By Segment 3, 2019 & 2027
Figure 95: Middle East & Africa Smart Demand Response Market Forecast (USD Billion), by Sub-Segment 1, 2016-2027
Figure 96: Middle East & Africa Smart Demand Response Market Forecast (USD Billion), by Sub-Segment 2, 2016-2027
Figure 97: Middle East & Africa Smart Demand Response Market Forecast (USD Billion), by Sub-Segment 3, 2016-2027
Figure 98: Middle East & Africa Smart Demand Response Market Forecast (USD Billion), by Others, 2016-2027
Figure 99: Middle East & Africa Smart Demand Response Market Forecast (USD Billion), by GCC, 2016-2027
Figure 100: Middle East & Africa Smart Demand Response Market Forecast (USD Billion), by South Africa, 2016-2027
Figure 101: Middle East & Africa Smart Demand Response Market Forecast (USD Billion), by Rest of Middle East & Africa, 2016-2027
List of Tables
Table 1: Global Smart Demand Response Market Revenue (USD Billion) Forecast, by Segment 1, 2016-2027
Table 2: Global Smart Demand Response Market Revenue (USD Billion) Forecast, by Segment 2, 2016-2027
Table 3: Global Smart Demand Response Market Revenue (USD Billion) Forecast, by Segment 3, 2016-2027
Table 4: Global Smart Demand Response Market Revenue (USD Billion) Forecast, by Region, 2016-2027
Table 5: North America Smart Demand Response Market Revenue (USD Billion) Forecast, by Segment 1, 2016-2027
Table 6: North America Smart Demand Response Market Revenue (USD Billion) Forecast, by Segment 2, 2016-2027
Table 7: North America Smart Demand Response Market Revenue (USD Billion) Forecast, by Segment 3, 2016-2027
Table 8: North America Smart Demand Response Market Revenue (USD Billion) Forecast, by Country, 2016-2027
Table 9: Europe Smart Demand Response Market Revenue (USD Billion) Forecast, by Segment 1, 2016-2027
Table 10: Europe Smart Demand Response Market Revenue (USD Billion) Forecast, by Segment 2, 2016-2027
Table 11: Europe Smart Demand Response Market Revenue (USD Billion) Forecast, by Segment 3, 2016-2027
Table 12: Europe Smart Demand Response Market Revenue (USD Billion) Forecast, by Country, 2016-2027
Table 13: Latin America Smart Demand Response Market Revenue (USD Billion) Forecast, by Segment 1, 2016-2027
Table 14: Latin America Smart Demand Response Market Revenue (USD Billion) Forecast, by Segment 2, 2016-2027
Table 15: Latin America Smart Demand Response Market Revenue (USD Billion) Forecast, by Segment 3, 2016-2027
Table 16: Latin America Smart Demand Response Market Revenue (USD Billion) Forecast, by Country, 2016-2027
Table 17: Asia Pacific Smart Demand Response Market Revenue (USD Billion) Forecast, by Segment 1, 2016-2027
Table 18: Asia Pacific Smart Demand Response Market Revenue (USD Billion) Forecast, by Segment 2, 2016-2027
Table 19: Asia Pacific Smart Demand Response Market Revenue (USD Billion) Forecast, by Segment 3, 2016-2027
Table 20: Asia Pacific Smart Demand Response Market Revenue (USD Billion) Forecast, by Country, 2016-2027
Table 21: Middle East & Africa Smart Demand Response Market Revenue (USD Billion) Forecast, by Segment 1, 2016-2027
Table 22: Middle East & Africa Smart Demand Response Market Revenue (USD Billion) Forecast, by Segment 2, 2016-2027
Table 23: Middle East & Africa Smart Demand Response Market Revenue (USD Billion) Forecast, by Segment 3, 2016-2027
Table 24: Middle East & Africa Smart Demand Response Market Revenue (USD Billion) Forecast, by Country, 2016-2027
Research Process
Data Library Research are conducted by industry experts who offer insight on
industry structure, market segmentations technology assessment and competitive landscape (CL), and penetration, as well as on emerging trends. Their analysis is based on primary interviews (~ 80%) and secondary research (~ 20%) as well as years of professional expertise in their respective industries. Adding to this, by analysing historical trends and current market positions, our analysts predict where the market will be headed for the next five years. Furthermore, the varying trends of segment & categories geographically presented are also studied and the estimated based on the primary & secondary research.
In this particular report from the supply side Data Library Research has conducted primary surveys (interviews) with the key level executives (VP, CEO’s, Marketing Director, Business Development Manager
and SOFT) of the companies that active & prominent as well as the midsized organization
FIGURE 1: DLR RESEARH PROCESS
![research-methodology1]()
Primary Research
Extensive primary research was conducted to gain a deeper insight of the market and industry performance. The analysis is based on both primary and secondary research as well as years of professional expertise in the respective industries.
In addition to analysing current and historical trends, our analysts predict where the market is headed over the next five years.
It varies by segment for these categories geographically presented in the list of market tables. Speaking about this particular report we have conducted primary surveys (interviews) with the key level executives (VP, CEO’s, Marketing Director, Business Development Manager and many more) of the major players active in the market.
Secondary Research
Secondary research was mainly used to collect and identify information useful for the extensive, technical, market-oriented, and Friend’s study of the Global Extra Neutral Alcohol. It was also used to obtain key information about major players, market classification and segmentation according to the industry trends, geographical markets, and developments related to the market and technology perspectives. For this study, analysts have gathered information from various credible sources, such as annual reports, sec filings, journals, white papers, SOFT presentations, and company web sites.
Market Size Estimation
Both, top-down and bottom-up approaches were used to estimate and validate the size of the Global market and to estimate the size of various other dependent submarkets in the overall Extra Neutral Alcohol. The key players in the market were identified through secondary research and their market contributions in the respective geographies were determined through primary and secondary research.
Forecast Model
![research-methodology2]()