Smart SOS Button Market Overview and Analysis

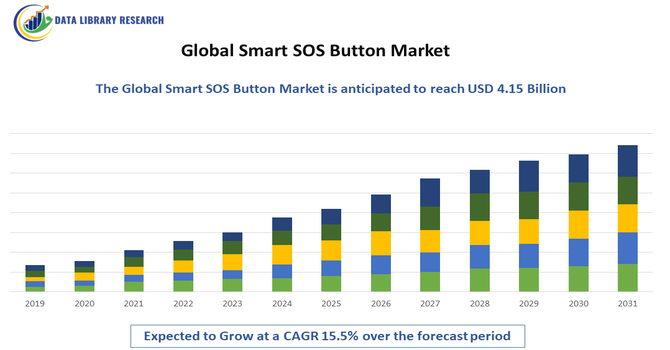
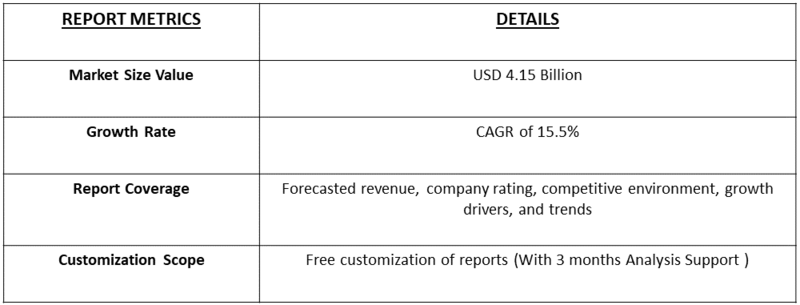
The Smart SOS Button Market size is estimated to be USD 1.32 Billion in 2025 and is expected to reach USD 4.15 Billion by 2032 at a CAGR of 15.5% from 2025-2032.

The Global Smart SOS Button Market refers to the rapidly growing industry centered around compact, connected emergency alert devices designed to enhance personal safety and security. These smart buttons, often integrated with GPS, mobile networks, and IoT platforms, allow users—such as the elderly, children, lone workers, and individuals in distress—to send real-time emergency alerts to caregivers, emergency services, or monitoring centers. Market growth is driven by rising safety concerns, advancements in wearable technology, increased adoption of smart home systems, and supportive government initiatives for public safety. Key sectors include healthcare, personal security, transportation, and industrial safety, with significant growth across North America, Europe, and Asia-Pacific.

Smart SOS Button Market Latest Trends

The Global Smart SOS Button Market is witnessing several key trends, including the increasing integration of advanced technologies such as GPS, Bluetooth, and cellular connectivity to improve real-time tracking and emergency response capabilities. There is a rising demand for compact, wearable, and discreet designs, particularly in personal safety, elderly care, and lone worker applications. The market is also seeing growth in IoT-enabled solutions that connect SOS buttons to broader smart home and healthcare systems. Additionally, the trend toward cloud-based monitoring platforms and AI-driven alert systems is enhancing response efficiency. The expansion of mobile health (mHealth), growing urbanization, and heightened awareness around personal safety are further driving adoption, while manufacturers are focusing on affordability and battery efficiency to meet consumer expectations.

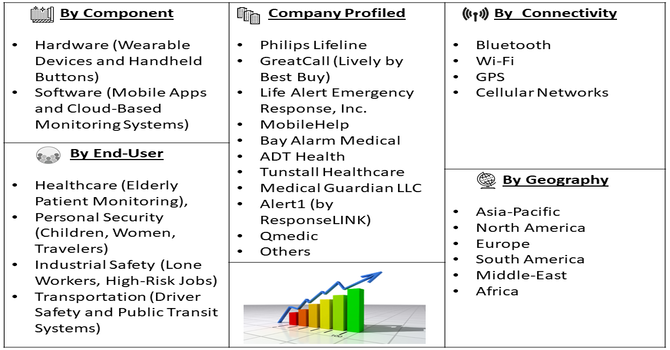
Segmentation: The Global Smart SOS Button Market is Segmented based by Component (Hardware (Wearable Devices and Handheld Buttons) and Software (Mobile Apps and Cloud-Based Monitoring Systems), Connectivity (Bluetooth, Wi-Fi, GPS, And Cellular Networks), End-User (Healthcare (Elderly Patient Monitoring), Personal Security (Children, Women, Travelers), Industrial Safety (Lone Workers, High-Risk Jobs), and Transportation (Driver Safety and Public Transit Systems)), and Geography (North America, Europe, Asia-Pacific, Latin America, Middle East & Africa). The report provides the value (in USD million) for the above segments.

Market Drivers:

  • Rising Demand for Personal Safety and Elderly Care Solutions

The growing global focus on personal safety, especially among vulnerable populations such as children, women, and the elderly, is a major driver of the Smart SOS Button Market. With an aging global population and increasing instances of seniors living independently, the need for reliable, easy-to-use emergency communication tools is more pressing than ever. Smart SOS buttons, often integrated with GPS and cellular connectivity, offer peace of mind to both users and caregivers by enabling instant alerts in case of falls, medical emergencies, or security threats. Governments and healthcare providers are also increasingly supporting the adoption of these devices as part of aging-in-place strategies, boosting demand across both developed and developing nations.

  • Integration with Smart Devices and IoT Ecosystems

The integration of smart SOS buttons with broader Internet of Things (IoT) ecosystems and connected devices is significantly propelling market growth. These buttons are now commonly compatible with smartphones, smartwatches, and home automation systems, allowing users to trigger alerts that can be transmitted in real-time to designated contacts or emergency services.

Enhanced interoperability with apps and cloud platforms improves monitoring, tracking, and response times, making the devices more attractive for personal and professional use. For instance, in March 2021, Kaye, a well-known name in life sciences monitoring, has upgraded its technology by moving to the cloud and using Big Data. Their new system, called LabWatch IoT, is an advanced version of their earlier LabWatch Pro system. It allows users to connect easily, access their data securely from anywhere, and analyze it more effectively. This upgrade means better monitoring, faster decision-making, and stronger security for labs and pharmaceutical companies. With this step, Kaye is staying ahead of the competition by offering smarter, more connected solutions for continuous monitoring in life sciences. As smart city infrastructure and home automation become more widespread, the demand for SOS buttons as a seamless part of connected living continues to rise. This trend is particularly prominent in urban areas, where safety and rapid response capabilities are top priorities.

Market Restraints:

  • Privacy Concerns and Data Security Risks

Despite their benefits, smart SOS buttons raise significant privacy and data security concerns that can hinder market growth. These devices often collect sensitive information such as real-time location, health data, and user activity, which, if not properly secured, could be vulnerable to hacking or unauthorized access. Many users, particularly in regions with strict data protection laws like the EU, are hesitant to adopt such technology without strong assurances of compliance with privacy regulations such as GDPR. Additionally, low-cost devices may lack robust encryption and security protocols, increasing the risk of data breaches. Concerns over who has access to the data, how it is stored, and for how long can reduce user trust, thereby limiting widespread adoption.

Socio Economic Impact on Smart SOS Button Market

The socio-economic impact of the Global Smart SOS Button Market is significant, as it enhances personal safety, supports independent living, and reduces emergency response times, particularly for vulnerable populations such as the elderly, women, children, and lone workers. By enabling real-time alerts and location tracking, these devices contribute to lowering healthcare costs through early intervention and reducing the burden on emergency services. In developing regions, affordable SOS technologies can bridge safety gaps where infrastructure is limited. Economically, the market creates opportunities in hardware manufacturing, software development, and telehealth services, contributing to job creation and technological innovation. Socially, the widespread adoption of smart SOS buttons promotes a sense of security and autonomy, fostering safer communities and improving overall quality of life.

Segmental Analysis:

  • Cloud-Based Monitoring Systems Segment is Expected to Witness Significant Growth Over the Forecast Period

The cloud-based monitoring segment is poised for explosive growth, driven by the global shift toward remote infrastructure management, digital transformation, and the widespread adoption of DevOps and Site Reliability Engineering (SRE) practices. These solutions offer unparalleled scalability, flexibility, and cost efficiency compared to legacy on-premises systems, allowing organizations to maintain real-time visibility across complex hybrid and multi-cloud environments. The market is witnessing a notable growth in some regions, fueled by the accelerating expansion of hyperscale and edge data centers. Key growth factors include the demand for AI-enabled predictive monitoring to detect anomalies and perform maintenance proactively, ensuring optimal performance and security across cloud storage, virtual networks, and critical applications. This trend solidifies cloud monitoring as an essential layer in modern IT and telecom infrastructure.

  • Elderly Patient Monitoring Segment is Expected to Witness Significant Growth Over the Forecast Period

The elderly patient monitoring segment is undergoing robust expansion, fundamentally driven by the rapid aging of the global population and the corresponding increase in chronic diseases (like diabetes and cardiovascular conditions). This demographic shift, coupled with a growing preference for "aging-in-place," is escalating the demand for effective remote patient monitoring (RPM) and telehealth solutions. Technological advancements, particularly the integration of Artificial Intelligence (AI) and Internet of Things (IoT) sensors into wearable devices, are crucial, enabling continuous, real-time health data tracking. These systems facilitate proactive, personalized care, reduce the need for expensive hospital visits, and offer peace of mind to caregivers. As healthcare systems transition toward value-based, patient-centric models, the market, projected to achieve double-digit CAGR, is seeing high investment in both portable and fixed monitoring systems.

  • Public Transit Systems Segment is Expected to Witness Significant Growth Over the Forecast Period

Significant growth in the public transit systems market is fueled by increasing global urbanization, rising environmental concerns, and substantial government investments in smart city infrastructure. The primary driver is the modernization of both rail and road-based transit, focusing on Intelligent Transportation Systems (ITS) to enhance efficiency and passenger experience. Key technology segments experiencing rapid growth include smart ticketing systems—driven by the growing demand for contactless and digital payment solutions—and real-time monitoring for automated signaling and predictive maintenance. While recovering from pre-pandemic ridership levels, the market is poised for strong expansion, particularly as cities commit to sustainable mobility goals through the adoption of electric and hybrid buses, improving service reliability and reducing carbon footprints.

  • North America Region is Expected to Witness Significant Growth Over the Forecast Period

North America is projected to maintain its leading position and witness significant growth across several high-tech markets, particularly in healthcare and cloud computing. This robust expansion is attributed to the region’s advanced technological landscape, high rate of digital adoption, and massive investment in IT infrastructure. @@@@ Specifically, the Artificial Intelligence (AI) in healthcare market is a massive growth engine, driven by the adoption of robot-assisted surgery, machine learning for diagnostics, and telemedicine services. Furthermore, North America leads the cloud monitoring market due to the presence of major cloud service providers. Government initiatives, a well-established healthcare system, and a cultural embrace of innovation and early technology adoption solidify the region's forecast for continued market dominance.

Smart SOS Button Market Competitive Landscape

The competitive landscape of the Global Smart SOS Button Market is characterized by the presence of a mix of established technology firms, healthcare device manufacturers, and emerging startups focused on personal safety solutions. Key players compete on the basis of product innovation, connectivity features, design, pricing, and integration with smartphones and IoT platforms. Companies such as Philips Lifeline, GreatCall (now part of Best Buy), Life Alert, and MobileHelp dominate the healthcare segment, while newer entrants focus on consumer wearables and smart home integration. Strategic partnerships, mergers, and acquisitions are common as firms aim to expand market reach and technological capabilities. Additionally, regional players are gaining traction by offering cost-effective, localized solutions tailored to specific demographic and regulatory needs.

The 20 major players for this market are:

  • Philips Lifeline
  • GreatCall (Lively by Best Buy)
  • Life Alert Emergency Response, Inc.
  • MobileHelp
  • Bay Alarm Medical
  • ADT Health
  • Tunstall Healthcare
  • Medical Guardian LLC
  • Alert1 (by ResponseLINK)
  • QMedic
  • Freedom Guardian
  • Mytrex Inc. (MXD Devices)
  • Guardian Alarm
  • Safe365
  • Trackimo
  • Jiobit (by Life360)
  • AngelSense
  • NurtureWatch
  • Revolar
  • CarePredict

Recent Development:

  • In May 2025, New York City Mayor Eric Adams has announced USD 1.6 million in funding to make bodegas (small local shops) safer. About 500 bodegas across the city will get new emergency buttons called “SilentShields.” This move shows how cities are starting to use smart emergency buttons to protect not just people at home, but also workers in small shops. It proves there's growing interest in simple, fast-response safety tech. As more cities and businesses see how useful these systems are, the demand for smart SOS buttons will likely grow, pushing the market to expand and improve even more.


  • In February 2025, Ranchi, the capital of Jharkhand, has launched a new safety initiative called the Emergency Call Box. These call boxes have been set up at key traffic intersections and let people quickly report accidents, crimes, or emergencies just by pressing a button. This move shows how city governments are starting to use smart SOS technologies in public places, not just in homes or personal devices. It highlights a growing need for easy-to-use, reliable emergency systems in smart cities. As more cities follow Ranchi's example, the global market for smart SOS buttons is expected to grow, especially in urban infrastructure and public safety sectors.


Frequently Asked Questions (FAQ) :

Q1. What the main growth driving factors for this market?

The market is primarily driven by increasing global concerns over personal safety, particularly among women, children, and the elderly, coupled with rising crime rates. Rapid technological advancements, including the integration of AI, IoT, and high-precision GPS tracking, significantly enhance device functionality, offering reliable real-time monitoring and emergency response. Furthermore, government initiatives promoting personal safety and security solutions are also accelerating adoption across various demographics.

Q2. What are the main restraining factors for this market?

Major restraining factors include concerns over data privacy, security breaches, and potential misuse of highly personal location data collected by these smart devices. Additionally, the limited battery capacity of many battery-powered personal safety wearables is a key deterrent, as users may find continuous charging inconvenient, rendering the device useless in a critical, low-power emergency situation.

Q3. Which segment is expected to witness high growth?

The Mobile-Based Personal Emergency Response System (mPERS) segment is expected to witness the highest growth rate. This is largely driven by the rising geriatric population seeking independent living and the increasing preference for portable, wireless systems over traditional landline-based units. The high growth is fueled by mobile PERS devices' advanced features like GPS tracking, fall detection, and seamless integration with smartphone applications.

Q4. Who are the top major players for this market?

The global market for smart SOS buttons and personal safety devices is highly competitive, featuring key players from various tech and security sectors. Some of the top major players include established names in the medical alert and security space like ADT, Life Alert Emergency Response, and Connect America (Lifeline). Additionally, technology giants and wearable companies such as Fitbit (Google-owned) and Honeywell International also hold significant influence.

Q5. Which country is the largest player?

North America is the largest and most dominant regional player in the global Smart SOS Button and related medical alert systems market. The region’s leadership is attributed to high consumer awareness regarding personal safety, the presence of a strong, established healthcare infrastructure, and the early, widespread adoption of advanced technologies like IoT and smart wearables, especially in the United States and Canada.

Smart SOS Button MARKET STUDY GLOBAL MARKET ANALYSIS, INSIGHTS AND FORECAST, 2023-2029

    1. Introduction

    • 1.1. Research Scope
    • 1.2. Market Segmentation
    • 1.3. Research Methodology
    • 1.4. Definitions and Assumptions

    2. Executive Summary

      3. Market Dynamics

      • 3.1. Market Drivers
      • 3.2. Market Restraints
      • 3.3. Market Opportunities

      4. Key Insights

      • 4.1. Key Emerging Trends – For Major Countries
      • 4.2. Latest Technological Advancement
      • 4.3. Regulatory Landscape
      • 4.4. Industry SWOT Analysis
      • 4.5. Porters Five Forces Analysis

      5. Global Smart SOS Button Market Analysis (USD Billion), Insights and Forecast, 2018-2029

      • 5.1. Key Findings / Summary
      • 5.2. Market Analysis, Insights and Forecast – By Segment 1
        • 5.2.1. Sub-Segment 1
        • 5.2.2. Sub-Segment 2
      • 5.3. Market Analysis, Insights and Forecast – By Segment 2
        • 5.3.1. Sub-Segment 1
        • 5.3.2. Sub-Segment 2
        • 5.3.3. Sub-Segment 3
        • 5.3.4. Others
      • 5.4. Market Analysis, Insights and Forecast – By Segment 3
        • 5.4.1. Sub-Segment 1
        • 5.4.2. Sub-Segment 2
        • 5.4.3. Sub-Segment 3
        • 5.4.4. Others
      • 5.5. Market Analysis, Insights and Forecast – By Region
        • 5.5.1. North America
        • 5.5.2. Latin America
        • 5.5.3. Europe
        • 5.5.4. Asia Pacific
        • 5.5.5. Middle East and Africa

      6. North America Smart SOS Button Market Analysis (USD Billion), Insights and Forecast, 2018-2029

      • 6.1. Key Findings / Summary
      • 6.2. Market Analysis, Insights and Forecast – By Segment 1
        • 6.2.1. Sub-Segment 1
        • 6.2.2. Sub-Segment 2
      • 6.3. Market Analysis, Insights and Forecast – By Segment 2
        • 6.3.1. Sub-Segment 1
        • 6.3.2. Sub-Segment 2
        • 6.3.3. Sub-Segment 3
        • 6.3.4. Others
      • 6.4. Market Analysis, Insights and Forecast – By Segment 3
        • 6.4.1. Sub-Segment 1
        • 6.4.2. Sub-Segment 2
        • 6.4.3. Sub-Segment 3
        • 6.4.4. Others
      • 6.5. Market Analysis, Insights and Forecast – By Country
        • 6.5.1. U.S.
        • 6.5.2. Canada

      7. Latin America Smart SOS Button Market Analysis (USD Billion), Insights and Forecast, 2018-2029

      • 7.1. Key Findings / Summary
      • 7.2. Market Analysis, Insights and Forecast – By Segment 1
        • 7.2.1. Sub-Segment 1
        • 7.2.2. Sub-Segment 2
      • 7.3. Market Analysis, Insights and Forecast – By Segment 2
        • 7.3.1. Sub-Segment 1
        • 7.3.2. Sub-Segment 2
        • 7.3.3. Sub-Segment 3
        • 7.3.4. Others
      • 7.4. Market Analysis, Insights and Forecast – By Segment 3
        • 7.4.1. Sub-Segment 1
        • 7.4.2. Sub-Segment 2
        • 7.4.3. Sub-Segment 3
        • 7.4.4. Others
      • 7.5. Insights and Forecast – By Country
        • 7.5.1. Brazil
        • 7.5.2. Mexico
        • 7.5.3. Rest of Latin America

      8. Europe Smart SOS Button Market Analysis (USD Billion), Insights and Forecast, 2018-2029

      • 8.1. Key Findings / Summary
      • 8.2. Market Analysis, Insights and Forecast – By Segment 1
        • 8.2.1. Sub-Segment 1
        • 8.2.2. Sub-Segment 2
      • 8.3. Market Analysis, Insights and Forecast – By Segment 2
        • 8.3.1. Sub-Segment 1
        • 8.3.2. Sub-Segment 2
        • 8.3.3. Sub-Segment 3
        • 8.3.4. Others
      • 8.4. Market Analysis, Insights and Forecast – By Segment 3
        • 8.4.1. Sub-Segment 1
        • 8.4.2. Sub-Segment 2
        • 8.4.3. Sub-Segment 3
        • 8.4.4. Others
      • 8.5. Market Analysis, Insights and Forecast – By Country
        • 8.5.1. UK
        • 8.5.2. Germany
        • 8.5.3. France
        • 8.5.4. Italy
        • 8.5.5. Spain
        • 8.5.6. Russia
        • 8.5.7. Rest of Europe

      9. Asia Pacific Smart SOS Button Market Analysis (USD Billion), Insights and Forecast, 2018-2029

      • 9.1. Key Findings / Summary
      • 9.2. Market Analysis, Insights and Forecast – By Segment 1
        • 9.2.1. Sub-Segment 1
        • 9.2.2. Sub-Segment 2
      • 9.3. Market Analysis, Insights and Forecast – By Segment 2
        • 9.3.1. Sub-Segment 1
        • 9.3.2. Sub-Segment 2
        • 9.3.3. Sub-Segment 3
        • 9.3.4. Others
      • 9.4. Market Analysis, Insights and Forecast – By Segment 3
        • 9.4.1. Sub-Segment 1
        • 9.4.2. Sub-Segment 2
        • 9.4.3. Sub-Segment 3
        • 9.4.4. Others
      • 9.5. Market Analysis, Insights and Forecast – By Country
        • 9.5.1. China
        • 9.5.2. India
        • 9.5.3. Japan
        • 9.5.4. Australia
        • 9.5.5. South East Asia
        • 9.5.6. Rest of Asia Pacific

      10. Middle East & Africa Smart SOS Button Market Analysis (USD Billion), Insights and Forecast, 2018-2029

      • 10.1. Key Findings / Summary
      • 10.2. Market Analysis, Insights and Forecast – By Segment 1
        • 10.2.1. Sub-Segment 1
        • 10.2.2. Sub-Segment 2
      • 10.3. Market Analysis, Insights and Forecast – By Segment 2
        • 10.3.1. Sub-Segment 1
        • 10.3.2. Sub-Segment 2
        • 10.3.3. Sub-Segment 3
        • 10.3.4. Others
      • 10.4. Market Analysis, Insights and Forecast – By Segment 3
        • 10.4.1. Sub-Segment 1
        • 10.4.2. Sub-Segment 2
        • 10.4.3. Sub-Segment 3
        • 10.4.4. Others
      • 10.5. Market Analysis, Insights and Forecast – By Country
        • 10.5.1. GCC
        • 10.5.2. South Africa
        • 10.5.3. Rest of Middle East & Africa

      11. Competitive Analysis

      • 11.1. Company Market Share Analysis, 2018
      • 11.2. Key Industry Developments
      • 11.3. Company Profile
        • 11.3.1. Company 1
          • 11.3.1.1. Business Overview
          • 11.3.1.2. Segment 1 & Service Offering
          • 11.3.1.3. Overall Revenue
          • 11.3.1.4. Geographic Presence
          • 11.3.1.5. Recent Development
        *Similar details will be provided for the following companies
        • 11.3.2. Company 2
        • 11.3.3. Company 3
        • 11.3.4. Company 4
        • 11.3.5. Company 5
        • 11.3.6. Company 6
        • 11.3.7. Company 7
        • 11.3.8. Company 8
        • 11.3.9. Company 9
        • 11.3.10. Company 10
        • 11.3.11. Company 11
        • 11.3.12. Company 12
      List of Figures

      Figure 1: Global Smart SOS Button Market Revenue Breakdown (USD Billion, %) by Region, 2023 & 2029
      Figure 2: Global Smart SOS Button Market Value Share (%), By Segment 1, 2023 & 2029
      Figure 3: Global Smart SOS Button Market Forecast (USD Billion), by Sub-Segment 1, 2018-2029
      Figure 4: Global Smart SOS Button Market Forecast (USD Billion), by Sub-Segment 2, 2018-2029
      Figure 5: Global Smart SOS Button Market Value Share (%), By Segment 2, 2023 & 2029
      Figure 6: Global Smart SOS Button Market Forecast (USD Billion), by Sub-Segment 1, 2018-2029
      Figure 7: Global Smart SOS Button Market Forecast (USD Billion), by Sub-Segment 2, 2018-2029
      Figure 8: Global Smart SOS Button Market Forecast (USD Billion), by Sub-Segment 3, 2018-2029
      Figure 9: Global Smart SOS Button Market Forecast (USD Billion), by Others, 2018-2029
      Figure 10: Global Smart SOS Button Market Value Share (%), By Segment 3, 2023 & 2029
      Figure 11: Global Smart SOS Button Market Forecast (USD Billion), by Sub-Segment 1, 2018-2029
      Figure 12: Global Smart SOS Button Market Forecast (USD Billion), by Sub-Segment 2, 2018-2029
      Figure 13: Global Smart SOS Button Market Forecast (USD Billion), by Sub-Segment 3, 2018-2029
      Figure 14: Global Smart SOS Button Market Forecast (USD Billion), by Others, 2018-2029
      Figure 15: Global Smart SOS Button Market Value (USD Billion), by Region, 2023 & 2029
      Figure 16: North America Smart SOS Button Market Value Share (%), By Segment 1, 2023 & 2029
      Figure 17: North America Smart SOS Button Market Forecast (USD Billion), by Sub-Segment 1, 2018-2029
      Figure 18: North America Smart SOS Button Market Forecast (USD Billion), by Sub-Segment 2, 2018-2029
      Figure 19: North America Smart SOS Button Market Value Share (%), By Segment 2, 2023 & 2029
      Figure 20: North America Smart SOS Button Market Forecast (USD Billion), by Sub-Segment 1, 2018-2029
      Figure 21: North America Smart SOS Button Market Forecast (USD Billion), by Sub-Segment 2, 2018-2029
      Figure 22: North America Smart SOS Button Market Forecast (USD Billion), by Sub-Segment 3, 2018-2029
      Figure 23: North America Smart SOS Button Market Forecast (USD Billion), by Others, 2018-2029
      Figure 24: North America Smart SOS Button Market Value Share (%), By Segment 3, 2023 & 2029
      Figure 25: North America Smart SOS Button Market Forecast (USD Billion), by Sub-Segment 1, 2018-2029
      Figure 26: North America Smart SOS Button Market Forecast (USD Billion), by Sub-Segment 2, 2018-2029
      Figure 27: North America Smart SOS Button Market Forecast (USD Billion), by Sub-Segment 3, 2018-2029
      Figure 28: North America Smart SOS Button Market Forecast (USD Billion), by Others, 2018-2029
      Figure 29: North America Smart SOS Button Market Forecast (USD Billion), by U.S., 2018-2029
      Figure 30: North America Smart SOS Button Market Forecast (USD Billion), by Canada, 2018-2029
      Figure 31: Latin America Smart SOS Button Market Value Share (%), By Segment 1, 2023 & 2029
      Figure 32: Latin America Smart SOS Button Market Forecast (USD Billion), by Sub-Segment 1, 2018-2029
      Figure 33: Latin America Smart SOS Button Market Forecast (USD Billion), by Sub-Segment 2, 2018-2029
      Figure 34: Latin America Smart SOS Button Market Value Share (%), By Segment 2, 2023 & 2029
      Figure 35: Latin America Smart SOS Button Market Forecast (USD Billion), by Sub-Segment 1, 2018-2029
      Figure 36: Latin America Smart SOS Button Market Forecast (USD Billion), by Sub-Segment 2, 2018-2029
      Figure 37: Latin America Smart SOS Button Market Forecast (USD Billion), by Sub-Segment 3, 2018-2029
      Figure 38: Latin America Smart SOS Button Market Forecast (USD Billion), by Others, 2018-2029
      Figure 39: Latin America Smart SOS Button Market Value Share (%), By Segment 3, 2023 & 2029
      Figure 40: Latin America Smart SOS Button Market Forecast (USD Billion), by Sub-Segment 1, 2018-2029
      Figure 41: Latin America Smart SOS Button Market Forecast (USD Billion), by Sub-Segment 2, 2018-2029
      Figure 42: Latin America Smart SOS Button Market Forecast (USD Billion), by Sub-Segment 3, 2018-2029
      Figure 43: Latin America Smart SOS Button Market Forecast (USD Billion), by Others, 2018-2029
      Figure 44: Latin America Smart SOS Button Market Forecast (USD Billion), by Brazil, 2018-2029
      Figure 45: Latin America Smart SOS Button Market Forecast (USD Billion), by Mexico, 2018-2029
      Figure 46: Latin America Smart SOS Button Market Forecast (USD Billion), by Rest of Latin America, 2018-2029
      Figure 47: Europe Smart SOS Button Market Value Share (%), By Segment 1, 2023 & 2029
      Figure 48: Europe Smart SOS Button Market Forecast (USD Billion), by Sub-Segment 1, 2018-2029
      Figure 49: Europe Smart SOS Button Market Forecast (USD Billion), by Sub-Segment 2, 2018-2029
      Figure 50: Europe Smart SOS Button Market Value Share (%), By Segment 2, 2023 & 2029
      Figure 51: Europe Smart SOS Button Market Forecast (USD Billion), by Sub-Segment 1, 2018-2029
      Figure 52: Europe Smart SOS Button Market Forecast (USD Billion), by Sub-Segment 2, 2018-2029
      Figure 53: Europe Smart SOS Button Market Forecast (USD Billion), by Sub-Segment 3, 2018-2029
      Figure 54: Europe Smart SOS Button Market Forecast (USD Billion), by Others, 2018-2029
      Figure 55: Europe Smart SOS Button Market Value Share (%), By Segment 3, 2023 & 2029
      Figure 56: Europe Smart SOS Button Market Forecast (USD Billion), by Sub-Segment 1, 2018-2029
      Figure 57: Europe Smart SOS Button Market Forecast (USD Billion), by Sub-Segment 2, 2018-2029
      Figure 58: Europe Smart SOS Button Market Forecast (USD Billion), by Sub-Segment 3, 2018-2029
      Figure 59: Europe Smart SOS Button Market Forecast (USD Billion), by Others, 2018-2029
      Figure 60: Europe Smart SOS Button Market Forecast (USD Billion), by U.K., 2018-2029
      Figure 61: Europe Smart SOS Button Market Forecast (USD Billion), by Germany, 2018-2029
      Figure 62: Europe Smart SOS Button Market Forecast (USD Billion), by France, 2018-2029
      Figure 63: Europe Smart SOS Button Market Forecast (USD Billion), by Italy, 2018-2029
      Figure 64: Europe Smart SOS Button Market Forecast (USD Billion), by Spain, 2018-2029
      Figure 65: Europe Smart SOS Button Market Forecast (USD Billion), by Russia, 2018-2029
      Figure 66: Europe Smart SOS Button Market Forecast (USD Billion), by Rest of Europe, 2018-2029
      Figure 67: Asia Pacific Smart SOS Button Market Value Share (%), By Segment 1, 2023 & 2029
      Figure 68: Asia Pacific Smart SOS Button Market Forecast (USD Billion), by Sub-Segment 1, 2018-2029
      Figure 69: Asia Pacific Smart SOS Button Market Forecast (USD Billion), by Sub-Segment 2, 2018-2029
      Figure 70: Asia Pacific Smart SOS Button Market Value Share (%), By Segment 2, 2023 & 2029
      Figure 71: Asia Pacific Smart SOS Button Market Forecast (USD Billion), by Sub-Segment 1, 2018-2029
      Figure 72: Asia Pacific Smart SOS Button Market Forecast (USD Billion), by Sub-Segment 2, 2018-2029
      Figure 73: Asia Pacific Smart SOS Button Market Forecast (USD Billion), by Sub-Segment 3, 2018-2029
      Figure 74: Asia Pacific Smart SOS Button Market Forecast (USD Billion), by Others, 2018-2029
      Figure 75: Asia Pacific Smart SOS Button Market Value Share (%), By Segment 3, 2023 & 2029
      Figure 76: Asia Pacific Smart SOS Button Market Forecast (USD Billion), by Sub-Segment 1, 2018-2029
      Figure 77: Asia Pacific Smart SOS Button Market Forecast (USD Billion), by Sub-Segment 2, 2018-2029
      Figure 78: Asia Pacific Smart SOS Button Market Forecast (USD Billion), by Sub-Segment 3, 2018-2029
      Figure 79: Asia Pacific Smart SOS Button Market Forecast (USD Billion), by Others, 2018-2029
      Figure 80: Asia Pacific Smart SOS Button Market Forecast (USD Billion), by China, 2018-2029
      Figure 81: Asia Pacific Smart SOS Button Market Forecast (USD Billion), by India, 2018-2029
      Figure 82: Asia Pacific Smart SOS Button Market Forecast (USD Billion), by Japan, 2018-2029
      Figure 83: Asia Pacific Smart SOS Button Market Forecast (USD Billion), by Australia, 2018-2029
      Figure 84: Asia Pacific Smart SOS Button Market Forecast (USD Billion), by Southeast Asia, 2018-2029
      Figure 85: Asia Pacific Smart SOS Button Market Forecast (USD Billion), by Rest of Asia Pacific, 2018-2029
      Figure 86: Middle East & Africa Smart SOS Button Market Value Share (%), By Segment 1, 2023 & 2029
      Figure 87: Middle East & Africa Smart SOS Button Market Forecast (USD Billion), by Sub-Segment 1, 2018-2029
      Figure 88: Middle East & Africa Smart SOS Button Market Forecast (USD Billion), by Sub-Segment 2, 2018-2029
      Figure 89: Middle East & Africa Smart SOS Button Market Value Share (%), By Segment 2, 2023 & 2029
      Figure 90: Middle East & Africa Smart SOS Button Market Forecast (USD Billion), by Sub-Segment 1, 2018-2029
      Figure 91: Middle East & Africa Smart SOS Button Market Forecast (USD Billion), by Sub-Segment 2, 2018-2029
      Figure 92: Middle East & Africa Smart SOS Button Market Forecast (USD Billion), by Sub-Segment 3, 2018-2029
      Figure 93: Middle East & Africa Smart SOS Button Market Forecast (USD Billion), by Others, 2018-2029
      Figure 94: Middle East & Africa Smart SOS Button Market Value Share (%), By Segment 3, 2023 & 2029
      Figure 95: Middle East & Africa Smart SOS Button Market Forecast (USD Billion), by Sub-Segment 1, 2018-2029
      Figure 96: Middle East & Africa Smart SOS Button Market Forecast (USD Billion), by Sub-Segment 2, 2018-2029
      Figure 97: Middle East & Africa Smart SOS Button Market Forecast (USD Billion), by Sub-Segment 3, 2018-2029
      Figure 98: Middle East & Africa Smart SOS Button Market Forecast (USD Billion), by Others, 2018-2029
      Figure 99: Middle East & Africa Smart SOS Button Market Forecast (USD Billion), by GCC, 2018-2029
      Figure 100: Middle East & Africa Smart SOS Button Market Forecast (USD Billion), by South Africa, 2018-2029
      Figure 101: Middle East & Africa Smart SOS Button Market Forecast (USD Billion), by Rest of Middle East & Africa, 2018-2029 
      List of Tables
      Table 1: Global Smart SOS Button Market Revenue (USD Billion) Forecast, by Segment 1, 2018-2029
      Table 2: Global Smart SOS Button Market Revenue (USD Billion) Forecast, by Segment 2, 2018-2029
      Table 3: Global Smart SOS Button Market Revenue (USD Billion) Forecast, by Segment 3, 2018-2029
      Table 4: Global Smart SOS Button Market Revenue (USD Billion) Forecast, by Region, 2018-2029
      Table 5: North America Smart SOS Button Market Revenue (USD Billion) Forecast, by Segment 1, 2018-2029
      Table 6: North America Smart SOS Button Market Revenue (USD Billion) Forecast, by Segment 2, 2018-2029
      Table 7: North America Smart SOS Button Market Revenue (USD Billion) Forecast, by Segment 3, 2018-2029
      Table 8: North America Smart SOS Button Market Revenue (USD Billion) Forecast, by Country, 2018-2029
      Table 9: Europe Smart SOS Button Market Revenue (USD Billion) Forecast, by Segment 1, 2018-2029
      Table 10: Europe Smart SOS Button Market Revenue (USD Billion) Forecast, by Segment 2, 2018-2029
      Table 11: Europe Smart SOS Button Market Revenue (USD Billion) Forecast, by Segment 3, 2018-2029
      Table 12: Europe Smart SOS Button Market Revenue (USD Billion) Forecast, by Country, 2018-2029
      Table 13: Latin America Smart SOS Button Market Revenue (USD Billion) Forecast, by Segment 1, 2018-2029
      Table 14: Latin America Smart SOS Button Market Revenue (USD Billion) Forecast, by Segment 2, 2018-2029
      Table 15: Latin America Smart SOS Button Market Revenue (USD Billion) Forecast, by Segment 3, 2018-2029
      Table 16: Latin America Smart SOS Button Market Revenue (USD Billion) Forecast, by Country, 2018-2029
      Table 17: Asia Pacific Smart SOS Button Market Revenue (USD Billion) Forecast, by Segment 1, 2018-2029
      Table 18: Asia Pacific Smart SOS Button Market Revenue (USD Billion) Forecast, by Segment 2, 2018-2029
      Table 19: Asia Pacific Smart SOS Button Market Revenue (USD Billion) Forecast, by Segment 3, 2018-2029
      Table 20: Asia Pacific Smart SOS Button Market Revenue (USD Billion) Forecast, by Country, 2018-2029
      Table 21: Middle East & Africa Smart SOS Button Market Revenue (USD Billion) Forecast, by Segment 1, 2018-2029
      Table 22: Middle East & Africa Smart SOS Button Market Revenue (USD Billion) Forecast, by Segment 2, 2018-2029
      Table 23: Middle East & Africa Smart SOS Button Market Revenue (USD Billion) Forecast, by Segment 3, 2018-2029
      Table 24: Middle East & Africa Smart SOS Button Market Revenue (USD Billion) Forecast, by Country, 2018-2029
      Research Process

      Data Library Research are conducted by industry experts who offer insight on industry structure, market segmentations technology assessment and competitive landscape (CL), and penetration, as well as on emerging trends. Their analysis is based on primary interviews (~ 80%) and secondary research (~ 20%) as well as years of professional expertise in their respective industries. Adding to this, by analysing historical trends and current market positions, our analysts predict where the market will be headed for the next five years. Furthermore, the varying trends of segment & categories geographically presented are also studied and the estimated based on the primary & secondary research.

      In this particular report from the supply side Data Library Research has conducted primary surveys (interviews) with the key level executives (VP, CEO’s, Marketing Director, Business Development Manager and SOFT) of the companies that active & prominent as well as the midsized organization

      FIGURE 1: DLR RESEARH PROCESS

      research-methodology1

      Primary Research

      Extensive primary research was conducted to gain a deeper insight of the market and industry performance. The analysis is based on both primary and secondary research as well as years of professional expertise in the respective industries.

      In addition to analysing current and historical trends, our analysts predict where the market is headed over the next five years.

      It varies by segment for these categories geographically presented in the list of market tables. Speaking about this particular report we have conducted primary surveys (interviews) with the key level executives (VP, CEO’s, Marketing Director, Business Development Manager and many more) of the major players active in the market.

      Secondary Research

      Secondary research was mainly used to collect and identify information useful for the extensive, technical, market-oriented, and Friend’s study of the Global Extra Neutral Alcohol. It was also used to obtain key information about major players, market classification and segmentation according to the industry trends, geographical markets, and developments related to the market and technology perspectives. For this study, analysts have gathered information from various credible sources, such as annual reports, sec filings, journals, white papers, SOFT presentations, and company web sites.

      Market Size Estimation

      Both, top-down and bottom-up approaches were used to estimate and validate the size of the Global market and to estimate the size of various other dependent submarkets in the overall Extra Neutral Alcohol. The key players in the market were identified through secondary research and their market contributions in the respective geographies were determined through primary and secondary research.

      Forecast Model

      research-methodology2

      Happy to Assist You

      If you have a question?

      info@datalibraryresearch.com

      IND : +91 955 279 0357

      Browse Related Reports