Solar PV Balance of Systems (BOS) Market Overview and Analysis
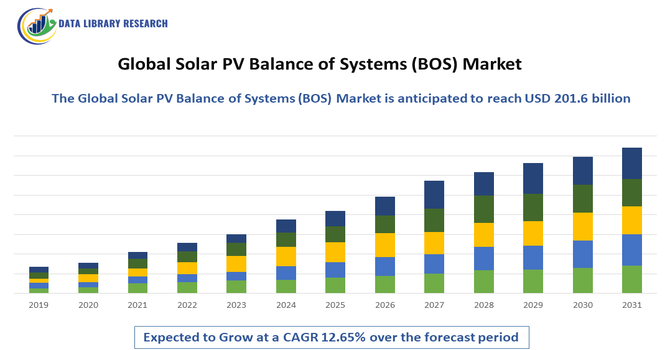
- The Global Solar PV Balance of Systems (BOS) Market was valued at USD 83.6 billion in 2025 and is projected to grow to USD 201.6 billion by 2032, growing with a CAGR of 12.65% from 2025 to 2032.
Get Complete Analysis Of The Report - Download Updated Free Sample PDF
The Global Solar PV Balance of Systems (BOS) Market encompasses all components and equipment required to support a photovoltaic (PV) system apart from the solar panels themselves. This includes inverters, mounting structures, wiring, trackers, and monitoring systems, enabling efficient energy conversion, distribution, and integration, while driving the overall solar power deployment globally.
Solar PV Balance of Systems (BOS) Market Latest Trends
The Global Solar PV Balance of Systems (BOS) Market is experiencing significant growth due to the increasing deployment of solar PV projects worldwide. Trends include rising adoption of advanced inverters, mounting structures, trackers, and monitoring systems that enhance efficiency and reliability. Integration with smart grid and energy storage solutions is accelerating. Declining costs of BOS components, coupled with supportive government policies and renewable energy targets, are driving demand. Innovations in lightweight materials, automated installation technologies, and predictive maintenance are further improving performance.
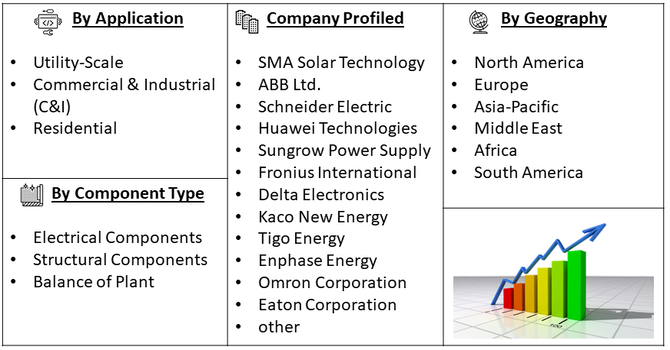
Segmentation: The Global Solar PV Balance of Systems (BOS) Market is segmented by Component Type (Electrical Components, Structural Components and Balance of Plant), Installation Type (Ground-Mounted, Rooftop and Floating PV (FPV)), End-User Application (Utility-Scale, Commercial & Industrial (C&I) and Residential), and Geography (North America, Europe, Asia-Pacific, Middle East and Africa, and South America). The report provides the value (in USD million) for the above segments.
For Detailed Market Segmentation - Get a Free Sample PDF
Market Driver:
- Corporate Sustainability Mandates and ESG Compliance
The primary catalyst for growth in the Commercial and Industrial (C&I) sector is the global shift toward Environmental, Social, and Governance (ESG) accountability. Multi-national corporations and large-scale industrial players are no longer viewing renewable energy as an optional "green" initiative but as a core business necessity to satisfy stakeholders and regulatory bodies. As carbon taxes become more prevalent and supply chain emission reporting (Scope 3) becomes mandatory in many jurisdictions, businesses are aggressively investing in on-site solar and high-efficiency balance of system (BOS) components. This systemic transition ensures a steady pipeline of large-scale projects aimed at decarbonizing industrial operations.
- Energy Security and Mitigation of Utility Price Volatility
Unpredictable energy markets and the rising cost of grid-supplied electricity have made energy independence a strategic priority for industrial consumers. By adopting decentralized energy solutions, C&I entities can "lock in" long-term energy costs, protecting their margins from the volatility of global fossil fuel prices and grid surcharges. The integration of advanced energy storage systems with solar PV allows these facilities to manage peak demand charges—often the most expensive component of an industrial utility bill. This financial predictability, combined with the declining Levelized Cost of Energy (LCOE) for renewables, provides a compelling economic justification for rapid C&I segment expansion.
Market Restraint:
- High Initial Capital Expenditure and Complex Grid Integration
Despite the long-term savings, the C&I market faces a significant hurdle in the form of high upfront capital requirements and technical integration challenges. Large-scale industrial retrofitting requires substantial initial investment in specialized hardware, structural reinforcements, and sophisticated power electronics, which can be a barrier for mid-sized enterprises with limited liquidity. Furthermore, connecting large-scale C&I installations to existing aging grid infrastructures often involves complex permitting processes and "interconnection queues." Technical requirements for grid stability—such as voltage regulation and harmonic control—add layers of engineering complexity and administrative delays that can stall project timelines and dampen immediate market momentum.
Socioeconomic Impact on Solar PV Balance of Systems (BOS) Market
Expansion of the Solar PV BOS market fosters job creation in manufacturing, installation, and maintenance, supporting local economies. It reduces reliance on fossil fuels, lowering greenhouse gas emissions and promoting environmental sustainability. Affordable renewable electricity improves energy access in underserved regions, contributing to social development. The market also encourages investment in R&D, infrastructure, and technological innovation. By enabling efficient and cost-effective solar power deployment, BOS solutions support energy security and economic resilience. Communities benefit from cleaner air, lower energy costs, and enhanced infrastructure. Overall, BOS market growth aligns with global climate goals, sustainable development, and equitable access to renewable energy.
Segmental Analysis:
- Electrical Components segment is expected to witness highest growth over the forecast period
The electrical components segment, including inverters, wiring, switchgear, and power distribution units, is expected to witness the highest growth over the forecast period. Rising adoption of smart inverters, energy storage integration, and advanced monitoring systems is fueling demand. These components are essential for efficient energy conversion, grid integration, and reliable operation of solar PV systems across residential, commercial, and utility-scale installations. Technological advancements, declining costs, and government incentives are accelerating deployment. As renewable energy targets intensify globally, the demand for high-quality, reliable electrical BOS components continues to grow, driving substantial market expansion.
- Ground-Mounted, Rooftop segment is expected to witness the highest growth over the forecast period
Ground-mounted and rooftop solar PV installations are projected to witness the highest growth over the forecast period due to versatility and scalability. Ground-mounted systems are ideal for utility-scale projects, offering easy maintenance and higher energy yield, while rooftop installations optimize existing building space, especially in urban areas. Falling installation costs, supportive policies, and incentives encourage adoption across residential, commercial, and industrial facilities. Hybrid solutions combining rooftop and ground-mounted systems are increasing. Growing demand for decentralized energy generation, coupled with the need to reduce carbon emissions, drives the expansion of both installation types worldwide.
- Commercial & Industrial (C&I) segment is expected to witness the highest growth over the forecast period
The Commercial & Industrial (C&I) segment is expected to experience the highest growth as businesses seek to reduce electricity costs and meet sustainability goals. C&I facilities increasingly invest in solar PV systems integrated with BOS components such as inverters, monitoring solutions, and mounting structures. Corporate renewable energy commitments, government incentives, and tax benefits accelerate adoption. Solar solutions provide predictable energy costs, resilience, and environmental compliance, while enhancing brand reputation. Growth in sectors like manufacturing, IT, retail, and logistics drives demand. Scalable, modular PV systems with advanced BOS support C&I energy management and contribute to market expansion.
- Asia-Pacific region is expected to witness highest growth over the forecast period
The Asia-Pacific region is anticipated to witness the highest growth over the forecast period due to rapid solar PV deployment, supportive government policies, and expanding industrial and commercial sectors. Countries such as China, India, Japan, and Australia are investing heavily in renewable energy infrastructure to meet energy demand and sustainability targets. For instance, in May 2025, GE Vernova’s launch of the FLEXINVERTER 1.5kV SiC solution for utility-scale BESS and the expansion of its 2kV FLEXINVERTER to IEC markets enhances energy efficiency and cost-effectiveness for PV plants. In the Asia-Pacific region, these advancements drive demand for high-performance BOS components such as inverters and power management systems, supporting large-scale solar adoption, improving grid integration, and accelerating the deployment of sustainable, utility-scale solar PV infrastructure across diverse markets.
Similarly, in June 2025, LONGi’s agreement with Grupotec for supplying 187 MW of high-efficiency Hi-MO 9 PV modules in the UK highlights the growing demand for advanced solar technology. In the Asia-Pacific Solar PV BOS market, this trend drives adoption of high-performance BOS components—including inverters, mounting systems, and power distribution units—by emphasizing efficiency, reliability, and scalability. Such collaborations accelerate regional utility-scale solar deployments, foster innovation, and strengthen the overall growth of integrated PV balance of systems solutions.
Falling costs of BOS components, availability of skilled labor, and large-scale utility and rooftop projects fuel regional growth. The rise of C&I and utility-scale solar projects, coupled with technological advancements and foreign investments, positions Asia-Pacific as a leading driver of global solar PV BOS market expansion.
| Report Matrics |
Details |
| Market Size Value |
USD 201.6 billion |
| Growth Rate |
CAGR of 12.65% |
| Forecast |
2026-2033 |
| Historical data |
2021-2024 |
| Base Year |
2025 |
| Report Coverage |
Forecasted revenue, company rating, competitive environment, growth drivers, and trends |
| Segment Coverage |
Type, Application, End-User, Geography |
| Regional Scope |
North America, Europe, Asia Pacific, Middle East |
| Customized scope |
Free customization of reports (With 3 months Analysis Support ) |
| To Learn More About This Report |
Request a Free Sample Copy |
Solar PV Balance of Systems (BOS) Market Competitive Landscape
The Solar PV BOS market is moderately consolidated, with competition among key global players focusing on technological innovation, cost-efficiency, and integrated solutions. Leading companies include SMA Solar Technology, ABB, Schneider Electric, Huawei, Sungrow Power Supply, Kaco New Energy, Tigo Energy, Fronius International, and Delta Electronics. Companies differentiate through high-efficiency inverters, intelligent monitoring systems, trackers, and modular mounting solutions. Strategic partnerships with EPC contractors and utilities, regional expansion, and mergers and acquisitions shape competitiveness. Emerging players in Asia-Pacific and Europe are also gaining traction by offering affordable and innovative BOS solutions, driving market penetration and global adoption.
The major players for above market are:
- SMA Solar Technology
- ABB Ltd.
- Schneider Electric
- Huawei Technologies
- Sungrow Power Supply
- Fronius International
- Delta Electronics
- Kaco New Energy
- Tigo Energy
- Enphase Energy
- Omron Corporation
- Eaton Corporation
- SolarEdge Technologies
- STMicroelectronics
- Flex Ltd.
- Siemens AG
- Mitsubishi Electric
- Trina Solar (BOS components division)
- Canadian Solar (BOS solutions division)
- Risen Energy
Recent Development
- In 2025, Growatt, has been recognized as a Tier 1 PV inverter supplier by S&P Global Commodity Insights, reinforcing its global leadership. This milestone boosts confidence in high-quality BOS components, driving broader adoption of solar PV systems for homes, businesses, and communities. It accelerates market growth, encourages technological innovation, and supports the expansion of efficient, scalable, and sustainable solar energy infrastructure worldwide.
- In October 2025, The West Carclaze Garden Village project, featuring Samsung SmartThings integration and a 7.5 MW on-site solar farm, highlights the growing adoption of smart, energy-efficient homes. By combining advanced home automation with solar PV systems, it drives demand for BOS components such as inverters, monitoring systems, and power distribution units. This model promotes scalable, sustainable residential solar deployment globally, accelerating market growth and encouraging innovation in integrated, high-efficiency solar PV balance of systems solutions.
Frequently Asked Questions (FAQ) :
Q1. What are the main growth-driving factors for this market?
The primary driver is the global surge in solar installations as countries transition to renewable energy. As solar panel prices drop, the focus shifts to BOS components—like inverters, racking, and wiring—to optimize system performance. Government incentives and large-scale utility projects are also significantly increasing demand for these essential support systems.
Q2. What are the main restraining factors for this market?
Growth is often hindered by supply chain disruptions and the rising cost of raw materials like copper, aluminum, and steel used in racking and cables. Additionally, complex regulatory hurdles and the lack of standardized installation protocols in some regions can lead to project delays and increased labor costs for BOS setup.
Q3. Which segment is expected to witness high growth?
The Commercial & Industrial (C&I) segment is poised for the highest growth through the forecast period, fueled by rising corporate sustainability targets and the push for energy independence. Businesses are increasingly adopting on-site solar to hedge against volatile grid prices, leveraging modular BOS solutions to minimize installation time and maximize ROI.
Q4. Who are the top major players for this market?
The market is led by diversified technology and energy firms. Key players include Huawei Technologies, Sungrow Power Supply, SMA Solar Technology, and ABB. These companies dominate the landscape by providing critical electronics like inverters and trackers, as well as comprehensive structural and electrical BOS solutions.
Q5. Which country is the largest player?
China is the largest player in the Global Solar PV BOS market. Its dominance is driven by massive domestic solar deployment and its role as the world's leading manufacturer of BOS components. China’s ability to produce racking, inverters, and cables at a massive scale makes it the global hub for this industry
List of Figures
Figure 1: Global Solar PV Balance of Systems (BOS) Market Revenue Breakdown (USD Billion, %) by Region, 2022 & 2029
Figure 2: Global Solar PV Balance of Systems (BOS) Market Value Share (%), By Segment 1, 2022 & 2029
Figure 3: Global Solar PV Balance of Systems (BOS) Market Forecast (USD Billion), by Sub-Segment 1, 2018-2029
Figure 4: Global Solar PV Balance of Systems (BOS) Market Forecast (USD Billion), by Sub-Segment 2, 2018-2029
Figure 5: Global Solar PV Balance of Systems (BOS) Market Value Share (%), By Segment 2, 2022 & 2029
Figure 6: Global Solar PV Balance of Systems (BOS) Market Forecast (USD Billion), by Sub-Segment 1, 2018-2029
Figure 7: Global Solar PV Balance of Systems (BOS) Market Forecast (USD Billion), by Sub-Segment 2, 2018-2029
Figure 8: Global Solar PV Balance of Systems (BOS) Market Forecast (USD Billion), by Sub-Segment 3, 2018-2029
Figure 9: Global Solar PV Balance of Systems (BOS) Market Forecast (USD Billion), by Others, 2018-2029
Figure 10: Global Solar PV Balance of Systems (BOS) Market Value Share (%), By Segment 3, 2022 & 2029
Figure 11: Global Solar PV Balance of Systems (BOS) Market Forecast (USD Billion), by Sub-Segment 1, 2018-2029
Figure 12: Global Solar PV Balance of Systems (BOS) Market Forecast (USD Billion), by Sub-Segment 2, 2018-2029
Figure 13: Global Solar PV Balance of Systems (BOS) Market Forecast (USD Billion), by Sub-Segment 3, 2018-2029
Figure 14: Global Solar PV Balance of Systems (BOS) Market Forecast (USD Billion), by Others, 2018-2029
Figure 15: Global Solar PV Balance of Systems (BOS) Market Value (USD Billion), by Region, 2022 & 2029
Figure 16: North America Solar PV Balance of Systems (BOS) Market Value Share (%), By Segment 1, 2022 & 2029
Figure 17: North America Solar PV Balance of Systems (BOS) Market Forecast (USD Billion), by Sub-Segment 1, 2018-2029
Figure 18: North America Solar PV Balance of Systems (BOS) Market Forecast (USD Billion), by Sub-Segment 2, 2018-2029
Figure 19: North America Solar PV Balance of Systems (BOS) Market Value Share (%), By Segment 2, 2022 & 2029
Figure 20: North America Solar PV Balance of Systems (BOS) Market Forecast (USD Billion), by Sub-Segment 1, 2018-2029
Figure 21: North America Solar PV Balance of Systems (BOS) Market Forecast (USD Billion), by Sub-Segment 2, 2018-2029
Figure 22: North America Solar PV Balance of Systems (BOS) Market Forecast (USD Billion), by Sub-Segment 3, 2018-2029
Figure 23: North America Solar PV Balance of Systems (BOS) Market Forecast (USD Billion), by Others, 2018-2029
Figure 24: North America Solar PV Balance of Systems (BOS) Market Value Share (%), By Segment 3, 2022 & 2029
Figure 25: North America Solar PV Balance of Systems (BOS) Market Forecast (USD Billion), by Sub-Segment 1, 2018-2029
Figure 26: North America Solar PV Balance of Systems (BOS) Market Forecast (USD Billion), by Sub-Segment 2, 2018-2029
Figure 27: North America Solar PV Balance of Systems (BOS) Market Forecast (USD Billion), by Sub-Segment 3, 2018-2029
Figure 28: North America Solar PV Balance of Systems (BOS) Market Forecast (USD Billion), by Others, 2018-2029
Figure 29: North America Solar PV Balance of Systems (BOS) Market Forecast (USD Billion), by U.S., 2018-2029
Figure 30: North America Solar PV Balance of Systems (BOS) Market Forecast (USD Billion), by Canada, 2018-2029
Figure 31: Latin America Solar PV Balance of Systems (BOS) Market Value Share (%), By Segment 1, 2022 & 2029
Figure 32: Latin America Solar PV Balance of Systems (BOS) Market Forecast (USD Billion), by Sub-Segment 1, 2018-2029
Figure 33: Latin America Solar PV Balance of Systems (BOS) Market Forecast (USD Billion), by Sub-Segment 2, 2018-2029
Figure 34: Latin America Solar PV Balance of Systems (BOS) Market Value Share (%), By Segment 2, 2022 & 2029
Figure 35: Latin America Solar PV Balance of Systems (BOS) Market Forecast (USD Billion), by Sub-Segment 1, 2018-2029
Figure 36: Latin America Solar PV Balance of Systems (BOS) Market Forecast (USD Billion), by Sub-Segment 2, 2018-2029
Figure 37: Latin America Solar PV Balance of Systems (BOS) Market Forecast (USD Billion), by Sub-Segment 3, 2018-2029
Figure 38: Latin America Solar PV Balance of Systems (BOS) Market Forecast (USD Billion), by Others, 2018-2029
Figure 39: Latin America Solar PV Balance of Systems (BOS) Market Value Share (%), By Segment 3, 2022 & 2029
Figure 40: Latin America Solar PV Balance of Systems (BOS) Market Forecast (USD Billion), by Sub-Segment 1, 2018-2029
Figure 41: Latin America Solar PV Balance of Systems (BOS) Market Forecast (USD Billion), by Sub-Segment 2, 2018-2029
Figure 42: Latin America Solar PV Balance of Systems (BOS) Market Forecast (USD Billion), by Sub-Segment 3, 2018-2029
Figure 43: Latin America Solar PV Balance of Systems (BOS) Market Forecast (USD Billion), by Others, 2018-2029
Figure 44: Latin America Solar PV Balance of Systems (BOS) Market Forecast (USD Billion), by Brazil, 2018-2029
Figure 45: Latin America Solar PV Balance of Systems (BOS) Market Forecast (USD Billion), by Mexico, 2018-2029
Figure 46: Latin America Solar PV Balance of Systems (BOS) Market Forecast (USD Billion), by Rest of Latin America, 2018-2029
Figure 47: Europe Solar PV Balance of Systems (BOS) Market Value Share (%), By Segment 1, 2022 & 2029
Figure 48: Europe Solar PV Balance of Systems (BOS) Market Forecast (USD Billion), by Sub-Segment 1, 2018-2029
Figure 49: Europe Solar PV Balance of Systems (BOS) Market Forecast (USD Billion), by Sub-Segment 2, 2018-2029
Figure 50: Europe Solar PV Balance of Systems (BOS) Market Value Share (%), By Segment 2, 2022 & 2029
Figure 51: Europe Solar PV Balance of Systems (BOS) Market Forecast (USD Billion), by Sub-Segment 1, 2018-2029
Figure 52: Europe Solar PV Balance of Systems (BOS) Market Forecast (USD Billion), by Sub-Segment 2, 2018-2029
Figure 53: Europe Solar PV Balance of Systems (BOS) Market Forecast (USD Billion), by Sub-Segment 3, 2018-2029
Figure 54: Europe Solar PV Balance of Systems (BOS) Market Forecast (USD Billion), by Others, 2018-2029
Figure 55: Europe Solar PV Balance of Systems (BOS) Market Value Share (%), By Segment 3, 2022 & 2029
Figure 56: Europe Solar PV Balance of Systems (BOS) Market Forecast (USD Billion), by Sub-Segment 1, 2018-2029
Figure 57: Europe Solar PV Balance of Systems (BOS) Market Forecast (USD Billion), by Sub-Segment 2, 2018-2029
Figure 58: Europe Solar PV Balance of Systems (BOS) Market Forecast (USD Billion), by Sub-Segment 3, 2018-2029
Figure 59: Europe Solar PV Balance of Systems (BOS) Market Forecast (USD Billion), by Others, 2018-2029
Figure 60: Europe Solar PV Balance of Systems (BOS) Market Forecast (USD Billion), by U.K., 2018-2029
Figure 61: Europe Solar PV Balance of Systems (BOS) Market Forecast (USD Billion), by Germany, 2018-2029
Figure 62: Europe Solar PV Balance of Systems (BOS) Market Forecast (USD Billion), by France, 2018-2029
Figure 63: Europe Solar PV Balance of Systems (BOS) Market Forecast (USD Billion), by Italy, 2018-2029
Figure 64: Europe Solar PV Balance of Systems (BOS) Market Forecast (USD Billion), by Spain, 2018-2029
Figure 65: Europe Solar PV Balance of Systems (BOS) Market Forecast (USD Billion), by Russia, 2018-2029
Figure 66: Europe Solar PV Balance of Systems (BOS) Market Forecast (USD Billion), by Rest of Europe, 2018-2029
Figure 67: Asia Pacific Solar PV Balance of Systems (BOS) Market Value Share (%), By Segment 1, 2022 & 2029
Figure 68: Asia Pacific Solar PV Balance of Systems (BOS) Market Forecast (USD Billion), by Sub-Segment 1, 2018-2029
Figure 69: Asia Pacific Solar PV Balance of Systems (BOS) Market Forecast (USD Billion), by Sub-Segment 2, 2018-2029
Figure 70: Asia Pacific Solar PV Balance of Systems (BOS) Market Value Share (%), By Segment 2, 2022 & 2029
Figure 71: Asia Pacific Solar PV Balance of Systems (BOS) Market Forecast (USD Billion), by Sub-Segment 1, 2018-2029
Figure 72: Asia Pacific Solar PV Balance of Systems (BOS) Market Forecast (USD Billion), by Sub-Segment 2, 2018-2029
Figure 73: Asia Pacific Solar PV Balance of Systems (BOS) Market Forecast (USD Billion), by Sub-Segment 3, 2018-2029
Figure 74: Asia Pacific Solar PV Balance of Systems (BOS) Market Forecast (USD Billion), by Others, 2018-2029
Figure 75: Asia Pacific Solar PV Balance of Systems (BOS) Market Value Share (%), By Segment 3, 2022 & 2029
Figure 76: Asia Pacific Solar PV Balance of Systems (BOS) Market Forecast (USD Billion), by Sub-Segment 1, 2018-2029
Figure 77: Asia Pacific Solar PV Balance of Systems (BOS) Market Forecast (USD Billion), by Sub-Segment 2, 2018-2029
Figure 78: Asia Pacific Solar PV Balance of Systems (BOS) Market Forecast (USD Billion), by Sub-Segment 3, 2018-2029
Figure 79: Asia Pacific Solar PV Balance of Systems (BOS) Market Forecast (USD Billion), by Others, 2018-2029
Figure 80: Asia Pacific Solar PV Balance of Systems (BOS) Market Forecast (USD Billion), by China, 2018-2029
Figure 81: Asia Pacific Solar PV Balance of Systems (BOS) Market Forecast (USD Billion), by India, 2018-2029
Figure 82: Asia Pacific Solar PV Balance of Systems (BOS) Market Forecast (USD Billion), by Japan, 2018-2029
Figure 83: Asia Pacific Solar PV Balance of Systems (BOS) Market Forecast (USD Billion), by Australia, 2018-2029
Figure 84: Asia Pacific Solar PV Balance of Systems (BOS) Market Forecast (USD Billion), by Southeast Asia, 2018-2029
Figure 85: Asia Pacific Solar PV Balance of Systems (BOS) Market Forecast (USD Billion), by Rest of Asia Pacific, 2018-2029
Figure 86: Middle East & Africa Solar PV Balance of Systems (BOS) Market Value Share (%), By Segment 1, 2022 & 2029
Figure 87: Middle East & Africa Solar PV Balance of Systems (BOS) Market Forecast (USD Billion), by Sub-Segment 1, 2018-2029
Figure 88: Middle East & Africa Solar PV Balance of Systems (BOS) Market Forecast (USD Billion), by Sub-Segment 2, 2018-2029
Figure 89: Middle East & Africa Solar PV Balance of Systems (BOS) Market Value Share (%), By Segment 2, 2022 & 2029
Figure 90: Middle East & Africa Solar PV Balance of Systems (BOS) Market Forecast (USD Billion), by Sub-Segment 1, 2018-2029
Figure 91: Middle East & Africa Solar PV Balance of Systems (BOS) Market Forecast (USD Billion), by Sub-Segment 2, 2018-2029
Figure 92: Middle East & Africa Solar PV Balance of Systems (BOS) Market Forecast (USD Billion), by Sub-Segment 3, 2018-2029
Figure 93: Middle East & Africa Solar PV Balance of Systems (BOS) Market Forecast (USD Billion), by Others, 2018-2029
Figure 94: Middle East & Africa Solar PV Balance of Systems (BOS) Market Value Share (%), By Segment 3, 2022 & 2029
Figure 95: Middle East & Africa Solar PV Balance of Systems (BOS) Market Forecast (USD Billion), by Sub-Segment 1, 2018-2029
Figure 96: Middle East & Africa Solar PV Balance of Systems (BOS) Market Forecast (USD Billion), by Sub-Segment 2, 2018-2029
Figure 97: Middle East & Africa Solar PV Balance of Systems (BOS) Market Forecast (USD Billion), by Sub-Segment 3, 2018-2029
Figure 98: Middle East & Africa Solar PV Balance of Systems (BOS) Market Forecast (USD Billion), by Others, 2018-2029
Figure 99: Middle East & Africa Solar PV Balance of Systems (BOS) Market Forecast (USD Billion), by GCC, 2018-2029
Figure 100: Middle East & Africa Solar PV Balance of Systems (BOS) Market Forecast (USD Billion), by South Africa, 2018-2029
Figure 101: Middle East & Africa Solar PV Balance of Systems (BOS) Market Forecast (USD Billion), by Rest of Middle East & Africa, 2018-2029
List of Tables
Table 1: Global Solar PV Balance of Systems (BOS) Market Revenue (USD Billion) Forecast, by Segment 1, 2018-2029
Table 2: Global Solar PV Balance of Systems (BOS) Market Revenue (USD Billion) Forecast, by Segment 2, 2018-2029
Table 3: Global Solar PV Balance of Systems (BOS) Market Revenue (USD Billion) Forecast, by Segment 3, 2018-2029
Table 4: Global Solar PV Balance of Systems (BOS) Market Revenue (USD Billion) Forecast, by Region, 2018-2029
Table 5: North America Solar PV Balance of Systems (BOS) Market Revenue (USD Billion) Forecast, by Segment 1, 2018-2029
Table 6: North America Solar PV Balance of Systems (BOS) Market Revenue (USD Billion) Forecast, by Segment 2, 2018-2029
Table 7: North America Solar PV Balance of Systems (BOS) Market Revenue (USD Billion) Forecast, by Segment 3, 2018-2029
Table 8: North America Solar PV Balance of Systems (BOS) Market Revenue (USD Billion) Forecast, by Country, 2018-2029
Table 9: Europe Solar PV Balance of Systems (BOS) Market Revenue (USD Billion) Forecast, by Segment 1, 2018-2029
Table 10: Europe Solar PV Balance of Systems (BOS) Market Revenue (USD Billion) Forecast, by Segment 2, 2018-2029
Table 11: Europe Solar PV Balance of Systems (BOS) Market Revenue (USD Billion) Forecast, by Segment 3, 2018-2029
Table 12: Europe Solar PV Balance of Systems (BOS) Market Revenue (USD Billion) Forecast, by Country, 2018-2029
Table 13: Latin America Solar PV Balance of Systems (BOS) Market Revenue (USD Billion) Forecast, by Segment 1, 2018-2029
Table 14: Latin America Solar PV Balance of Systems (BOS) Market Revenue (USD Billion) Forecast, by Segment 2, 2018-2029
Table 15: Latin America Solar PV Balance of Systems (BOS) Market Revenue (USD Billion) Forecast, by Segment 3, 2018-2029
Table 16: Latin America Solar PV Balance of Systems (BOS) Market Revenue (USD Billion) Forecast, by Country, 2018-2029
Table 17: Asia Pacific Solar PV Balance of Systems (BOS) Market Revenue (USD Billion) Forecast, by Segment 1, 2018-2029
Table 18: Asia Pacific Solar PV Balance of Systems (BOS) Market Revenue (USD Billion) Forecast, by Segment 2, 2018-2029
Table 19: Asia Pacific Solar PV Balance of Systems (BOS) Market Revenue (USD Billion) Forecast, by Segment 3, 2018-2029
Table 20: Asia Pacific Solar PV Balance of Systems (BOS) Market Revenue (USD Billion) Forecast, by Country, 2018-2029
Table 21: Middle East & Africa Solar PV Balance of Systems (BOS) Market Revenue (USD Billion) Forecast, by Segment 1, 2018-2029
Table 22: Middle East & Africa Solar PV Balance of Systems (BOS) Market Revenue (USD Billion) Forecast, by Segment 2, 2018-2029
Table 23: Middle East & Africa Solar PV Balance of Systems (BOS) Market Revenue (USD Billion) Forecast, by Segment 3, 2018-2029
Table 24: Middle East & Africa Solar PV Balance of Systems (BOS) Market Revenue (USD Billion) Forecast, by Country, 2018-2029
Research Process
Data Library Research are conducted by industry experts who offer insight on
industry structure, market segmentations technology assessment and competitive landscape (CL), and penetration, as well as on emerging trends. Their analysis is based on primary interviews (~ 80%) and secondary research (~ 20%) as well as years of professional expertise in their respective industries. Adding to this, by analysing historical trends and current market positions, our analysts predict where the market will be headed for the next five years. Furthermore, the varying trends of segment & categories geographically presented are also studied and the estimated based on the primary & secondary research.
In this particular report from the supply side Data Library Research has conducted primary surveys (interviews) with the key level executives (VP, CEO’s, Marketing Director, Business Development Manager
and SOFT) of the companies that active & prominent as well as the midsized organization
FIGURE 1: DLR RESEARH PROCESS
![research-methodology1]()
Primary Research
Extensive primary research was conducted to gain a deeper insight of the market and industry performance. The analysis is based on both primary and secondary research as well as years of professional expertise in the respective industries.
In addition to analysing current and historical trends, our analysts predict where the market is headed over the next five years.
It varies by segment for these categories geographically presented in the list of market tables. Speaking about this particular report we have conducted primary surveys (interviews) with the key level executives (VP, CEO’s, Marketing Director, Business Development Manager and many more) of the major players active in the market.
Secondary Research
Secondary research was mainly used to collect and identify information useful for the extensive, technical, market-oriented, and Friend’s study of the Global Extra Neutral Alcohol. It was also used to obtain key information about major players, market classification and segmentation according to the industry trends, geographical markets, and developments related to the market and technology perspectives. For this study, analysts have gathered information from various credible sources, such as annual reports, sec filings, journals, white papers, SOFT presentations, and company web sites.
Market Size Estimation
Both, top-down and bottom-up approaches were used to estimate and validate the size of the Global market and to estimate the size of various other dependent submarkets in the overall Extra Neutral Alcohol. The key players in the market were identified through secondary research and their market contributions in the respective geographies were determined through primary and secondary research.
Forecast Model
![research-methodology2]()