On-Site Photovoltaic Solar Power for the Data Center Market Overview and Analysis
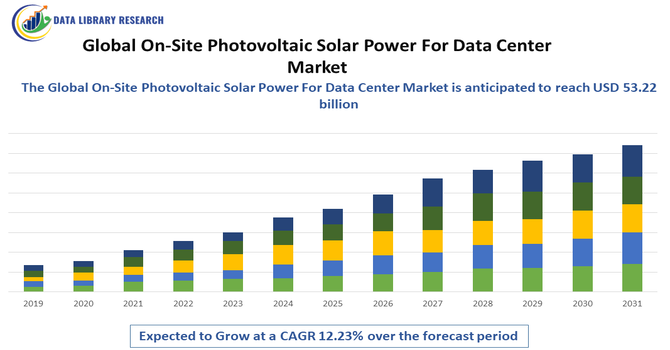
- The Global On-Site Photovoltaic Solar Power For Data Center Market size is estimated at USD 27.01 billion in 2025, and is expected to reach USD 53.22 billion by 2032, growing with a CAGR of 12.23% from 2025 to 2032.
Get Complete Analysis Of The Report - Download Updated Free Sample PDF
Global On-Site Photovoltaic Solar Power for Data Center Market refers to the worldwide industry focused on deploying solar photovoltaic systems directly at data center facilities. It includes manufacturing, installation and integration of on-site solar solutions to power data operations, reduce energy costs, enhance sustainability, and cut carbon emissions within the IT sector.
On-Site Photovoltaic Solar Power For Data Center Market: Latest Trends
The global on-site photovoltaic solar power for data center market is expanding as data centers seek sustainable, cost-efficient energy sources amid rising electricity demand. Adoption of high-efficiency PV systems, integration with energy storage and smart energy management, and decreasing solar costs are key trends. Hyperscale, enterprise, and edge facilities increasingly deploy on-site solar to cut grid reliance, boost resilience, and meet carbon-neutral goals. Regional incentives and regulatory support, especially in North America and Asia-Pacific, accelerate deployment.
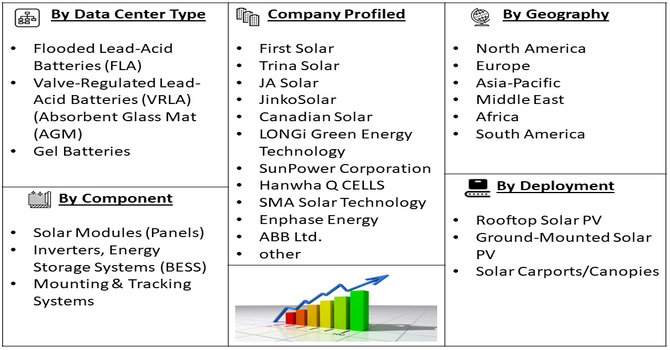
Segmentation: The Global On-Site Photovoltaic Solar Power for Data Center Market is segmented by Type of Deployment (Rooftop Solar PV, Ground-Mounted Solar PV and Solar Carports/Canopies), Data Center Type (Hyperscale Data Centers, Colocation Data Centers, Enterprise Data Centers and Edge Data Centers), Component (Solar Modules (Panels), Inverters, Energy Storage Systems (BESS), and Mounting & Tracking Systems), and Geography (North America, Europe, Asia-Pacific, Middle East and Africa, and South America). The report provides the value (in USD million) for the above segments.
For Detailed Market Segmentation - Get a Free Sample PDF
Market Drivers:
- Rising Energy Demand and Cost Optimization
The rapid expansion of hyperscale, colocation, and edge data centers is driving unprecedented electricity demand, making energy cost management a critical priority. On-site photovoltaic solar power enables data center operators to generate electricity at predictable, lower long-term costs while reducing exposure to grid price volatility and peak-demand charges.
In September 2023, Ireland-based Power Capital Renewable Energy (PCRE) entered into a power purchase agreement with Google. Under this agreement, PCRE will supply 58 MW of solar power to support Google’s data centers and office operations across Ireland. The partnership strengthens Google’s renewable energy portfolio and reinforces its commitment to operating data infrastructure using clean, sustainable energy sources. Falling solar module prices, improved conversion efficiency, and long asset lifespans further strengthen the economic case, encouraging data centers to integrate photovoltaic systems as a core component of their power strategy.
- Sustainability Goals and Regulatory Pressure
Global sustainability commitments and tightening environmental regulations are major drivers for on-site photovoltaic adoption in data centers.
In August 2023, UK-based IT services provider SCC installed rooftop solar panels at its Birmingham data center. The installation, completed at the company’s flagship CV1 facility in collaboration with Conrad Energy, includes a 737 kWp solar PV system. The rooftop system is designed to supply more than five percent of the data center’s overall energy consumption. This project demonstrates the practicality of rooftop solar for operational data centers, even when contributing partial energy needs. It encourages small-to-mid-scale operators to adopt on-site PV solutions to reduce grid dependence and emissions.
Governments across North America, Europe, and the Asia-Pacific offer incentives, tax credits, and renewable targets that further accelerate deployment. As digital infrastructure growth continues, clean on-site power is increasingly viewed as essential for maintaining brand reputation, regulatory compliance, and long-term operational sustainability.
Market Restraints:
- High Initial Capital Investment and Space Constraints
Despite long-term benefits, high upfront capital costs remain a key restraint for the on-site photovoltaic solar power market in data centers. Installation expenses for panels, inverters, mounting structures, and energy storage systems can be substantial, particularly for large-scale facilities. Additionally, many urban or legacy data centers face space limitations that restrict rooftop or adjacent land availability for solar installations. Intermittency of solar power also necessitates backup systems or grid integration, adding complexity and cost. These factors can delay adoption, especially for smaller operators with limited capital budgets or facilities not designed for renewable energy integration.
Socioeconomic Impact on On-Site Photovoltaic Solar Power for the Data Center Market
On-site photovoltaic solar adoption in data centers contributes to reduced carbon emissions, aligning with corporate sustainability and net-zero commitments. This shift lowers operational power costs and mitigates dependence on fossil-fuel-based grids, enhancing energy security for high-demand facilities. Broader PV deployment supports renewable energy job creation in manufacturing, installation, and maintenance, bolstering local economies and workforce growth. PV integration also reduces environmental externalities like air pollution, reinforcing community health and climate goals. As digital services grow globally, cleaner power foundations promote equitable infrastructure development while helping stakeholders meet tighter environmental regulations and investor-driven ESG targets.
Segmental Analysis:
- Rooftop Solar PV segment is expected to witness the highest growth over the forecast period
The rooftop solar PV segment is expected to witness the highest growth over the forecast period due to its suitability for data center infrastructure and efficient utilization of available space. Rooftop installations allow data centers to generate clean power on-site without requiring additional land, making them ideal for urban and suburban facilities. Advances in lightweight, high-efficiency panels and improved mounting systems support easier integration with existing buildings. Rooftop solar also reduces transmission losses and enhances energy security. Growing sustainability commitments, combined with incentives and declining installation costs, further drive adoption of rooftop solar PV across data center facilities globally.
- Hyperscale Data Centers segment is expected to witness the highest growth over the forecast period
The hyperscale data centers segment is projected to experience the highest growth owing to rapid expansion of cloud computing, artificial intelligence, and big data applications. These facilities consume massive amounts of electricity, making on-site solar PV an attractive solution for reducing energy costs and carbon emissions. Hyperscale operators often possess large roof areas and campuses suitable for solar deployment and have strong financial capacity to invest in renewable infrastructure. Additionally, hyperscale providers are leaders in sustainability initiatives and net-zero targets, accelerating large-scale adoption of photovoltaic systems to ensure reliable, scalable, and environmentally responsible power supply.
- Solar Modules (Panels) segment is expected to witness the highest growth over the forecast period
The solar modules segment is expected to register the highest growth as continuous technological advancements improve panel efficiency, durability, and power output. High-efficiency monocrystalline and bifacial modules enable data centers to maximize energy generation within limited space. Declining manufacturing costs and economies of scale further enhance affordability, encouraging widespread adoption. Solar modules form the core component of on-site PV systems, making demand directly proportional to new installations and capacity expansions. As data centers increasingly invest in integrated renewable solutions, demand for advanced solar panels tailored to high-reliability and long-life requirements continues to rise significantly.
- North America region is expected to witness the highest growth over the forecast period
North America is anticipated to witness the highest growth over the forecast period, driven by the region’s strong concentration of hyperscale data centers and advanced digital infrastructure. The United States leads in cloud computing, AI deployment, and renewable energy investments, supporting rapid adoption of on-site solar PV.
In September 2023, Ireland-based Power Capital Renewable Energy (PCRE) entered into a power purchase agreement with Google. Under this agreement, PCRE will supply 58 MW of solar power to support Google’s data centers and office operations across Ireland. The partnership strengthens Google’s renewable energy portfolio and reinforces its commitment to operating data infrastructure using clean, sustainable energy sources. This agreement highlights growing reliance on solar power to meet data center energy needs, encouraging wider adoption of on-site and dedicated solar solutions. It validates long-term PPAs as a viable strategy for securing renewable power at scale. The deal strengthens market confidence, attracts investment in large solar projects, and accelerates deployment of photovoltaic systems to support expanding data center infrastructure globally.
Favorable government incentives, renewable energy policies, and corporate sustainability commitments further fuel growth. Additionally, rising electricity costs and grid reliability concerns encourage data center operators to adopt on-site solar solutions. The presence of major technology companies and solar providers strengthens innovation and accelerates deployment across the region.
| Report Matrics |
Details |
| Market Size Value |
USD 53.22 billion |
| Growth Rate |
CAGR of 12.23 % |
| Forecast |
2026-2033 |
| Historical data |
2021-2024 |
| Base Year |
2025 |
| Report Coverage |
Forecasted revenue, company rating, competitive environment, growth drivers, and trends |
| Segment Coverage |
Type, Application, End-User, Geography |
| Regional Scope |
North America, Europe, Asia Pacific, Middle East |
| Customized scope |
Free customization of reports (With 3 months Analysis Support ) |
| To Learn More About This Report |
Request a Free Sample Copy |
On-Site Photovoltaic Solar Power for the Data Center Market Competitive Landscape
The market is moderately competitive, featuring major solar technology companies and energy solution providers vying for data center projects. Leading players include First Solar, Canadian Solar, SunPower, Trina Solar, JA Solar, and LONGi Green Energy, offering high-efficiency PV modules and integrated power systems. Competition emphasizes technological innovation, system reliability, and bundled solutions with storage and energy management platforms. Strategic partnerships between solar developers, data center operators, and utilities strengthen offerings and regional reach. Market share is distributed among established multinationals and regional specialists, with mergers, collaborations, and expansion into emerging markets shaping future competitiveness.
The major players for above market are:
- First Solar
- Trina Solar
- JA Solar
- JinkoSolar
- Canadian Solar
- LONGi Green Energy Technology
- SunPower Corporation
- Hanwha Q CELLS
- SMA Solar Technology
- Enphase Energy
- ABB Ltd.
- Schneider Electric
- Siemens AG
- Tesla, Inc.
- Eaton Corporation
- Huawei Technologies
- Vertiv Group
- Amazon Web Services (AWS)
- Microsoft Corporation
- Alphabet Inc. (Google)
Recent Development
- In October 2025, Google’s upcoming 1-GW hyperscale data center and first AI hub in Visakhapatnam, backed by a USD 15 billion investment, will create thousands of jobs and boost Andhra Pradesh’s economy. This milestone accelerates the region’s digital transformation and underscores the rising demand for sustainable power. Globally, such large-scale projects drive adoption of on-site photovoltaic solar systems in data centers, promoting clean energy integration and supporting the growth of eco-friendly, AI-enabled digital infrastructure worldwide.
- In July 2024, iXAfrica Data Centres has launched East Africa’s first hyperscale AI-ready facility in Nairobi, supported by Schneider Electric’s resilient power systems and EcoStruxure management solutions. The center exemplifies the growing demand for scalable, reliable, and energy-efficient data infrastructure. Globally, such developments drive adoption of on-site photovoltaic solar power, as data centers increasingly integrate sustainable, resilient energy solutions, promoting renewable energy deployment and accelerating the expansion of eco-friendly, AI-capable digital infrastructure worldwide.
Frequently Asked Questions (FAQ) :
Q1. What are the main growth-driving factors for this market?
The main drivers are corporate sustainability goals and the need to reduce high operational costs. Major tech companies are under pressure to reach "Net Zero" carbon emissions. By generating solar power directly on-site, data centers can lower their electricity bills and decrease their reliance on fossil-fuel-heavy traditional power grids.
Q2. What are the main restraining factors for this market?
The biggest challenge is the limited physical space available at data center sites for large solar arrays. Data centers require massive, constant power, but solar is intermittent and takes up a lot of land. High initial setup costs and the need for expensive battery storage systems also slow down adoption.
Q3. Which segment is expected to witness high growth?
The Hyperscale Data Center segment is expected to see the highest growth. These massive facilities, operated by giants like Amazon, Google, and Microsoft, have the capital and the large land footprints required to install significant on-site solar capacity to meet their enormous energy demands and strict green energy mandates.
Q4. Who are the top major players for this market?
Key players include major solar technology providers and energy service firms like SunPower Corporation, Schneider Electric, and Tesla. These companies provide the high-efficiency panels, smart inverters, and large-scale battery storage systems (like the Megapack) specifically designed to integrate with sensitive data center power infrastructure.
Q5. Which country is the largest player?
The United States is the largest player in this market. This is due to the high concentration of global tech headquarters, supportive federal tax incentives for renewable energy, and the rapid expansion of data center "hubs" in states with high solar potential, such as Virginia, Texas, and California.
List of Figures
Figure 1: Global On-Site Photovoltaic Solar Power For Data Center Market Revenue Breakdown (USD Billion, %) by Region, 2022 & 2029
Figure 2: Global On-Site Photovoltaic Solar Power For Data Center Market Value Share (%), By Segment 1, 2022 & 2029
Figure 3: Global On-Site Photovoltaic Solar Power For Data Center Market Forecast (USD Billion), by Sub-Segment 1, 2018-2029
Figure 4: Global On-Site Photovoltaic Solar Power For Data Center Market Forecast (USD Billion), by Sub-Segment 2, 2018-2029
Figure 5: Global On-Site Photovoltaic Solar Power For Data Center Market Value Share (%), By Segment 2, 2022 & 2029
Figure 6: Global On-Site Photovoltaic Solar Power For Data Center Market Forecast (USD Billion), by Sub-Segment 1, 2018-2029
Figure 7: Global On-Site Photovoltaic Solar Power For Data Center Market Forecast (USD Billion), by Sub-Segment 2, 2018-2029
Figure 8: Global On-Site Photovoltaic Solar Power For Data Center Market Forecast (USD Billion), by Sub-Segment 3, 2018-2029
Figure 9: Global On-Site Photovoltaic Solar Power For Data Center Market Forecast (USD Billion), by Others, 2018-2029
Figure 10: Global On-Site Photovoltaic Solar Power For Data Center Market Value Share (%), By Segment 3, 2022 & 2029
Figure 11: Global On-Site Photovoltaic Solar Power For Data Center Market Forecast (USD Billion), by Sub-Segment 1, 2018-2029
Figure 12: Global On-Site Photovoltaic Solar Power For Data Center Market Forecast (USD Billion), by Sub-Segment 2, 2018-2029
Figure 13: Global On-Site Photovoltaic Solar Power For Data Center Market Forecast (USD Billion), by Sub-Segment 3, 2018-2029
Figure 14: Global On-Site Photovoltaic Solar Power For Data Center Market Forecast (USD Billion), by Others, 2018-2029
Figure 15: Global On-Site Photovoltaic Solar Power For Data Center Market Value (USD Billion), by Region, 2022 & 2029
Figure 16: North America On-Site Photovoltaic Solar Power For Data Center Market Value Share (%), By Segment 1, 2022 & 2029
Figure 17: North America On-Site Photovoltaic Solar Power For Data Center Market Forecast (USD Billion), by Sub-Segment 1, 2018-2029
Figure 18: North America On-Site Photovoltaic Solar Power For Data Center Market Forecast (USD Billion), by Sub-Segment 2, 2018-2029
Figure 19: North America On-Site Photovoltaic Solar Power For Data Center Market Value Share (%), By Segment 2, 2022 & 2029
Figure 20: North America On-Site Photovoltaic Solar Power For Data Center Market Forecast (USD Billion), by Sub-Segment 1, 2018-2029
Figure 21: North America On-Site Photovoltaic Solar Power For Data Center Market Forecast (USD Billion), by Sub-Segment 2, 2018-2029
Figure 22: North America On-Site Photovoltaic Solar Power For Data Center Market Forecast (USD Billion), by Sub-Segment 3, 2018-2029
Figure 23: North America On-Site Photovoltaic Solar Power For Data Center Market Forecast (USD Billion), by Others, 2018-2029
Figure 24: North America On-Site Photovoltaic Solar Power For Data Center Market Value Share (%), By Segment 3, 2022 & 2029
Figure 25: North America On-Site Photovoltaic Solar Power For Data Center Market Forecast (USD Billion), by Sub-Segment 1, 2018-2029
Figure 26: North America On-Site Photovoltaic Solar Power For Data Center Market Forecast (USD Billion), by Sub-Segment 2, 2018-2029
Figure 27: North America On-Site Photovoltaic Solar Power For Data Center Market Forecast (USD Billion), by Sub-Segment 3, 2018-2029
Figure 28: North America On-Site Photovoltaic Solar Power For Data Center Market Forecast (USD Billion), by Others, 2018-2029
Figure 29: North America On-Site Photovoltaic Solar Power For Data Center Market Forecast (USD Billion), by U.S., 2018-2029
Figure 30: North America On-Site Photovoltaic Solar Power For Data Center Market Forecast (USD Billion), by Canada, 2018-2029
Figure 31: Latin America On-Site Photovoltaic Solar Power For Data Center Market Value Share (%), By Segment 1, 2022 & 2029
Figure 32: Latin America On-Site Photovoltaic Solar Power For Data Center Market Forecast (USD Billion), by Sub-Segment 1, 2018-2029
Figure 33: Latin America On-Site Photovoltaic Solar Power For Data Center Market Forecast (USD Billion), by Sub-Segment 2, 2018-2029
Figure 34: Latin America On-Site Photovoltaic Solar Power For Data Center Market Value Share (%), By Segment 2, 2022 & 2029
Figure 35: Latin America On-Site Photovoltaic Solar Power For Data Center Market Forecast (USD Billion), by Sub-Segment 1, 2018-2029
Figure 36: Latin America On-Site Photovoltaic Solar Power For Data Center Market Forecast (USD Billion), by Sub-Segment 2, 2018-2029
Figure 37: Latin America On-Site Photovoltaic Solar Power For Data Center Market Forecast (USD Billion), by Sub-Segment 3, 2018-2029
Figure 38: Latin America On-Site Photovoltaic Solar Power For Data Center Market Forecast (USD Billion), by Others, 2018-2029
Figure 39: Latin America On-Site Photovoltaic Solar Power For Data Center Market Value Share (%), By Segment 3, 2022 & 2029
Figure 40: Latin America On-Site Photovoltaic Solar Power For Data Center Market Forecast (USD Billion), by Sub-Segment 1, 2018-2029
Figure 41: Latin America On-Site Photovoltaic Solar Power For Data Center Market Forecast (USD Billion), by Sub-Segment 2, 2018-2029
Figure 42: Latin America On-Site Photovoltaic Solar Power For Data Center Market Forecast (USD Billion), by Sub-Segment 3, 2018-2029
Figure 43: Latin America On-Site Photovoltaic Solar Power For Data Center Market Forecast (USD Billion), by Others, 2018-2029
Figure 44: Latin America On-Site Photovoltaic Solar Power For Data Center Market Forecast (USD Billion), by Brazil, 2018-2029
Figure 45: Latin America On-Site Photovoltaic Solar Power For Data Center Market Forecast (USD Billion), by Mexico, 2018-2029
Figure 46: Latin America On-Site Photovoltaic Solar Power For Data Center Market Forecast (USD Billion), by Rest of Latin America, 2018-2029
Figure 47: Europe On-Site Photovoltaic Solar Power For Data Center Market Value Share (%), By Segment 1, 2022 & 2029
Figure 48: Europe On-Site Photovoltaic Solar Power For Data Center Market Forecast (USD Billion), by Sub-Segment 1, 2018-2029
Figure 49: Europe On-Site Photovoltaic Solar Power For Data Center Market Forecast (USD Billion), by Sub-Segment 2, 2018-2029
Figure 50: Europe On-Site Photovoltaic Solar Power For Data Center Market Value Share (%), By Segment 2, 2022 & 2029
Figure 51: Europe On-Site Photovoltaic Solar Power For Data Center Market Forecast (USD Billion), by Sub-Segment 1, 2018-2029
Figure 52: Europe On-Site Photovoltaic Solar Power For Data Center Market Forecast (USD Billion), by Sub-Segment 2, 2018-2029
Figure 53: Europe On-Site Photovoltaic Solar Power For Data Center Market Forecast (USD Billion), by Sub-Segment 3, 2018-2029
Figure 54: Europe On-Site Photovoltaic Solar Power For Data Center Market Forecast (USD Billion), by Others, 2018-2029
Figure 55: Europe On-Site Photovoltaic Solar Power For Data Center Market Value Share (%), By Segment 3, 2022 & 2029
Figure 56: Europe On-Site Photovoltaic Solar Power For Data Center Market Forecast (USD Billion), by Sub-Segment 1, 2018-2029
Figure 57: Europe On-Site Photovoltaic Solar Power For Data Center Market Forecast (USD Billion), by Sub-Segment 2, 2018-2029
Figure 58: Europe On-Site Photovoltaic Solar Power For Data Center Market Forecast (USD Billion), by Sub-Segment 3, 2018-2029
Figure 59: Europe On-Site Photovoltaic Solar Power For Data Center Market Forecast (USD Billion), by Others, 2018-2029
Figure 60: Europe On-Site Photovoltaic Solar Power For Data Center Market Forecast (USD Billion), by U.K., 2018-2029
Figure 61: Europe On-Site Photovoltaic Solar Power For Data Center Market Forecast (USD Billion), by Germany, 2018-2029
Figure 62: Europe On-Site Photovoltaic Solar Power For Data Center Market Forecast (USD Billion), by France, 2018-2029
Figure 63: Europe On-Site Photovoltaic Solar Power For Data Center Market Forecast (USD Billion), by Italy, 2018-2029
Figure 64: Europe On-Site Photovoltaic Solar Power For Data Center Market Forecast (USD Billion), by Spain, 2018-2029
Figure 65: Europe On-Site Photovoltaic Solar Power For Data Center Market Forecast (USD Billion), by Russia, 2018-2029
Figure 66: Europe On-Site Photovoltaic Solar Power For Data Center Market Forecast (USD Billion), by Rest of Europe, 2018-2029
Figure 67: Asia Pacific On-Site Photovoltaic Solar Power For Data Center Market Value Share (%), By Segment 1, 2022 & 2029
Figure 68: Asia Pacific On-Site Photovoltaic Solar Power For Data Center Market Forecast (USD Billion), by Sub-Segment 1, 2018-2029
Figure 69: Asia Pacific On-Site Photovoltaic Solar Power For Data Center Market Forecast (USD Billion), by Sub-Segment 2, 2018-2029
Figure 70: Asia Pacific On-Site Photovoltaic Solar Power For Data Center Market Value Share (%), By Segment 2, 2022 & 2029
Figure 71: Asia Pacific On-Site Photovoltaic Solar Power For Data Center Market Forecast (USD Billion), by Sub-Segment 1, 2018-2029
Figure 72: Asia Pacific On-Site Photovoltaic Solar Power For Data Center Market Forecast (USD Billion), by Sub-Segment 2, 2018-2029
Figure 73: Asia Pacific On-Site Photovoltaic Solar Power For Data Center Market Forecast (USD Billion), by Sub-Segment 3, 2018-2029
Figure 74: Asia Pacific On-Site Photovoltaic Solar Power For Data Center Market Forecast (USD Billion), by Others, 2018-2029
Figure 75: Asia Pacific On-Site Photovoltaic Solar Power For Data Center Market Value Share (%), By Segment 3, 2022 & 2029
Figure 76: Asia Pacific On-Site Photovoltaic Solar Power For Data Center Market Forecast (USD Billion), by Sub-Segment 1, 2018-2029
Figure 77: Asia Pacific On-Site Photovoltaic Solar Power For Data Center Market Forecast (USD Billion), by Sub-Segment 2, 2018-2029
Figure 78: Asia Pacific On-Site Photovoltaic Solar Power For Data Center Market Forecast (USD Billion), by Sub-Segment 3, 2018-2029
Figure 79: Asia Pacific On-Site Photovoltaic Solar Power For Data Center Market Forecast (USD Billion), by Others, 2018-2029
Figure 80: Asia Pacific On-Site Photovoltaic Solar Power For Data Center Market Forecast (USD Billion), by China, 2018-2029
Figure 81: Asia Pacific On-Site Photovoltaic Solar Power For Data Center Market Forecast (USD Billion), by India, 2018-2029
Figure 82: Asia Pacific On-Site Photovoltaic Solar Power For Data Center Market Forecast (USD Billion), by Japan, 2018-2029
Figure 83: Asia Pacific On-Site Photovoltaic Solar Power For Data Center Market Forecast (USD Billion), by Australia, 2018-2029
Figure 84: Asia Pacific On-Site Photovoltaic Solar Power For Data Center Market Forecast (USD Billion), by Southeast Asia, 2018-2029
Figure 85: Asia Pacific On-Site Photovoltaic Solar Power For Data Center Market Forecast (USD Billion), by Rest of Asia Pacific, 2018-2029
Figure 86: Middle East & Africa On-Site Photovoltaic Solar Power For Data Center Market Value Share (%), By Segment 1, 2022 & 2029
Figure 87: Middle East & Africa On-Site Photovoltaic Solar Power For Data Center Market Forecast (USD Billion), by Sub-Segment 1, 2018-2029
Figure 88: Middle East & Africa On-Site Photovoltaic Solar Power For Data Center Market Forecast (USD Billion), by Sub-Segment 2, 2018-2029
Figure 89: Middle East & Africa On-Site Photovoltaic Solar Power For Data Center Market Value Share (%), By Segment 2, 2022 & 2029
Figure 90: Middle East & Africa On-Site Photovoltaic Solar Power For Data Center Market Forecast (USD Billion), by Sub-Segment 1, 2018-2029
Figure 91: Middle East & Africa On-Site Photovoltaic Solar Power For Data Center Market Forecast (USD Billion), by Sub-Segment 2, 2018-2029
Figure 92: Middle East & Africa On-Site Photovoltaic Solar Power For Data Center Market Forecast (USD Billion), by Sub-Segment 3, 2018-2029
Figure 93: Middle East & Africa On-Site Photovoltaic Solar Power For Data Center Market Forecast (USD Billion), by Others, 2018-2029
Figure 94: Middle East & Africa On-Site Photovoltaic Solar Power For Data Center Market Value Share (%), By Segment 3, 2022 & 2029
Figure 95: Middle East & Africa On-Site Photovoltaic Solar Power For Data Center Market Forecast (USD Billion), by Sub-Segment 1, 2018-2029
Figure 96: Middle East & Africa On-Site Photovoltaic Solar Power For Data Center Market Forecast (USD Billion), by Sub-Segment 2, 2018-2029
Figure 97: Middle East & Africa On-Site Photovoltaic Solar Power For Data Center Market Forecast (USD Billion), by Sub-Segment 3, 2018-2029
Figure 98: Middle East & Africa On-Site Photovoltaic Solar Power For Data Center Market Forecast (USD Billion), by Others, 2018-2029
Figure 99: Middle East & Africa On-Site Photovoltaic Solar Power For Data Center Market Forecast (USD Billion), by GCC, 2018-2029
Figure 100: Middle East & Africa On-Site Photovoltaic Solar Power For Data Center Market Forecast (USD Billion), by South Africa, 2018-2029
Figure 101: Middle East & Africa On-Site Photovoltaic Solar Power For Data Center Market Forecast (USD Billion), by Rest of Middle East & Africa, 2018-2029
List of Tables
Table 1: Global On-Site Photovoltaic Solar Power For Data Center Market Revenue (USD Billion) Forecast, by Segment 1, 2018-2029
Table 2: Global On-Site Photovoltaic Solar Power For Data Center Market Revenue (USD Billion) Forecast, by Segment 2, 2018-2029
Table 3: Global On-Site Photovoltaic Solar Power For Data Center Market Revenue (USD Billion) Forecast, by Segment 3, 2018-2029
Table 4: Global On-Site Photovoltaic Solar Power For Data Center Market Revenue (USD Billion) Forecast, by Region, 2018-2029
Table 5: North America On-Site Photovoltaic Solar Power For Data Center Market Revenue (USD Billion) Forecast, by Segment 1, 2018-2029
Table 6: North America On-Site Photovoltaic Solar Power For Data Center Market Revenue (USD Billion) Forecast, by Segment 2, 2018-2029
Table 7: North America On-Site Photovoltaic Solar Power For Data Center Market Revenue (USD Billion) Forecast, by Segment 3, 2018-2029
Table 8: North America On-Site Photovoltaic Solar Power For Data Center Market Revenue (USD Billion) Forecast, by Country, 2018-2029
Table 9: Europe On-Site Photovoltaic Solar Power For Data Center Market Revenue (USD Billion) Forecast, by Segment 1, 2018-2029
Table 10: Europe On-Site Photovoltaic Solar Power For Data Center Market Revenue (USD Billion) Forecast, by Segment 2, 2018-2029
Table 11: Europe On-Site Photovoltaic Solar Power For Data Center Market Revenue (USD Billion) Forecast, by Segment 3, 2018-2029
Table 12: Europe On-Site Photovoltaic Solar Power For Data Center Market Revenue (USD Billion) Forecast, by Country, 2018-2029
Table 13: Latin America On-Site Photovoltaic Solar Power For Data Center Market Revenue (USD Billion) Forecast, by Segment 1, 2018-2029
Table 14: Latin America On-Site Photovoltaic Solar Power For Data Center Market Revenue (USD Billion) Forecast, by Segment 2, 2018-2029
Table 15: Latin America On-Site Photovoltaic Solar Power For Data Center Market Revenue (USD Billion) Forecast, by Segment 3, 2018-2029
Table 16: Latin America On-Site Photovoltaic Solar Power For Data Center Market Revenue (USD Billion) Forecast, by Country, 2018-2029
Table 17: Asia Pacific On-Site Photovoltaic Solar Power For Data Center Market Revenue (USD Billion) Forecast, by Segment 1, 2018-2029
Table 18: Asia Pacific On-Site Photovoltaic Solar Power For Data Center Market Revenue (USD Billion) Forecast, by Segment 2, 2018-2029
Table 19: Asia Pacific On-Site Photovoltaic Solar Power For Data Center Market Revenue (USD Billion) Forecast, by Segment 3, 2018-2029
Table 20: Asia Pacific On-Site Photovoltaic Solar Power For Data Center Market Revenue (USD Billion) Forecast, by Country, 2018-2029
Table 21: Middle East & Africa On-Site Photovoltaic Solar Power For Data Center Market Revenue (USD Billion) Forecast, by Segment 1, 2018-2029
Table 22: Middle East & Africa On-Site Photovoltaic Solar Power For Data Center Market Revenue (USD Billion) Forecast, by Segment 2, 2018-2029
Table 23: Middle East & Africa On-Site Photovoltaic Solar Power For Data Center Market Revenue (USD Billion) Forecast, by Segment 3, 2018-2029
Table 24: Middle East & Africa On-Site Photovoltaic Solar Power For Data Center Market Revenue (USD Billion) Forecast, by Country, 2018-2029
Research Process
Data Library Research are conducted by industry experts who offer insight on
industry structure, market segmentations technology assessment and competitive landscape (CL), and penetration, as well as on emerging trends. Their analysis is based on primary interviews (~ 80%) and secondary research (~ 20%) as well as years of professional expertise in their respective industries. Adding to this, by analysing historical trends and current market positions, our analysts predict where the market will be headed for the next five years. Furthermore, the varying trends of segment & categories geographically presented are also studied and the estimated based on the primary & secondary research.
In this particular report from the supply side Data Library Research has conducted primary surveys (interviews) with the key level executives (VP, CEO’s, Marketing Director, Business Development Manager
and SOFT) of the companies that active & prominent as well as the midsized organization
FIGURE 1: DLR RESEARH PROCESS
![research-methodology1]()
Primary Research
Extensive primary research was conducted to gain a deeper insight of the market and industry performance. The analysis is based on both primary and secondary research as well as years of professional expertise in the respective industries.
In addition to analysing current and historical trends, our analysts predict where the market is headed over the next five years.
It varies by segment for these categories geographically presented in the list of market tables. Speaking about this particular report we have conducted primary surveys (interviews) with the key level executives (VP, CEO’s, Marketing Director, Business Development Manager and many more) of the major players active in the market.
Secondary Research
Secondary research was mainly used to collect and identify information useful for the extensive, technical, market-oriented, and Friend’s study of the Global Extra Neutral Alcohol. It was also used to obtain key information about major players, market classification and segmentation according to the industry trends, geographical markets, and developments related to the market and technology perspectives. For this study, analysts have gathered information from various credible sources, such as annual reports, sec filings, journals, white papers, SOFT presentations, and company web sites.
Market Size Estimation
Both, top-down and bottom-up approaches were used to estimate and validate the size of the Global market and to estimate the size of various other dependent submarkets in the overall Extra Neutral Alcohol. The key players in the market were identified through secondary research and their market contributions in the respective geographies were determined through primary and secondary research.
Forecast Model
![research-methodology2]()