Supply Chain Analytics Market Overview
The global Supply Chain Analytics market is expected to rise at a significant rate in the forthcoming years. The increased awareness among consumers about the benefits of supply chain analytics solutions is propelling the global supply chain analytics market forward. Furthermore, retail, manufacturing, life science, healthcare, electronics, defence, consumer packaged goods, automotive, and aerospace have all seen a significant increase in demand for these types of solutions in the last several years. In addition, the growing volume of data collected and processed per day, as well as the pressing need for efficient and effective database management tools, are expected to drive demand for supply chain analytics solutions. All these factors are majorly contributed to the growth of the global Supply Chain Analytics market.
On the other hand, issues such as a lack of real-time data visibility, a lack of a reliable method for streamlining processes with planning and execution, no tractability within the desired network, and product line uncertainties are expected to limit the global growth of the supply chain analytics market. Furthermore, due to budget constraints, the adoption of these solutions is low among medium and small organizations.
| Report Metric |
Details |
| Market size available for years |
2023–2030 |
| Base year considered |
2023 |
| Forecast period |
2024–2030 |
| Forecast unit |
Value (USD Million) |
| Segments covered |
Component, Software, Services, Deployment Models, Organization Size, Industry Verticals, and Region |
| Regions covered |
North America (the U.S. and Canada), Europe (UK, Germany, France, Italy, Spain, Russia, Rest of Europe), Asia-Pacific (China, India, Japan, Australia, South East Asia, Rest of Asia Pacific), Latin America and the Middle East and Africa (Brazil, Saudi Arabia, UAE, Rest of LAMEA) |
| Companies covered |
SAS Institute Inc., Oracle Corporation, Sage Clarity LLC, Kinaxis Inc., SAP SE, IBM Corporation, Microstrategy, Genpact Ltd., Capgemini S.A., Birst Inc. |
Covid-19 Impact on Supply Chain Analytics Market
Like many other industries, COVID-19 badly knocked the electronic and semiconductor industries. This unprecedented event has impacted nearly 230 countries in just a few weeks, resulting in the forced shutdown of manufacturing and transportation activities within and across the countries. This has directly affected the overall sector's growth. It is estimated that COVID-19 to leave more than USD 30 billion impacts on the electronics and semiconductor industry. The sector is majorly affected due to transport restrictions on major electronics and semiconductor raw material providers. However, the emerging need for semiconductors in several industries will offer rapid market recovery over the future period.
Supply Chain Analytics Market Segment Overview
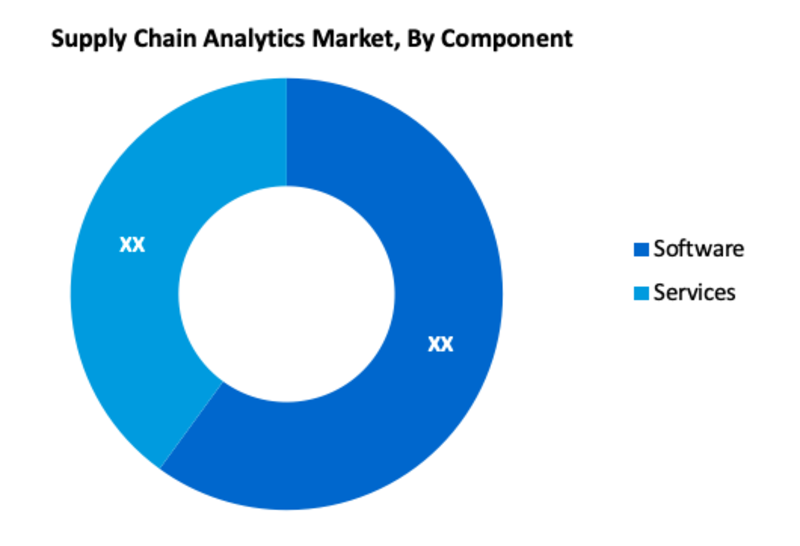
Based on the Component, the Software is one of the largest segments in the global Supply Chain Analytics market. This is due to the higher adoption of software. The demand for software, such as inventory analytics, demand analysis & forecasting, and supplier performance analytics, would drive the market growth. By Deployment Models, the cloud segment is anticipated to grow at a higher CAGR during the forecast period. Cloud-based solutions are gaining traction in the industry due to several advantages, including cost control, resource sharing, and faster implementation. Furthermore, cloud deployment provides benefits such as scalability, flexibility, and cost-effectiveness. It also gives an organization more control over the server, infrastructure, and systems, allowing them to be modified according to business needs.
Supply Chain Analytics Market, By Component
· Software
· Services
Supply Chain Analytics Market, By Software
· Demand analysis and forecasting
· Supplier performance analytics
· Spend and procurement analytics
· Inventory analytics
· Transportation and logistics analytics
Supply Chain Analytics Market, By Services
- Managed services
- Professional services
- Consulting services
- Support and maintenance services
- Deployment and integration services
Supply Chain Analytics Market, By Deployment Models
· On-premises
· Cloud
Supply Chain Analytics Market, By Organization Size
· Large enterprises
· Small and Medium-sized Enterprises (SMEs)
Supply Chain Analytics Market, By Industry Verticals
· Automotive
· Retail and consumer goods
· F&B; manufacturing
· Machinery and industrial equipment manufacturing
· Pharmaceuticals
· Government
· Energy and utilities
Supply Chain Analytics Market Regional Overview
In terms of region, North America accounts for a significant share in the global Supply Chain Analytics market. This is due to the presence of several leading players in the region. On the other side, the market in the Asia Pacific is also anticipated to rise at a higher level in the forecast period. This is because of the flourishing manufacturing activities in the region along with rising investments for foreign expansion. In addition to this, the growing awareness among organizations about the benefits of supply chain analytics is also anticipated to boost the growth of the market in these regions.
Supply Chain Analytics Market, By Geography
· North America (US & Canada)
· Europe (UK, Germany, France, Italy, Spain, Russia & Rest of Europe)
· Asia-Pacific (Japan, China, India, Australia, & South Korea, & Rest of Asia-Pacific)
· LAMEA (Brazil, Saudi Arabia, UAE & Rest of LAMEA)
Supply Chain Analytics Market, Key Players
· SAS Institute Inc.
· Oracle Corporation
· Sage Clarity LLC
· Kinaxis Inc.
· SAP SE
· IBM Corporation
· Microstrategy
· Genpact Ltd.
· Capgemini S.A.
· Birst Inc.
Frequently Asked Questions (FAQ) :
Q1. What are the driving factors for the Supply Chain Analytics market?
The increased awareness among consumers about the benefits of supply chain analytics solutions is propelling the global supply chain analytics market forward.
Q2. Which region holds the largest share in the Supply Chain Analytics market?
North America held the largest share in the global Supply Chain Analytics market
Q3. Which Segments are covered in the Supply Chain Analytics market report?
Component, Software, Services, Deployment Models, Organization Size, Industry Verticals, and Region, these segments are covered in the Supply Chain Analytics market report.
Q4. Which segment is projected to hold the largest share in the Supply Chain Analytics Market. ?
The software segment is projected to hold the largest share in the Supply Chain Analytics Market.
Q5. Which are the prominent players in the Supply Chain Analytics Market?
SAS Institute Inc., Oracle Corporation, Sage Clarity LLC, Kinaxis Inc., SAP SE, IBM Corporation, Microstrategy, Genpact Ltd., Capgemini S.A., Birst Inc. are some key players in the Supply Chain Analytics Market.
List of Figures
Figure 1: Global Supply Chain Analytics Market Revenue Breakdown (USD Billion, %) by Region, 2019 & 2027
Figure 2: Global Supply Chain Analytics Market Value Share (%), By Segment 1, 2019 & 2027
Figure 3: Global Supply Chain Analytics Market Forecast (USD Billion), by Sub-Segment 1, 2016-2027
Figure 4: Global Supply Chain Analytics Market Forecast (USD Billion), by Sub-Segment 2, 2016-2027
Figure 5: Global Supply Chain Analytics Market Value Share (%), By Segment 2, 2019 & 2027
Figure 6: Global Supply Chain Analytics Market Forecast (USD Billion), by Sub-Segment 1, 2016-2027
Figure 7: Global Supply Chain Analytics Market Forecast (USD Billion), by Sub-Segment 2, 2016-2027
Figure 8: Global Supply Chain Analytics Market Forecast (USD Billion), by Sub-Segment 3, 2016-2027
Figure 9: Global Supply Chain Analytics Market Forecast (USD Billion), by Others, 2016-2027
Figure 10: Global Supply Chain Analytics Market Value Share (%), By Segment 3, 2019 & 2027
Figure 11: Global Supply Chain Analytics Market Forecast (USD Billion), by Sub-Segment 1, 2016-2027
Figure 12: Global Supply Chain Analytics Market Forecast (USD Billion), by Sub-Segment 2, 2016-2027
Figure 13: Global Supply Chain Analytics Market Forecast (USD Billion), by Sub-Segment 3, 2016-2027
Figure 14: Global Supply Chain Analytics Market Forecast (USD Billion), by Others, 2016-2027
Figure 15: Global Supply Chain Analytics Market Value (USD Billion), by Region, 2019 & 2027
Figure 16: North America Supply Chain Analytics Market Value Share (%), By Segment 1, 2019 & 2027
Figure 17: North America Supply Chain Analytics Market Forecast (USD Billion), by Sub-Segment 1, 2016-2027
Figure 18: North America Supply Chain Analytics Market Forecast (USD Billion), by Sub-Segment 2, 2016-2027
Figure 19: North America Supply Chain Analytics Market Value Share (%), By Segment 2, 2019 & 2027
Figure 20: North America Supply Chain Analytics Market Forecast (USD Billion), by Sub-Segment 1, 2016-2027
Figure 21: North America Supply Chain Analytics Market Forecast (USD Billion), by Sub-Segment 2, 2016-2027
Figure 22: North America Supply Chain Analytics Market Forecast (USD Billion), by Sub-Segment 3, 2016-2027
Figure 23: North America Supply Chain Analytics Market Forecast (USD Billion), by Others, 2016-2027
Figure 24: North America Supply Chain Analytics Market Value Share (%), By Segment 3, 2019 & 2027
Figure 25: North America Supply Chain Analytics Market Forecast (USD Billion), by Sub-Segment 1, 2016-2027
Figure 26: North America Supply Chain Analytics Market Forecast (USD Billion), by Sub-Segment 2, 2016-2027
Figure 27: North America Supply Chain Analytics Market Forecast (USD Billion), by Sub-Segment 3, 2016-2027
Figure 28: North America Supply Chain Analytics Market Forecast (USD Billion), by Others, 2016-2027
Figure 29: North America Supply Chain Analytics Market Forecast (USD Billion), by U.S., 2016-2027
Figure 30: North America Supply Chain Analytics Market Forecast (USD Billion), by Canada, 2016-2027
Figure 31: Latin America Supply Chain Analytics Market Value Share (%), By Segment 1, 2019 & 2027
Figure 32: Latin America Supply Chain Analytics Market Forecast (USD Billion), by Sub-Segment 1, 2016-2027
Figure 33: Latin America Supply Chain Analytics Market Forecast (USD Billion), by Sub-Segment 2, 2016-2027
Figure 34: Latin America Supply Chain Analytics Market Value Share (%), By Segment 2, 2019 & 2027
Figure 35: Latin America Supply Chain Analytics Market Forecast (USD Billion), by Sub-Segment 1, 2016-2027
Figure 36: Latin America Supply Chain Analytics Market Forecast (USD Billion), by Sub-Segment 2, 2016-2027
Figure 37: Latin America Supply Chain Analytics Market Forecast (USD Billion), by Sub-Segment 3, 2016-2027
Figure 38: Latin America Supply Chain Analytics Market Forecast (USD Billion), by Others, 2016-2027
Figure 39: Latin America Supply Chain Analytics Market Value Share (%), By Segment 3, 2019 & 2027
Figure 40: Latin America Supply Chain Analytics Market Forecast (USD Billion), by Sub-Segment 1, 2016-2027
Figure 41: Latin America Supply Chain Analytics Market Forecast (USD Billion), by Sub-Segment 2, 2016-2027
Figure 42: Latin America Supply Chain Analytics Market Forecast (USD Billion), by Sub-Segment 3, 2016-2027
Figure 43: Latin America Supply Chain Analytics Market Forecast (USD Billion), by Others, 2016-2027
Figure 44: Latin America Supply Chain Analytics Market Forecast (USD Billion), by Brazil, 2016-2027
Figure 45: Latin America Supply Chain Analytics Market Forecast (USD Billion), by Mexico, 2016-2027
Figure 46: Latin America Supply Chain Analytics Market Forecast (USD Billion), by Rest of Latin America, 2016-2027
Figure 47: Europe Supply Chain Analytics Market Value Share (%), By Segment 1, 2019 & 2027
Figure 48: Europe Supply Chain Analytics Market Forecast (USD Billion), by Sub-Segment 1, 2016-2027
Figure 49: Europe Supply Chain Analytics Market Forecast (USD Billion), by Sub-Segment 2, 2016-2027
Figure 50: Europe Supply Chain Analytics Market Value Share (%), By Segment 2, 2019 & 2027
Figure 51: Europe Supply Chain Analytics Market Forecast (USD Billion), by Sub-Segment 1, 2016-2027
Figure 52: Europe Supply Chain Analytics Market Forecast (USD Billion), by Sub-Segment 2, 2016-2027
Figure 53: Europe Supply Chain Analytics Market Forecast (USD Billion), by Sub-Segment 3, 2016-2027
Figure 54: Europe Supply Chain Analytics Market Forecast (USD Billion), by Others, 2016-2027
Figure 55: Europe Supply Chain Analytics Market Value Share (%), By Segment 3, 2019 & 2027
Figure 56: Europe Supply Chain Analytics Market Forecast (USD Billion), by Sub-Segment 1, 2016-2027
Figure 57: Europe Supply Chain Analytics Market Forecast (USD Billion), by Sub-Segment 2, 2016-2027
Figure 58: Europe Supply Chain Analytics Market Forecast (USD Billion), by Sub-Segment 3, 2016-2027
Figure 59: Europe Supply Chain Analytics Market Forecast (USD Billion), by Others, 2016-2027
Figure 60: Europe Supply Chain Analytics Market Forecast (USD Billion), by U.K., 2016-2027
Figure 61: Europe Supply Chain Analytics Market Forecast (USD Billion), by Germany, 2016-2027
Figure 62: Europe Supply Chain Analytics Market Forecast (USD Billion), by France, 2016-2027
Figure 63: Europe Supply Chain Analytics Market Forecast (USD Billion), by Italy, 2016-2027
Figure 64: Europe Supply Chain Analytics Market Forecast (USD Billion), by Spain, 2016-2027
Figure 65: Europe Supply Chain Analytics Market Forecast (USD Billion), by Russia, 2016-2027
Figure 66: Europe Supply Chain Analytics Market Forecast (USD Billion), by Rest of Europe, 2016-2027
Figure 67: Asia Pacific Supply Chain Analytics Market Value Share (%), By Segment 1, 2019 & 2027
Figure 68: Asia Pacific Supply Chain Analytics Market Forecast (USD Billion), by Sub-Segment 1, 2016-2027
Figure 69: Asia Pacific Supply Chain Analytics Market Forecast (USD Billion), by Sub-Segment 2, 2016-2027
Figure 70: Asia Pacific Supply Chain Analytics Market Value Share (%), By Segment 2, 2019 & 2027
Figure 71: Asia Pacific Supply Chain Analytics Market Forecast (USD Billion), by Sub-Segment 1, 2016-2027
Figure 72: Asia Pacific Supply Chain Analytics Market Forecast (USD Billion), by Sub-Segment 2, 2016-2027
Figure 73: Asia Pacific Supply Chain Analytics Market Forecast (USD Billion), by Sub-Segment 3, 2016-2027
Figure 74: Asia Pacific Supply Chain Analytics Market Forecast (USD Billion), by Others, 2016-2027
Figure 75: Asia Pacific Supply Chain Analytics Market Value Share (%), By Segment 3, 2019 & 2027
Figure 76: Asia Pacific Supply Chain Analytics Market Forecast (USD Billion), by Sub-Segment 1, 2016-2027
Figure 77: Asia Pacific Supply Chain Analytics Market Forecast (USD Billion), by Sub-Segment 2, 2016-2027
Figure 78: Asia Pacific Supply Chain Analytics Market Forecast (USD Billion), by Sub-Segment 3, 2016-2027
Figure 79: Asia Pacific Supply Chain Analytics Market Forecast (USD Billion), by Others, 2016-2027
Figure 80: Asia Pacific Supply Chain Analytics Market Forecast (USD Billion), by China, 2016-2027
Figure 81: Asia Pacific Supply Chain Analytics Market Forecast (USD Billion), by India, 2016-2027
Figure 82: Asia Pacific Supply Chain Analytics Market Forecast (USD Billion), by Japan, 2016-2027
Figure 83: Asia Pacific Supply Chain Analytics Market Forecast (USD Billion), by Australia, 2016-2027
Figure 84: Asia Pacific Supply Chain Analytics Market Forecast (USD Billion), by Southeast Asia, 2016-2027
Figure 85: Asia Pacific Supply Chain Analytics Market Forecast (USD Billion), by Rest of Asia Pacific, 2016-2027
Figure 86: Middle East & Africa Supply Chain Analytics Market Value Share (%), By Segment 1, 2019 & 2027
Figure 87: Middle East & Africa Supply Chain Analytics Market Forecast (USD Billion), by Sub-Segment 1, 2016-2027
Figure 88: Middle East & Africa Supply Chain Analytics Market Forecast (USD Billion), by Sub-Segment 2, 2016-2027
Figure 89: Middle East & Africa Supply Chain Analytics Market Value Share (%), By Segment 2, 2019 & 2027
Figure 90: Middle East & Africa Supply Chain Analytics Market Forecast (USD Billion), by Sub-Segment 1, 2016-2027
Figure 91: Middle East & Africa Supply Chain Analytics Market Forecast (USD Billion), by Sub-Segment 2, 2016-2027
Figure 92: Middle East & Africa Supply Chain Analytics Market Forecast (USD Billion), by Sub-Segment 3, 2016-2027
Figure 93: Middle East & Africa Supply Chain Analytics Market Forecast (USD Billion), by Others, 2016-2027
Figure 94: Middle East & Africa Supply Chain Analytics Market Value Share (%), By Segment 3, 2019 & 2027
Figure 95: Middle East & Africa Supply Chain Analytics Market Forecast (USD Billion), by Sub-Segment 1, 2016-2027
Figure 96: Middle East & Africa Supply Chain Analytics Market Forecast (USD Billion), by Sub-Segment 2, 2016-2027
Figure 97: Middle East & Africa Supply Chain Analytics Market Forecast (USD Billion), by Sub-Segment 3, 2016-2027
Figure 98: Middle East & Africa Supply Chain Analytics Market Forecast (USD Billion), by Others, 2016-2027
Figure 99: Middle East & Africa Supply Chain Analytics Market Forecast (USD Billion), by GCC, 2016-2027
Figure 100: Middle East & Africa Supply Chain Analytics Market Forecast (USD Billion), by South Africa, 2016-2027
Figure 101: Middle East & Africa Supply Chain Analytics Market Forecast (USD Billion), by Rest of Middle East & Africa, 2016-2027
List of Tables
Table 1: Global Supply Chain Analytics Market Revenue (USD Billion) Forecast, by Segment 1, 2016-2027
Table 2: Global Supply Chain Analytics Market Revenue (USD Billion) Forecast, by Segment 2, 2016-2027
Table 3: Global Supply Chain Analytics Market Revenue (USD Billion) Forecast, by Segment 3, 2016-2027
Table 4: Global Supply Chain Analytics Market Revenue (USD Billion) Forecast, by Region, 2016-2027
Table 5: North America Supply Chain Analytics Market Revenue (USD Billion) Forecast, by Segment 1, 2016-2027
Table 6: North America Supply Chain Analytics Market Revenue (USD Billion) Forecast, by Segment 2, 2016-2027
Table 7: North America Supply Chain Analytics Market Revenue (USD Billion) Forecast, by Segment 3, 2016-2027
Table 8: North America Supply Chain Analytics Market Revenue (USD Billion) Forecast, by Country, 2016-2027
Table 9: Europe Supply Chain Analytics Market Revenue (USD Billion) Forecast, by Segment 1, 2016-2027
Table 10: Europe Supply Chain Analytics Market Revenue (USD Billion) Forecast, by Segment 2, 2016-2027
Table 11: Europe Supply Chain Analytics Market Revenue (USD Billion) Forecast, by Segment 3, 2016-2027
Table 12: Europe Supply Chain Analytics Market Revenue (USD Billion) Forecast, by Country, 2016-2027
Table 13: Latin America Supply Chain Analytics Market Revenue (USD Billion) Forecast, by Segment 1, 2016-2027
Table 14: Latin America Supply Chain Analytics Market Revenue (USD Billion) Forecast, by Segment 2, 2016-2027
Table 15: Latin America Supply Chain Analytics Market Revenue (USD Billion) Forecast, by Segment 3, 2016-2027
Table 16: Latin America Supply Chain Analytics Market Revenue (USD Billion) Forecast, by Country, 2016-2027
Table 17: Asia Pacific Supply Chain Analytics Market Revenue (USD Billion) Forecast, by Segment 1, 2016-2027
Table 18: Asia Pacific Supply Chain Analytics Market Revenue (USD Billion) Forecast, by Segment 2, 2016-2027
Table 19: Asia Pacific Supply Chain Analytics Market Revenue (USD Billion) Forecast, by Segment 3, 2016-2027
Table 20: Asia Pacific Supply Chain Analytics Market Revenue (USD Billion) Forecast, by Country, 2016-2027
Table 21: Middle East & Africa Supply Chain Analytics Market Revenue (USD Billion) Forecast, by Segment 1, 2016-2027
Table 22: Middle East & Africa Supply Chain Analytics Market Revenue (USD Billion) Forecast, by Segment 2, 2016-2027
Table 23: Middle East & Africa Supply Chain Analytics Market Revenue (USD Billion) Forecast, by Segment 3, 2016-2027
Table 24: Middle East & Africa Supply Chain Analytics Market Revenue (USD Billion) Forecast, by Country, 2016-2027
Research Process
Data Library Research are conducted by industry experts who offer insight on
industry structure, market segmentations technology assessment and competitive landscape (CL), and penetration, as well as on emerging trends. Their analysis is based on primary interviews (~ 80%) and secondary research (~ 20%) as well as years of professional expertise in their respective industries. Adding to this, by analysing historical trends and current market positions, our analysts predict where the market will be headed for the next five years. Furthermore, the varying trends of segment & categories geographically presented are also studied and the estimated based on the primary & secondary research.
In this particular report from the supply side Data Library Research has conducted primary surveys (interviews) with the key level executives (VP, CEO’s, Marketing Director, Business Development Manager
and SOFT) of the companies that active & prominent as well as the midsized organization
FIGURE 1: DLR RESEARH PROCESS
![research-methodology1]()
Primary Research
Extensive primary research was conducted to gain a deeper insight of the market and industry performance. The analysis is based on both primary and secondary research as well as years of professional expertise in the respective industries.
In addition to analysing current and historical trends, our analysts predict where the market is headed over the next five years.
It varies by segment for these categories geographically presented in the list of market tables. Speaking about this particular report we have conducted primary surveys (interviews) with the key level executives (VP, CEO’s, Marketing Director, Business Development Manager and many more) of the major players active in the market.
Secondary Research
Secondary research was mainly used to collect and identify information useful for the extensive, technical, market-oriented, and Friend’s study of the Global Extra Neutral Alcohol. It was also used to obtain key information about major players, market classification and segmentation according to the industry trends, geographical markets, and developments related to the market and technology perspectives. For this study, analysts have gathered information from various credible sources, such as annual reports, sec filings, journals, white papers, SOFT presentations, and company web sites.
Market Size Estimation
Both, top-down and bottom-up approaches were used to estimate and validate the size of the Global market and to estimate the size of various other dependent submarkets in the overall Extra Neutral Alcohol. The key players in the market were identified through secondary research and their market contributions in the respective geographies were determined through primary and secondary research.
Forecast Model
![research-methodology2]()